Sell Side Presentation - Jack Bowles 12 September 2019
←
→
Page content transcription
If your browser does not render page correctly, please read the page content below

Sell Side Presentation
12 September 2019
Jack Bowles
Chief Executive

Tadeu Marroco
Finance Director

Important Information
The information contained in this presentation in relation to British American Tobacco p.l.c. (“BAT”) and its subsidiaries has been prepared solely for use at this presentation. The
presentation is not directed to, or intended for distribution to or use by, any person or entity that is a citizen or resident or located in any jurisdiction where such distribution, publication,
availability or use would be contrary to law or regulation or which would require any registration or licensing within such jurisdiction.

References in this presentation to ‘British American Tobacco’, ‘BAT’, ‘Group’, ‘we’, ‘us’ and ‘our’ when denoting opinion refer to British American Tobacco p.l.c. and when denoting
tobacco business activity refer to British American Tobacco Group operating companies, collectively or individually as the case may be.

The information contained in this presentation does not purport to be comprehensive and has not been independently verified. Certain industry and market data contained in this
presentation has come from third party sources. Third party publications, studies and surveys generally state that the data contained therein have been obtained from sources believed
to be reliable, but that there is no guarantee of accuracy or completeness of such data.

Forward-looking Statements

This presentation does not constitute an invitation to underwrite, subscribe for, or otherwise acquire or dispose of any BAT shares or other securities. This presentation contains certain
forward-looking statements, made within the meaning of Section 21E of the United States Securities Exchange Act of 1934, regarding our intentions, beliefs or current expectations
concerning, amongst other things, our results of operations, financial condition, liquidity, prospects, growth, strategies and the economic and business circumstances occurring from
time to time in the countries and markets in which the Group operates.

These statements are often, but not always, made through the use of words or phrases such as “believe,” “anticipate,” “could,” “may,” “would,” “should,” “intend,” “plan,” “potential,”
“predict,” “will,” “expect,” “estimate,” “project,” “positioned,” “strategy,” “outlook”, “target” and similar expressions.

It is believed that the expectations reflected in this presentation are reasonable but they may be affected by a wide range of variables that could cause actual results to differ materially
from those currently anticipated.

The forward-looking statements reflect knowledge and information available at the date of preparation of this presentation and BAT undertakes no obligation to update or revise these
forward-looking statements, whether as a result of new information, future events or otherwise.

Among the key factors that could cause actual results to differ materially from those projected in the forward-looking statements are uncertainties related to the following: the impact of
competition from illicit trade; the impact of adverse domestic or international legislation and regulation; changes in domestic or international tax laws and rates; adverse litigation and
dispute outcomes and the effect of such outcomes on the Group’s financial condition; changes or differences in domestic or international economic or political conditions; adverse
decisions by domestic or international regulatory bodies; the impact of market size reduction and consumer down-trading; translational and transactional foreign exchange rate
exposure; the impact of serious injury, illness or death in the workplace; the ability to maintain credit ratings and to fund the business under the current capital structure; the inability to
develop, commercialise and roll-out Potentially Reduced-Risk Products; and changes in the market position, businesses, financial condition, results of operations or prospects of the
Group.

Important Information
Forward-looking Statements (continued)

Additional information concerning these and other factors can be found in BAT’s filings with the U.S. Securities and Exchange Commission (“SEC”), including the Annual Report on
Form 20-F filed on 15 March 2019 and Current Reports on Form 6-K, which may be obtained free of charge at the SEC’s website, http://www.sec.gov, and BAT’s Annual Reports,
which may be obtained free of charge from the British American Tobacco website www.bat.com.

Past performance is no guide to future performance and persons needing advice should consult an independent financial adviser. Readers are cautioned not to place undue reliance
on such forward-looking statements.

No Profit or Earnings Per Share Forecasts

No statement in this presentation is intended to be a profit forecast and no statement in this presentation should be interpreted to mean that earnings per share of BAT for the current
or future financial years would necessarily match or exceed the historical published earnings per share of BAT.

Audience

The material in this presentation is provided for the purpose of giving information about BAT and its subsidiaries to investors only and is not intended for general consumers. BAT, its
directors, employees, agents or advisers do not accept or assume responsibility to any other person to whom this material is shown or into whose hands it may come and any such
responsibility or liability is expressly disclaimed. The material in this presentation is not provided for product advertising, promotional or marketing purposes. This material does not
constitute and should not be construed as constituting an offer to sell, or a solicitation of an offer to buy, any of our products. Our products are sold only in compliance with the laws of
the particular jurisdictions in which they are sold.

Additional Information

All financial statements and financial information provided by or with respect to the US or Reynolds American Inc. (“RAI”) are initially prepared on the basis of U.S. GAAP and
constitute the primary financial statements or financial records of the US business/RAI. This financial information is then converted to International Financial Reporting Standards as
issued by the IASB and as adopted by the European Union (IFRS) for the purpose of consolidation within the results of the BAT Group. To the extent any such financial information
provided in this presentation relates to the US or RAI it is provided as an explanation of, or supplement to, RAI’s primary U.S. GAAP based financial statements and information.

Our vapour product Vuse, and oral products Grizzly, Camel Snus, Velo and Kodiak, which are only sold in the US, are subject to FDA regulation and no reduced-risk claims will be
made to these products without agency clearance.

Delivering a stronger, simpler, faster organisation

      COMBUSTIBLE VALUE GROWTH

         STEP-CHANGE IN NEW CATEGORIES

                   SIMPLIFY THE COMPANY
Quantum | Simplifying the Company

COMBUSTIBLE VALUE        STEP-CHANGE            SIMPLIFY THE
    GROWTH            IN NEW CATEGORIES           COMPANY

                                          Quantum is about growth

                                            Deliver simplification
                                                      &
                                          Release funds to invest in
                                              New Categories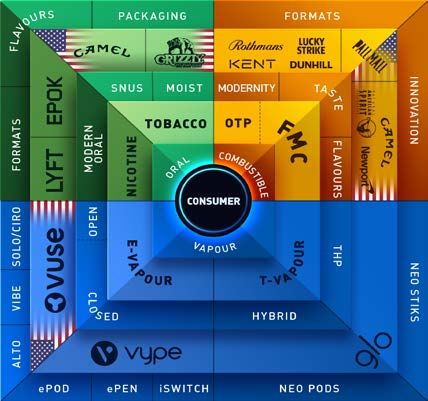
Quantum | Building a stronger simpler faster organisation
           Objectives                                  Actions                        Change ways of working
• Faster, more agile                 • Reduce management layers - Reporting        • Streamline Global Business
  organisation                         Business Units - 28 to 18                     Processes

• Increased accountability           • Regional Support teams costs -50%           • Enhance business and functional
                                                                                     connectivity
• More empowered employees           • Delivery - focused local business units
                                                                                   • Organisational behaviours
                                     • Drive efficiencies in tail markets               • Speed of delivery
• Quicker decision making
                                                                                        • Recognition of success
                                     • Expand scope of Global Shared Services
• Release resources for                Centre activities                           • Remove duplicative processes
  reinvestment                            • Transactional – centre of excellence
                                          • Robotic process automation
                                          • Data analytics

                                     • Optimise spans and layers, impacting:
                                          • 2,300 roles
                                          • >20% of senior management roles

                             Substantial completion expected by January 2020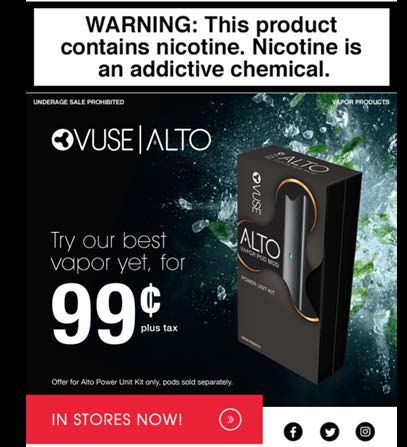
Sell Side Presentation

Tadeu Marroco
Finance Director

Strong H1 results

                                                                                               Adjusted
                    Volume                                         Adjusted                   Profit from    Adjusted
                                                                   Revenue                    Operations    Diluted EPS
                     -3.5%                                          +4.1%*                     +5.9%*        +7.1%*

                                                                                               Strategic     Strategic
                Group                                              Group                                       brand
              market share                                       value share                 brand market   value share
                                                                                                 share
                       Flat                                         +10bps                     +60bps        +50bps

*Adjusted and constant rate basis. See Appendix A3 for share metrics. Source: Company data
Consumer insights drive portfolio approach

› Evidence of poly-usage across categories supports BAT’s portfolio approach
› New consumption moments
› Regulation drives different market environments
    › Variable cross category marketing freedoms
Vapour | Strong progress in key markets
                                                                                                        ePen3 reached 10% Value share in
                                                                                                        Aug; surpassed JUUL
                                 › Good results on $0.99
                                    promo and 2.4% launch
                                                                                                        Vype is the market leader and growing:
                                                                                                        16.3% Value share (Doubled in 9 months)
                                     4x         Alto Device Sales
                                                (vs. pre-promotion)1

                                                                                                        Vype accounts for > 50% of the closed
                                                                                                        vapour segment
                                 +39%                Alto pod volume
                                                     (vs. pre-promotion) 1
                                                                                                         Vype grew +540bps in Jul’19 vs. Mar’19;
                                                                                                         gaining ground on JUUL
                                  6.7%                Alto pod share
                                                      (+270bps vs. pre-
                                     Share            promotion) 2                                        Digital model off to a great start;
                                                                                                          >40% of sales in Zero-Nic
1: Compares Week 5 to pre-promotion week 0. STR volume (PUK) and RSD volume (pods) in   Source: Latest month value share in vapour segment based on scan in measured channels
Phase 1 promotion area (4 states)
2: Share based on Retail Scan Data in latest week See Appendix A3 for share metrics.
THP | Strong push in October in Japan and building
momentum in Russia
Japan accounts for 2/3 of global industry THP volumes
› Glo starting to build
momentum in Russia
5x
Offtake Volume
Jul vs. Jan
+40 bps
Closing in on 1%
Share in Moscow*
*Source: Nielsen share of shop handling in Moscow
BAT share of total Nicotine in Japan 18.5% (+220bps vs. FY2018)
See Appendix A3 for share metrics. Total nicotine share based on w/c Aug 19th)Modern Oral| Fastest growing Modern Oral company in USA;
leadership in the rest of the world
9.1%
Double
digit share
38% in 14 states!
VELO Share
Share in
New Jersey #1 Brand
25%
In total oral within 4 months
of Modern oral
with 31% volume share
in 8 weeks
23% Share in
Washington Source: Nielsen share within total oral segment
Share in
Michigan
Geo-Expansion
Las Vegas Las Vegas Monorail
› Expansion to 4 markets in
last 2 months (USA, CZE,
GER, KEN)
› Currently in 12 markets;
17 expected by year end
Source: Volume share in modern oral based on Retail Scan data
See Appendix A3 for share metrics.Combustibles| Strong performance fuelling growth
Value Share Growth Strong H1 Pricing Delivered Winning in Strategic Segments
28.60
28.50
+10bps
22.80
28.5
22.60
+7.0%
83 % Of switchers & trialists accounted for by
Strategic Segments
CAPSULES
+50bps Cig Price mix
28.40
22.40
28.30
22.3
22.20
28.20
28.3
22.00
Source: Company data. H1 19 vs. FY18 BAT Drive
+100bps +180bps +70bps
28.10
brands share of
Corporate Value Share segment change
21.80
In USA, winning where it matters
28.00
Strategic Brands Value Share
>90 %
21.5
21.60
27.90
+70 bps
Of BAT brand activities focus on
+50 bps
Strategic Segments
27.80 21.40
Q1`18 Q2`18 Q3`18 Q4`18 Q1`19 Q2`19 Q3`19
(YTD)
+60 bps
Premium ASU30
Share Share
Menthol
+30 bps +80 bps +10 bps
Share
*Source: Company data. Q3’19 (YTD) vs. FY18 Source: Company data. YTD 19 vs. SPLY Source: Company data: Track 2018, Company operational planning.
New Product Innovation analysis, based on Retail Audit data from
In-market growths are YTD’19 vs. FY’18 January 2015 to September 2018.
Competitor 1 refers to PMI. Competitor 2 refers to ITG
See Appendix A3 for share metrics.Delivering on our financial objectives
2019 Guidance H2 priorities
Revenue +3-5% *
Mid-Upper
› Deliver Quantum and release additional
New Category Revenue +30-50%* resources
Operating Margin +50-100 bps › Drive value growth from combustibles
Profit From Operations +5-7%*
› Deliver New category growth around the
Upper middle of 30-50% range
Diluted EPS High Single Figure* › Deliver the Full Year guidance
Leverage -0.4x ex-currency
* Adjusted and constant rate basis. See Appendix A1-A2. Source: Company data Source: Internal EstimatesOn track for a good year
COMBUSTIBLE VALUE › On track for the full year guidance
GROWTH
› New Category revenue expected
around the middle of 30-50% range
STEP-CHANGE
IN NEW CATEGORIES › Building a stronger, simpler, faster
organisation
SIMPLIFY THE › Delivering high single figure EPS
COMPANY growthSell Side Presentation Jack Bowles Chief Executive Tadeu Marroco Finance Director
Appendix
A1: Adjusting (Adj.)
Adjusting items are significant items of certain financial measures which individually or, if of a similar type, in aggregate, are relevant to an understanding of the Group’s
underlying financial performance because of their size, nature or incidence. In identifying and quantifying adjusting items, the Group consistently applies a policy that defines
criteria that are required to be met for an item to be classified as adjusting. The Group believes that these additional measures, which are used internally, are useful to users of
the financial information in helping them understand the underlying business performance.

A2: Constant currency
Movements in foreign exchange rates have impacted the Group's financial results. Measures are calculated based on a retranslation, at prior year’s exchange rates, of the
current year’s results of the Group and where, applicable, its segments. Although the Group does not believe that these measures are a substitute for IFRS measures, the Group
management board does believe that such results excluding the impact of currency fluctuations year on year provide additional useful information to investors regarding the
Group's operating performance on a local currency basis.

A3: Share metrics
Volume share: The retail sales volume of the product sold as a proportion of total retail sales volume in that category.
Value share: The retail sales value of the product sold as a proportion of total retail sales value in that category.
Premium share: The retail sales volume of the premium product sold as a proportion of total retail sales volume of premium products in that category.
Nicotine share: The retail sales volume of the nicotine product sold as a proportion of total nicotine product volume in that category.
Share of handling: The retail sales volume of the nicotine product sold as a proportion of the outlets within which the product is available.
You can also read