2020 First Quarter Earnings - Ted Doheny, President & CEO Jim Sullivan, SVP & CFO Lori Chaitman, VP Investor Relations

Page created by Ruben Lane
 
CONTINUE READING
2020 First Quarter Earnings - Ted Doheny, President & CEO Jim Sullivan, SVP & CFO Lori Chaitman, VP Investor Relations
2020 First Quarter Earnings
  May 5, 2020
  Conference Call Supplement (Unaudited Results)

Ted Doheny, President & CEO
Jim Sullivan, SVP & CFO
Lori Chaitman, VP Investor Relations
2020 First Quarter Earnings - Ted Doheny, President & CEO Jim Sullivan, SVP & CFO Lori Chaitman, VP Investor Relations
Safe Harbor and Regulation G Statement
This presentation contains “forward-looking statements” within the meaning of the safe harbor provisions of the Private Securities Litigation Reform Act of 1995 concerning our business,
consolidated financial condition and results of operations. Forward-looking statements are subject to risks and uncertainties, many of which are outside our control, which could cause actual
results to differ materially from these statements. Therefore, you should not rely on any of these forward-looking statements. Forward-looking statements can be identified by such words as
“anticipate,” “believe,” “plan,” “assume,” “could,” “should,” “estimate,” “expect,” “intend,” “potential,” “seek,” “predict,” “may,” “will” and similar references to future periods. All statements other than
statements of historical facts included in this presentation regarding our strategies, prospects, financial condition, operations, costs, plans and objectives are forward-looking statements.
Examples of forward-looking statements include, among others, statements we make regarding expected future operating results, expectations regarding the results of restructuring and other
programs, anticipated levels of capital expenditures and expectations of the effect on our financial condition of claims, litigation, environmental costs, contingent liabilities and governmental and
regulatory investigations and proceedings. The following are important factors that we believe could cause actual results to differ materially from those in our forward looking statements: global
economic and political conditions, currency translation and devaluation effects, changes in raw material pricing and availability, competitive conditions, the success of new product offerings,
consumer preferences, the effects of animal and food-related health issues, the effects of epidemics or pandemics, including the Coronavirus Disease 2019 (COVID-19), changes in energy
costs, environmental matters, the success of our restructuring activities, the success of our financial growth, profitability, cash generation and manufacturing strategies and our cost reduction
and productivity efforts, changes in our credit ratings, the tax benefit associated with the Settlement agreement (as defined in our most recent Annual Report on Form 10-K), regulatory actions
and legal matters, and the other information referenced in the “Risk Factors” section appearing in our most recent Annual Report on Form 10-K, and as revised and updated by our Quarterly
Reports on Form 10-Q and Current Reports on Form 8-K. Any forward-looking statement made by us is based only on information currently available to us and speaks only as of the date on
which it is made. We undertake no obligation to publicly update any forward looking statement, whether written or oral, that may be made from time to time, whether as a result of new
information, future developments or otherwise.

Our management uses non-U.S. GAAP financial measures to evaluate the Company’s performance, which exclude items we consider unusual or special items. We believe the use of such
financial measures and information may be useful to investors. We believe that the use of non-U.S. GAAP measures helps investors to gain a better understanding of core operating results and
future prospects, consistent with how management measures and forecasts the Company's performance, especially when comparing such results to previous periods or forecasts. Please see
Sealed Air’s May 5, 2020 earnings press release and the appendix of this presentation for important information about the use of non-U.S. GAAP financial measures relevant to this presentation,
including applicable reconciliations to U.S. GAAP financial measures. Information reconciling forward-looking U.S. GAAP measures to non-U.S. GAAP measures is not available without
unreasonable effort. Values in this presentation are approximate due to rounding. Additionally, the individual components of bridges or the individual quarterly components presented in the
current or prior quarter earnings presentation may not sum to the full year amount due to rounding.

Website Information
We routinely post important information for investors on our website, www.sealedair.com, in the "Investors" section. We use this website as a means of disclosing material, non-public information
and for complying with our disclosure obligations under Regulation FD. Accordingly, investors should monitor the Investors section of our website, in addition to following our press releases, SEC
filings, public conference calls, presentations and webcasts. The information contained on, or that may be accessed through, our website is not incorporated by reference into, and is not a part
of, this document.
                                                                                                                                                                                        © 2020 Sealed Air | 2
2020 First Quarter Earnings - Ted Doheny, President & CEO Jim Sullivan, SVP & CFO Lori Chaitman, VP Investor Relations
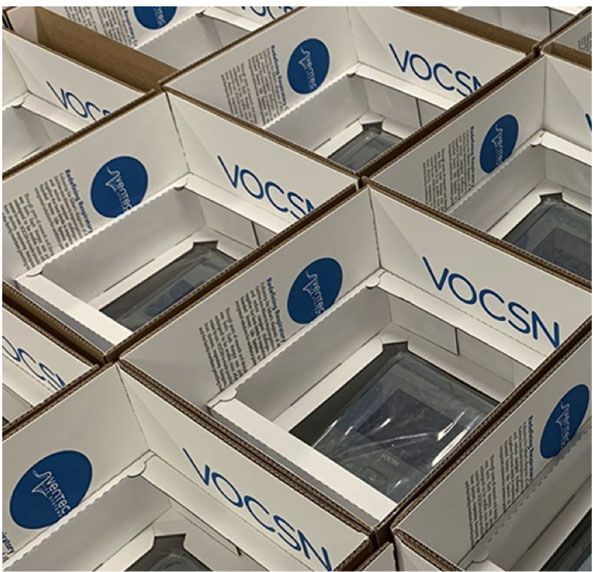
Q1 2020 Financial Results
  Higher volumes, Reinvent SEE and Automated Packaging Systems drives profitable growth

       Net Sales $1.2B; +6% as Reported, +8% constant dollar
          Food +5% constant dollar, volume +5% led by North & South America and EMEA, acquisition +1%
          Protective +13% constant dollar, acquisition +16% offset by volume decline of 2%

       Adj. EBITDA $253M; +17% as Reported, +20% constant dollar
          EBITDA growth primarily driven by Reinvent SEE, acquisition, and Food volume
          Margins expanded 220 bps to 21.6%

       Adj. EPS $0.73; +24% growth
          D&A of $52M vs $40M in Q1 2019, including $6M related to Automated Packaging Systems acquisition
          Based on 155M diluted shares outstanding and adjusted tax rate of 28%

                              Solid performance across all key metrics

                                                                                                         © 2020 Sealed Air | 3
2020 First Quarter Earnings - Ted Doheny, President & CEO Jim Sullivan, SVP & CFO Lori Chaitman, VP Investor Relations
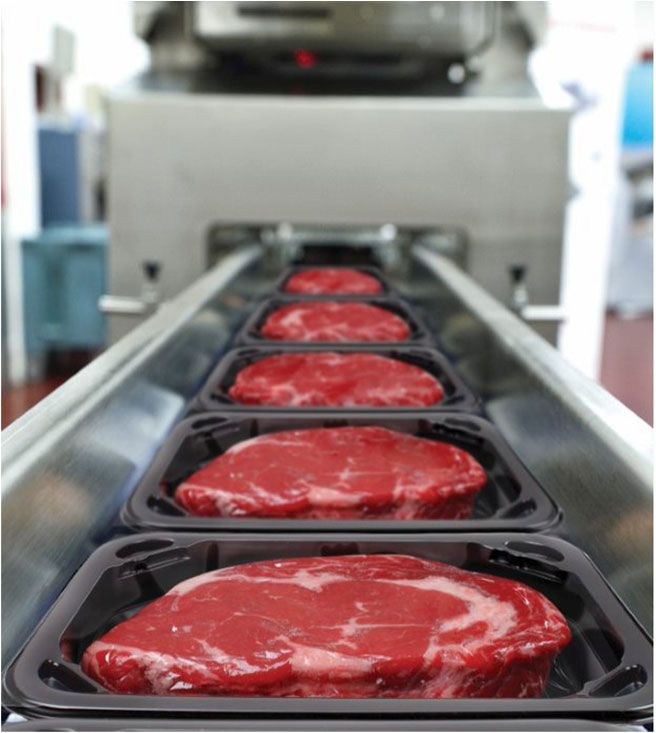
Leading through Crisis with our 4P’S of Reinvent SEE  SM                   TM

  Ensure employee safety, business continuity, and accelerate innovation

   Performance: World-class

                                                                           Operating Model
   People: One SEE High performance culture

   Products: Best products, right price, make them sustainable

   Processes: One SEE Operational Excellence

   Sustainability: Leave our world better than we found it

       We are in business to protect, to solve critical packaging challenges,
                  and to leave our world better than we found it
                                                                                             © 2020 Sealed Air | 4
2020 First Quarter Earnings - Ted Doheny, President & CEO Jim Sullivan, SVP & CFO Lori Chaitman, VP Investor Relations
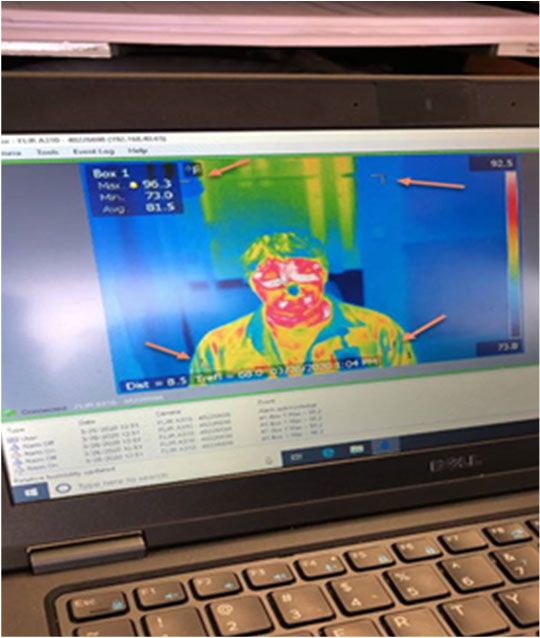
Leadership Actions through COVID-19 Pandemic
   Eliminate waste → simplify process → remove people from harm’s way → automate

   Lead through Crisis                                 Accelerate Transformation                                      Stronger post Crisis
     Keep people out of harm’s way                           Keep people out of harm’s way                               Keep people out of harm’s way
 Supporting peak customer demands                          Reinvent SEE 4P’S based playbook                           Adopt flexible work place practices
     Activated crisis management                      Innovation speed; partnerships “at the table”        Best equipment, service, materials, automation
     Global leadership collaboration                   Capital allocation strategy guides decisions          On track to achieve 2025 Sustainability Pledge

                                                             Cryovac ® brand     Bubble Wrap ® brand   Cryovac ® brand Bag-Over-Bag design          Autobag ® brand
  Thermal scanning      Sealed Air ® Korrvu ® brand
 and face protection      Retention Packaging               Darfresh ® On Tray   On-Demand Systems     Patent pending for shelf-life extension of   Bagging Systems
    at all facilities     COVID-19 ventilators                                                              seafood and fresh “red” meat

                        Leading to a “new normal”, creating a touchless, digital world
                                                                                                                                                       © 2020 Sealed Air | 5
2020 First Quarter Earnings - Ted Doheny, President & CEO Jim Sullivan, SVP & CFO Lori Chaitman, VP Investor Relations
SEE Solving Critical Packaging Challenges
       Rapid response to global pandemic with innovative, sustainable & essential packaging

     Sales by
                                                 65%                                  22%                              13%
  End Market 1                            Protein, Foods, Fluids,            Industrial, Transportation,               Consumer,
                                          Medical & Life Sciences          Electronics & Other Protective              Retail & 3PL

                             Retail packaged proteins fresh & frozen,          Consumer electronics for         eCommerce to support stay-
      Positive              produce, pantry items, meal kits & pet care       e-Learning, remote working,          at-home environment
       Impact                                                                   home theater & gaming
                                  Medical supplies, pharmaceuticals,
                                   personal protective equipment

     Negative
                                      Food service & restaurant industry   Industrial & general manufacturing       Non-essential retail
      Impact

      Q1 2020                                 Net positive                          Net negative                      Net positive

                          > 75% end markets essential or support stay-at-home environment
1 Estimated   based on 2019 results                                                                                           © 2020 Sealed Air | 6
2020 First Quarter Earnings - Ted Doheny, President & CEO Jim Sullivan, SVP & CFO Lori Chaitman, VP Investor Relations
Q1 2020 YoY Regional Sales Performance
    Growth led by Food volume, e-Commerce and Automated Packaging Systems acquisition

                                                                              Europe,
                                                                   * North   Middle East    Asia      South
                                                                   America    & Africa     Pacific   America

                    As Reported % Change                              9%         4%        -5%       -3%

              Constant Dollar % Change                              10 %         7%        -1%        24 %

                                            % of Sales              61 %       21 %        14 %        4%

                                                                   Q1 2020 Net Sales: $1.2 B
                                                            As Reported % Change: + 6 %
                                                     Constant Dollar % Change: + 8 %

* North America includes U.S. Canada, Mexico and Central America                                               © 2020 Sealed Air | 7
2020 First Quarter Earnings - Ted Doheny, President & CEO Jim Sullivan, SVP & CFO Lori Chaitman, VP Investor Relations
YoY Sales Trends

   2019                Growth (%)                    Growth (%)                      Volume (%)                     Price (%)
                        As Reported                  Constant Dollar           Excluding Acquisitions          Excluding Acquisitions
   2020
                Q1     Q2     Q3    Q4    Q1    Q1    Q2    Q3   Q4    Q1     Q1      Q2    Q3    Q4    Q1    Q1    Q2    Q3    Q4       Q1

    Food         (2) (0.3)    0.3   (2)    2     3     4     3    1     5     0.4      2     2 (0.4)     5     3     1    0.4 (0.1)    (0.2)

Protective     (0.5)     2     7    10    12     2     4     8   11    13      (4)    (3)   (5)   (4)   (2)    1     1    0.4   0.3      (1)

     SEE         (2)     1     3     3     6     3     4     5    5     8      (1)     1    (1)   (2)    2     2     1    0.4   0.1    (0.5)

      NA          2      4     4     4     9     3     4     4    3    10      (2)     2    (2)   (4)    3     1 (0.4)    (1)   (1)      (2)

   EMEA          (9)    (6)    1     2     4    (1) (0.3)    5    4     7      (1)    (1)    1    (1)    1     1    0.3   0.0 (0.4)    (0.3)

   APAC          (3)    (4)    1    0.5   (5)    3     1     3    2    (1)    0.3     (4) (0.2) (0.1)   (2)   0.1   0.1   0.1   (1)    (0.3)

       SA        (7)     2     4     9    (3)   25    30    21   31    24    (0.1)     5     3    12     7    25    25    18    18       16

     SEE         (2)     1     3     3     6     3     4     5    5     8      (1)     1    (1)   (2)    2     2     1    0.4   0.1    (0.5)

          Acceleration largely driven by surge in packaged foods for retail market and strength
            in e-Comm, partially offset by declines in food service and industrial packaging
                                                                                                                          © 2020 Sealed Air | 8
2020 First Quarter Earnings - Ted Doheny, President & CEO Jim Sullivan, SVP & CFO Lori Chaitman, VP Investor Relations
SEE Q1 Net Sales & Adj. EBITDA
       Performance driven by higher volume, Reinvent SEE, lower input costs and acquisitions
                                                                                            +6% Net Sales
                                            ($ millions)                                                      75
                                                                                                                                   1,174
                                                                                  22                                       -30
                                                                  1,113
                                                                                                -5
                                                                                           Constant Dollar +8.2%
                                                                                              Organic +1.5%
                                                                 Q1 2019         Volume        Price          Acq.         FX      Q1 2020
                                                                                                                       Translation

                                                                                          +17% Adj. EBITDA
                                                                                                                                      21.6% Margin
                                                                                                                      15
                                                                                                                                           253
                                                                                                        13
                                                         19.4% Margin                      7                                     -7
                                                                             9
                                                             216

                                                                                           Constant Dollar +20%

                                                           Q1 2019       Volume          P/C           Acq.           Oper.      FX      Q1 2020
                                                                                       Spread *                      Costs * Translation

* Q1 Reinvent SEE benefits $30 M: $5 M P/C Spread; $25 M Operating Costs, including $14 M Restructuring Savings                                      © 2020 Sealed Air | 9
2020 First Quarter Earnings - Ted Doheny, President & CEO Jim Sullivan, SVP & CFO Lori Chaitman, VP Investor Relations
Reinvent SEE Creating Structural Change
   New growth workstream to accelerate innovation and penetrate adjacent markets

                                                                                                            Reinvent SEE Benefits
                      ’18 & ‘19   Q1 ‘20                                                                       (Adj. EBITDA, $ M)
                                                                                                                                       ~ 330
                                                                                              350
                                                                                              345
                                                                                              340
                                                                                              335
                                                                                              330
                                                                                              325
                                                                                              320
                                                                                              315
                                                                                              310
                                                                                              305
            Total                                                                             300
                                                                                              295
                                                                                              290
                      $172 M      $30 M Reinventing how we innovate to                   solve285
                                                                                              280
                                                                                              275
                                                                                              270
                                                                                              265
                                                                                              260
                                                                                              255
                                                                                              250
                                                                                              245
                                                                                              240
     YoY Benefits                                                                             235
                                                                                              230
                                                                                              225
                                                                                              220
                                                                                              215
                                                                                              210
                                                                                              205
                                                                                              200               168
                                                                                              195
                                                                                              190
                                                                                              185
                                                                                              180
                                                                                              175
                                                                                              170
                                                                                              165
                                                                                              160
                                                                                              155
                                                                                              150                     ~ 110
                                                                                              145
                                                                                              140
                                                                                              135
                                                                                              130
                                                                                              125
                                                                                              120
                                                                                              115
                                                                                              110
                                                                                              105
                                                                                              100
                                           Logistics rate improvements                         95
                                                                                               90
                                                                                               85
                                                                                               80
                                                                                               75                              ~ 50
                                                                                               70
                                                                                               65
                                                                                               60
                                                                                               55
                                                                                               50       4
Price / Cost Spread                                                                            45
                                                                                               40
                                                                                               35
                                                                                               30
                                                                                               25
                       $37 M      $5 M     Strategic value capture                             20
                                                                                               15
                                                                                               10
                                                                                                5
                                                                                                0
       YoY Benefits                        Non-market price movements                                   '18     '19     '20E    '21E     Total
                                           Procurement savings
                                                                                                       Reinvent SEE Cash Payments
                                                                                                                       ($ M)
 Total Oper. Costs                                                                                                                     ~ 215
     YoY Benefits
                      $135 M      $25 M    SG&A efficiency and savings on indirect spend 225     220
                                                                                                 215
                                                                                                 210
                                                                                                 205
                                                                                                 200
                                                                                                 195
                                                                                                 190
                                           Manufacturing network efficiencies                    185
                                                                                                 180
                                                                                                 175
                                                                                                 170
    Operating Costs                                                                              165
                                                                                                 160
                                                                                                 155
                                                                                                 150
                       $64 M      $11 M    Yield improvements and gauge optimization             145
                                                                                                 140
                                                                                                 135
                                                                                                 130
      YoY Benefits                                                                               125
                                                                                                 120            91    ~ 100
                                                                                                 115
                                                                                                 110
                                                                                                 105
                                                                                                 100
                                                                                                  95
                                                                                                  90
                                           Material substitution & alt. raw material qualifications
                                                                                                  85
                                                                                                  80
                                                                                                  75
                                                                                                  70
                                                                                                  65
                                                                                                  60
      Restructuring                                                                               55
                                                                                                  50                           ~ 25
      YoY Savings
                       $71 M      $14 M    Delayering & simplifying organization                  45
                                                                                                  40
                                                                                                  35
                                                                                                  30
                                                                                                  25
                                                                                                  20
                                                                                                 15     0
                                                                                                 10
                                                                                                  5
                                                                                                  0
                                                                                                       '18      '19    '20E     '21E    Total

      SEE Operational Excellence engine driving profitable growth above inflation
                                                                                                                               © 2020 Sealed Air | 10
Food Care Q1 Net Sales & Adj. EBITDA
      Higher volume, Reinvent SEE & favorable price cost spread, partially offset by FX translation

                                                                                            +2% Net Sales
                                            ($ millions)
                                                                                  31                             6

                                                                                                -2                                  690
                                                                    680
                                                                                                                           -25
                                                                                           Constant Dollar +5.2%
                                                                                              Organic +4.4%

                                                                  Q1 2019       Volume         Price          Acq.         FX      Q1 2020
                                                                                                                       Translation

                                                                                           +9% Adj. EBITDA

                                                                                           4             0             2                22.6% Margin
                                                                           12                                                                156
                                                        21.0% Margin                                                              -5
                                                            143

                                                                                           Constant Dollar +13%

                                                          Q1 2019        Volume         P/C            Acq.           Oper.        FX      Q1 2020
                                                                                      Spread *                       Costs *   Translation

* Q1 Reinvent SEE benefits $20 M: $4 M P/C Spread; $16 M Operating Costs, including $9 M Restructuring Savings                                         © 2020 Sealed Air | 11
Product Care Q1 Net Sales & Adj. EBITDA
      APS acquisition, Reinvent SEE & lower input costs, partially offset by lower volume

                                                                                            +12% Net Sales
                                            ($ millions)
                                                                                                                69                     484
                                                                                                                             -5
                                                                      433
                                                                                   -10            -4
                                                                                          Constant Dollar +12.9%
                                                                                              Organic -3.1%
                                                                   Q1 2019       Volume         Price           Acq.         FX      Q1 2020
                                                                                                                         Translation

                                                                                          +24% Adj. EBITDA
                                                                                                                                           19.2% Margin
                                                                                                                         6                     93
                                                                                                        13
                                                       17.3% Margin                                                                  -1
                                                            75                            3
                                                                           -3
                                                                                           Constant Dollar +25%

                                                         Q1 2019        Volume          P/C             Acq.            Oper.         FX      Q1 2020
                                                                                      Spread *                         Costs *    Translation

* Q1 Reinvent SEE benefits $10 M: $1 M P/C Spread; $9 M Operating Costs, including $5 M Restructuring Savings                                             © 2020 Sealed Air | 12
Free Cash Flow
    Higher Adj. EBITDA offset by seasonal trade working capital increase & higher incentive comp. payments

                                             ($ millions)                        Three Months Ended March 31,
                                                                                       2020       2019
                                    Adjusted EBITDA                                    253         216
                                    Interest payments, net of interest income          (47)        (40)
                                    Income tax payments                                (16)        (13)
                                    Reinvent SEE, restructuring & assoc. payments      (26)        (25)
                                    Change in trade working capital, net *             (61)        (31)
                                    Change in other assets/liabilities                 (62)        (42)
                                 Cash flow provided by operating activities              41         65
                                    Capital expenditures                                (49)       (49)
                                 Free Cash Flow                                         (8)         16

          Reducing 2020 capex from $200 M to $175 M, protecting growth investments

* Includes cash (used) from trade receivables, inventory, accounts payable net                                  © 2020 Sealed Air | 13
Healthy Balance Sheet Position
       Well positioned to support business in COVID-19 environment

         Q1 2020 Proforma Net Debt / LTM Adj. EBITDA 1 3.5x (Q4 2019: 3.6x)
              Priority is to continue to de-lever the balance sheet
                                                                                                                                   Debt Maturity ($M)
         $1.24B of liquidity available, including:                                                                                 As of March 31, 2020

              Cash $275M, undrawn, committed credit facilities $968M
                    Maximum leverage covenant in credit facility 5.0x due to
                    APS acquisition, returns to 4.5x Q4 2020
              Q1 2020 covenant leverage ~ 3.2x

         No debt maturities until August 2022
              Weighted average cost of debt 4.7%

                                Strong liquidity and maturity profile provide financial flexibility;
                                             maintaining dividend at current level
1   Proforma Net Debt / LTM Adj EBITDA Ratio includes 12-months ended March 31, 2020 Adj. EBITDA for Automated Packaging Systems                 © 2020 Sealed Air | 14
© 2019 Sealed Air | 15
Appendix

           © 2020 Sealed Air | 16
U.S. GAAP Summary & Reconciliations
                                                                                    Three Months Ended Mar. 31,
                                                                                        2020            2019
           Net Sales                                                                 $1.2 billion       $1.1 billion
           Pre-tax Earnings from Continuing Operations                            $147.2 million      $94.7 million
           Net Earnings From Continuing Operations                                $114.5 million      $64.3 million
           EPS From Continuing Operations                                                 $0.74              $0.41
           Effective Tax Rate                                                            22.2%              32.1%
           Operating Cash Flow                                                     $41.0 million      $65.1 million

                                                                                      Three Months Ended Mar. 31,
          ($ millions)
                                                                                          2020             2019
          U.S. GAAP Net earnings from continuing operations                             114.5              64.3
          Interest expense, net                                                          44.4              44.9
          Income tax provision                                                           32.7              30.4
          Depreciation and amortization, net of adjustments                              51.5              40.2
            Special items
            Restructuring charges                                                         0.6               7.4
            Other restructuring associated costs                                          4.0              16.7
            Foreign currency exchange loss due to highly inflationary economies           0.9               0.8
            Charges related to acquisition and divestiture activity                       2.9               3.7
            Other Special Items                                                           1.7               7.4
          Pre-tax impact of Special Items                                                10.1              36.0
          Non-U.S. GAAP Total Company Adj EBITDA from continuing operations             253.2             215.8

                                                                                                                       © 2020 Sealed Air | 17
U.S. GAAP Summary & Reconciliations

                                                                       Three Months Ended Mar. 31,
                                                                      2020                             2019
                                                             Net             Diluted         Net              Diluted
              ($ millions, except per share data)
                                                           Earnings           EPS          Earnings            EPS
              U.S. GAAP net earnings and diluted
                                                          $ 114.5            $ 0.74        $ 64.3             $ 0.41
              EPS from continuing operations

              Special Items                                  (1.1)           (0.01)          27.9              0.18
              Non-U.S. GAAP Adjusted net earnings
              and adjusted diluted EPS from               $ 113.4            $ 0.73        $ 92.2             $ 0.59
              continuing operations
              Weighted average number of common
                                                                             154.8                            155.4
              shares outstanding - Diluted

                                                                                       Mar. 31, 2020
                                         ($ millions)
                                                                                        (unaudited)

                                         Total debt                                    $ 3,874.4
                                         Less: cash and cash equivalents                  (274.6)
                                         Net Debt                                      $ 3,599.8

                                                                                                                        © 2020 Sealed Air | 18
ROIC Calculation

                                      Q1 2020 Trailing Twelve Months
                                                      Adjusted EBITDA (Non-GAAP)       $ 1,002 M
                                                 Less: Depreciation and Amortization     (196 M)
                                                           Adjusted Operating Profit      806 M
                                                     Adjusted Tax Rate (Non-GAAP)          26%
                                                    Tax on Adjusted Operating Profit     (210 M)
                                           Net Adjusted Operating Profit After Tax       $ 597M
                                      One-year average (Q1 ‘20 and Q1 ‘19)
                                                                Book value of Equity   $ (237 M)
                                                        Current and Long-Term Debt      3,721 M
                                                         Other Long-Term Liabilities      710 M

                                                       Less: Non-Operating Assets *      (257 M)

                                                                       Total Capital   $ 3,936 M
                                                        Return on Invested Capital         15%

* Primarily represents cash balance                                                                © 2020 Sealed Air | 19
You can also read