Thermal comfort analysis in the sustainable educational building - E3S Web of Conferences
←
→
Page content transcription
If your browser does not render page correctly, please read the page content below
E3S Web of Conferences 280, 04011 (2021)                                                               https://doi.org/10.1051/e3sconf/202128004011
ICSF 2021

         Thermal comfort analysis in the sustainable educational building
         Luiza Dębska1,*, and Justyna Krakowiak1
         1KielceUniversity of Technology, Faculty of Environmental Geomatic and Energy Engineering, 7 aleja Tysiąclecia Państwa Polskiego,
         25-314 Kielce, Poland

                        Abstract: In the modern world, a person spends most of his life indoors. That is why it is so important to
                        create optimal conditions for the internal environment. Research on thermal comfort and subjective feeling
                        of people inside the building can help in this. The article discusses two methods that are used in research on
                        thermal sensations. This makes it possible to know the thermal assessment of people and then compare this
                        result with the calculated PMV value, which is calculated using the formula from ISO 7730 standard.

                                                                              during classes were better adapted to it than children who
       1 Introduction                                                         did not have such an opportunity. Zaki et al [10] analyzed
                                                                              three universities – two in Malaysia and one in Japan, over
       Today, energy consumption is one of the main problems                  the summer. 1428 surveys were thoroughly analyzed,
       of the modern world. A solution to this problem is sought              which showed that in Japan the best temperature was
       in energy-efficient construction, which uses various types             25.1oC, while in Malaysia it was 25.6oC. In Indonesia,
       of renewable energy sources, such as solar collectors,                 Hamzah et al. [11] perished Hasanuddin University in
       photovoltaic cells, heat pumps, wind turbines, biofuels or             Gowa. The thermal sensations during the research were
       hybrid solutions. Moreover, such buildings belong to                   described by 118 people, from whom it appears that these
       sustainable construction, whose main goal, apart from the              guards felt comfortable in selected rooms. Liu et al.[12]
       use of devices for the production of renewable energy, is              analyzed naturally ventilated rooms in northwest China,
       to reduce waste and pollution generated during the                     in the city of Xi'an, to see how the students living in these
       construction of ecological buildings in such a way as to               rooms feel thermal. A total of 992 questionnaires were
       minimize interference with the environment. Another                    completed, which showed that the most natural
       advantage is definitely the cost of maintaining such a                 temperature was 20.6oC, and the range in which the
       building, because the building works on itself, it is self-            students determined their thermal comfort was the
       sufficient. In addition, the idea of sustainable construction          temperature from 19.5oC to 21.8oC, and the preferred
       is to reduce the consumption of water, electricity, heat               temperature was 22.7oC. In Brazil, at the University of
       losses, create appropriate conditions for the internal                 Goias, Abreu-Harbich et al. [13] investigated classrooms
       environment, including air exchange with the help of                   with three air conditioning methods such as natural
       well-selected ventilation, use containers for waste                    ventilation, evaporative cooling, and air conditioning. The
       segregation and create optimal conditions and thermal                  authors wanted to get to know the students' thermal
       comfort for people who spend most of their lives indoors               feelings, because the discomfort in the classrooms might
       [1-6]. At this point, a lot of research into thermal comfort           have compromised their knowledge. 200 people were lost.
       is carried out. An example of such research is a study by              69.52% of people definitely did not correspond to the
       Hwang et al. [7] who analyzed 944 people at universities               creature conditions by natural ventilation. Less, because
       in Taiwan. The respondents definitely determined that the              only 60.67% were dissatisfied with evaporative cooling
       best temperatures in which they feel are in the range of               and 70.18% of the respondents did not accept the
       21.1oC to 29.8oC and 24.2oC to 29.8oC. In Australia, Dear              conditions of the internal environment created by air
       and others have attempted to forfeit both primary and                  conditioning. Moreover, the neutral temperature was set
       secondary school students. During the research, 2,850                  at 25.9oC. Buonocore et al. [14] at the University of Sao
       questionnaires were received. After analyzing the                      Luis, Brazil, analyzed the subjects' thermal preferences
       questionnaires, the results were obtained in which the                 and the feeling of thermal comfort. The rooms covered by
       respondents defined their thermal sensations in the range              the study were air-conditioned and ventilated in a natural
       of 19 -26. Later, these studies were extended to include               way. The authors of these studies wanted to know the
       more results. Kim and Dear [8-9] have further decided to               appropriate climatic conditions in the internal
       forfeit the school environment. From the obtained results,             environment of the room. Therefore, the city of Sao Luis
       the authors found out that students prefer cooler                      was chosen for its location in an equatorial climate where
       temperatures, and more of the received questionnaires,                 it is hot and humid. The problem of local students is
       students who had the option of using air conditioning                  overcooling associated with the excessive use of air

         *
             Corresponding author: ldebska@tu.kielce.pl

  © The Authors, published by EDP Sciences. This is an open access article distributed under the terms of the Creative Commons Attribution License 4.0
  (http://creativecommons.org/licenses/by/4.0/).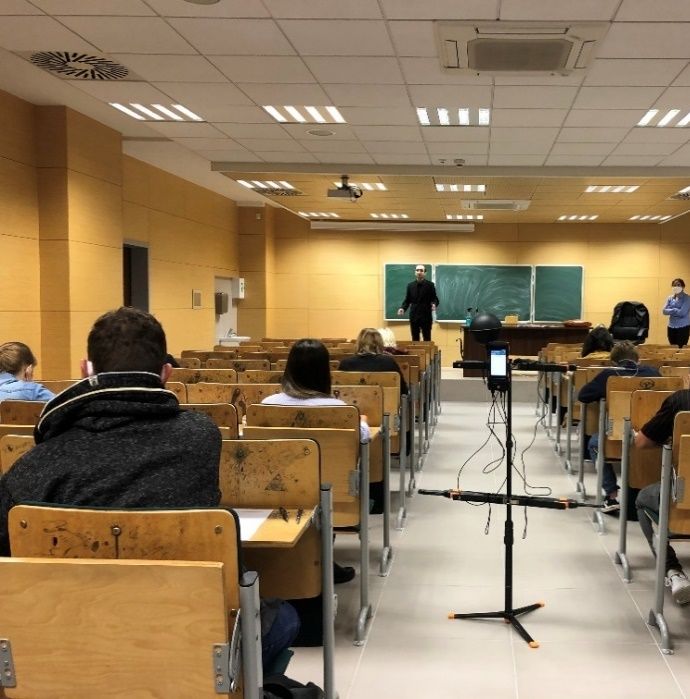
E3S Web of Conferences 280, 04011 (2021) https://doi.org/10.1051/e3sconf/202128004011
ICSF 2021
conditioning in the classrooms. From the questionnaires of students of Kielce University of Technology was
completed by students it was concluded that the best conducted.
conditions meeting the preferences of the respondents
were the temperature range from 23oC-24oC. It was in this
respect that the students felt thermal comfort. Moreover,
they tended to increase the temperature to 26oC. About
20% of respondents felt discomfort if the temperature was
lower than 22, with a clo of 0.3. Guevara et. Al. [15] have
taken an analysis of three cities in Ecuador – Quito,
Guayaquil, and Tena. From December 2017 to January
2018, the authors of the study received 429 questionnaires
completed by volunteers. The aim of this research was to
obtain information about the thermal comfort of people
living in the tropics, where the weather is very
changeable. Neutral temperatures in which the
respondents felt best were in turn 21.8oC, 26.3oC or
26.9oC. The respondents from Guayaquil and Tena were
directed to cool temperatures because of the hot and Fig. 1. Photo of “Energis” building and selected room where the
humid climate in their areas of residence. In Bangladesh, test was performed.
a study was performed in the summer of 2017 by Talukdar
and others [16]. They focused on learning about the
thermal preferences of students in naturally ventilated 2 Testing methods
rooms. 579 sheets with respondents' answers were Thermal comfort measurements are divided into two
received. The parameters maintained during the test were methods, indirect and direct. The indirect method is based
equal to the temperature – 30.9oC, humidity – 78.4% and on the analysis of completed questionnaires by people in
the wind speed – 0.8 m/s. After the analysis, it was found the room covered by the study and direct method aimed at
that the best neutral temperature for the feeling of thermal obtaining microclimate parameters using a meter (air
comfort is 27.8oC. Abdallah [17] conducted research at temperature, globe temperature probe, air velocity,
the Assiut University. The study covered 6 naturally relative humidity, light intensity). These data, in particular
ventilated classrooms. Initially, 331 people participated in temperature, air velocity and humidity are needed to
the study, but after an in-depth analysis, only 269 calculate the PMV (Predicted Mean Vote) from the
questionnaires remained. It was concluded from the formula contained in the ISO 7730 standard [22, 23].
responses that the temperature exceeded 28oC, which was The questionnaire included questions about thermal
met with discomfort by students in 90%. At the Bahia sensations, adequacy of temperature, sensations of
Federal University in Salvador, Brazil, Costa and others humidity, current clothing and physical activity, as
[18] analyzed the students' thermal sensations. Only 53% assessed by study volunteers. A very important fact when
of the respondents felt thermal comfort. The conclusion of assessing the thermal sensations of test volunteers is to
these studies was the incorrect maintenance of the check what physical activity they had before the test.
condition of windows and window frames, which People who did not perform any physical activity, i.e. sat
prevented the correct flow of air between the external and before the test, or walked for no more than 10 minutes, are
internal environment. In Thailand, the University tested 3 a reliable source of information about their thermal
speeds of the air conditioner – low, medium and high, then sensations. If, on the other hand, such people did strength
the students completed the questionnaires. Puangmalee et training a moment before the measurement, unfortunately
al [19] analyzed the results of the surveys which such people may distort the picture of knowing their
concluded that students would be able to accept a thermal preferences. Thus, polls must be rejected.
temperature of 28 as long as the air conditioner speed Additionally, the actual thermal sensation is also
could be regulated. Additionally, the information was influenced by clothing, otherwise known as the clothing
obtained that the higher the speed, the higher the neutral thermal isolation (clo), which for this group was 0,62.
temperature. Note that if the subject is dressed too warm, he may feel
An educational and laboratory building of discomfort in the form of heat. Similarly, she will feel bad
Environmental Engineering, Kielce University of wearing summer clothes, and the room will be too cold.
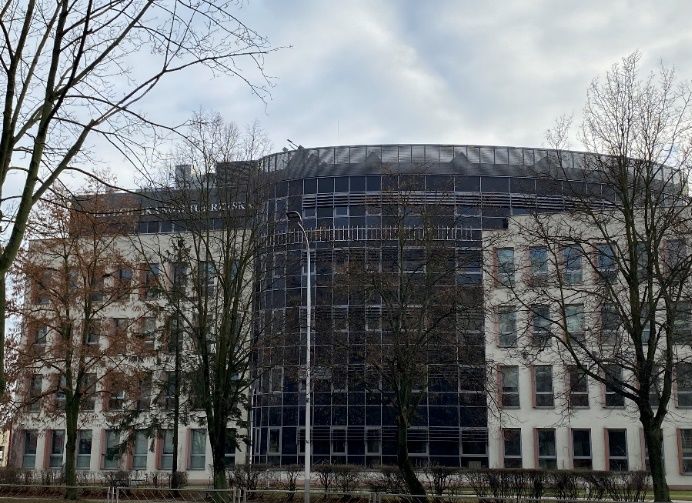
Technology, called „Energis” from the year 2012, is such To measure the internal environment, a Testo 400 meter
an energy-saving and intelligent building. “Energis” has was used located in the middle of the lecture hall. After
been designed with sustainable construction in mind. The 15 minutes, when the values had stabilized, they were
main and set goal was to monitor the effects of energy collected and recorded. Meanwhile, the volunteers
saving, the balance of energy gains and losses, completed the questionnaires. The purpose of using two
maintaining appropriate parameters of the internal these methods is to check whether the conditions in the
environment while using the most modern automation and room create thermal comfort for the occupants. Figure 2
control solutions for devices such as photovoltaic cells, and figure 3 below show the meter with a description of
solar panels, heat pumps, energy storage [20, 21]. Figure the probes collecting the necessary parameters (globe
1 presents a photo of the “Energis” building and shows
the selected room where the research on thermal comfort
2E3S Web of Conferences 280, 04011 (2021) https://doi.org/10.1051/e3sconf/202128004011
ICSF 2021
temperature probe, light intensity probe, turbulence Table 1. Parameters of the internal environment obtained with
probe, CO2 probe, temperature and humidity probe). the use of the meter.
Air temperature [oC] 25.7
Black ball temperature [oC] 25.2
Relative humidity [%] 56,6
Air Velocity [m/s] 0.43
In the study involved 9 people in the age range from
21-24 years. Figure 4 below shows the thermal feelings of
the respondents as TSV (thermal sensation votes).
50
Frequency [%]
40
30
20
10
Fig. 2. Location of the measuring station in the lecture hall and
0
probes measuring the conditions in the room. -3 -2 -1 0 1 2 3
TSV
Fig. 4. Voices of the respondents concerning the thermal
sensation: -3 – too cold, -2 – too cool, -1 – pleasantly cool, 0 –
comfortable, 1 – pleasantly warm, 2 – too warm, 3 – too hot.
50% of respondents consider that the room in
pleasantly cool. The other half, i.e. 50% of people
described their thermal sensations as comfortable. Figure
5 below shows the group’s responses to the feeling of
accepting the current temperature in the tested room
(TAV – thermal acceptability vote).
Frequency [%]
60
50
40
30
20
10
0
Fig. 3. The meter of Testo 400. -2 -1 0 1 2
TAV
3 Test result Fig. 5. Acceptance of temperature according to the volunteers:
-2 – definitely unpleasant, -1 – unpleasant, 1 – acceptable, 2 –
In the selected room where examination was performed, comfortable.
there is mechanical ventilation with adjustable
parameters, which was activated during the examination. 37.5% of people in the study group consider that the
Table 1 shows the obtained results of the conditions in the temperature is still acceptable, while 62.5% of people
tested room with the use of a meter Testo 400. described their feelings of temperature as comfortable.
Figure 6 shows the responses of individual thermal
3E3S Web of Conferences 280, 04011 (2021) https://doi.org/10.1051/e3sconf/202128004011
ICSF 2021
preferences (TPV – thermal preference vote) in relation to accepted view and might have a slight impact on the
change in air temperature. obtained experimental results.
80
Frequency [%]
100
Frequency [%]
70
80 60
50
60
40
40 30
20
20
10
0 0
-2 -1 0 1 2 -1 0 1
TPV HPV
Fig. 6. Thermal preferences vote: -2 – definitely cooler, -1 – Fig. 8. Frequency of answers humidity preferences vote: -1 –
cooler, 0 – no change, 1 – warmer, 2-definitely warmer. more dry, 0 – no change, 1 – more humid.
100% of people would not want to change the
3
temperature to a cooler or warmer temperature. This
PMV
data points
proves that the prevailing temperature in the room was so linear fit
favorable that the whole group of eight felt thermal 2
comfort. Figure 7 below shows the assessment of
humidity by the tested group. 1
0
Frequency [%]
50
-1
40
-2
30
-3
0 5 10 15 20 25 30 35
20 BMI
10 Fig. 9. The relationship between the PMV index and the BMI
mass index.
0
-2 -1 0 1 2
AHV 4 Conclusions
To sum up, from the obtained results, it can be concluded
Fig. 7. Assessment of humidity according to the
respondents: -2 – too dry, -1 – quite dry, 0 – pleasantly, 1 – that the room meets the expectations of its occupants in
quite humid, 2 – too humid the modern “Energis” intelligent building. Thus, such a
construction that meets the criteria for the sustainable
50% of people rated the humidity as pleasant. The building is a user – friendly educational building. The
other half of the group, i.e. 50% of respondents, think that temperature there was perceived as comfortable and
the room is quite dry. The graph of the humidity pleasant, therefore none of the respondents would like to
preference responses by the volunteers is shown on figure change the prevailing temperature to a warmer or cooler
8. one. Likewise for the humidity where it was found to be
In the studied group, 75% of people would not like to pleasant and fairly dry. 75% of the group would not want
a change in air humidity, as opposed to 25% of people the humidity settings changed except for the 25% which
who would definitely like it to be more humid. Figure 9 specified it could be more humid. The conclusion is
shows the relationship between the PMV index and the obvious that the ventilation in this room has well-chosen
BMI mass index in order to determine if this parameter parameters that ensure well-being in the external
had any impact on the obtained results. environment.
According to the figure the higher the BMI index of a In the future, research on thermal comfort will be
person, the warmer they feel. It confirms a generally carried out in order to better understand the individual
thermal preferences of people indoors.
4E3S Web of Conferences 280, 04011 (2021) https://doi.org/10.1051/e3sconf/202128004011
ICSF 2021
References climate. Building and Environment 135, 257-268
(2018). doi:10.1016/j.buildenv.2018.03.017
1. L. Zitzman, Sustainable Construction: Methods and 14. C. Buonocore, R. De Vecchi, V. Scalco, R. Lamberts,
Benefits. Thermal preference and comfort assessment in air-
https://www.bigrentz.com/blog/sustainable- conditioned and naturally-ventilated university
construction (2020). Accessed 21 Mar 2021 classrooms under hot and humid conditions in Brazil.
2. Co to jest zrównoważone budownictwo? https://jw- Energy and Buildings 211 (2020)
a.pl/2019/06/co-to-jest-zrownowazone- 15. G. Guevara, G. Soriano, I. Mino-Rodriguez, Thermal
budownictwo/ (2019). Accessed 21 Mar 2021 comfort in university classrooms: An experimental
3. Budownictwo zrównoważone. study in the tropics. Building and Environment 187
https://architektura.info/architektura_zrownowazona (2021). doi:10.1016/j.buildenv.2020.107430
/zielone_innowacje2/budownictwo_zrownowazone 16. S.J. Talkudar, T.H. Talukdar, M.K. Singh, A. Baten,
(2013). Accessed 21 Mar 2021 S. Hossen, Status of thermal comfort in naturally
4. G. Majewski, Ł.J. Orman, M. Telejko, N. Radek, J. ventilated University classrooms of Bangladesh in
Pietraszek, A. Dudek, Assessment of thermal comfort hot and humid summer season. Journal of Building
in the intelligent buildings in view of providing high Engineering 32 (2020).
quality indoor environment. Energies 13(8), 1973 doi:10.1016/j.jobe.2020.101700
(2020). doi:10.3390/en13081973. 17. A. S. H. Abdallah, Analysis of Thermal Comfort and
5. Zimny J.; Odnawialne źródła energii w Energy Consumption in Long Time Large
budownictwie niskoenergetycznym. Wyd. Educational Halls (Studios), Assiut University,
Wydawnictwo Nukowo-Techniczne, Warszawa Egypt. Procedia Engineering 121, 1674-1681 (2015).
2010. ISBN 978-83-7490-378-3 doi:10.1016/j.proeng.2015.09.115
6. How can renewable energy be used in the built 18. M.L. Costa, M.R. Freire, A. Kiperstok, Strategies for
environment? https://arena.gov.au/renewable- thermal comfort in University buildings – The case of
energy/renewables-in-buildings/ (2020). Accessed the faculty of architecture at the Federal University of
21 Mar 2021 Bahia, Brazil. Journal of Environmental Management
7. R.-L. Hwang, T.-P. Lin, N.-J. Kuo, Field experiments 239, 114-123 (2019).
on thermal comfort in campus classrooms in Taiwan. doi:10.1016/j.jenvman.2019.03.004
Energy and Buildings 38, 53-62 (2006). 19. N. Puangmalee, K. Hussaro, V. Boonyayothin, J.
doi:10.1016/j.enbuild.2005.05.001 Khedari, A field of the Thermal Comfort in
8. R. de Dear, J. Kim, C. Candido, M. Deuble, Adaptive University Buildings in Thailand under Air
thermal comfort in Australian school classrooms. Condition Room. Energy Procedia 79, 480-485
Building Research & Information 43, 383-398 (2015). doi:10.1016/j.egypro.2015.11.522
(2015). doi:10.1080/09613218.2015.991627 20. Energis – Educational and Laboratory building of
9. J. Kim, R. de Dear, Thermal comfort expectations Environmntal engineering, Kielce, University of
and adaptive behavioural characteristics of primary Technology.
and secondary school students. Building and http://energis.tu.kielce.pl/index.php/krotki_opis_proj
Environment 127, 13-22 (2018). ektu
doi:10.1016/j.buildenv.2017.10.031 21. Energis – to inteligentny, energooszczędny, zasilany
10. S.A. Zaki, S.A. Damiati, H.B. Rijal, A. Hagishima, z odnawialnych źródeł energii nowy budynek
A.A. Razak, Adaptive thermal comfort in university Politechniki Świętokrzyskiej.
classrooms in Malaysia and Japan. Building and https://www.ncbr.gov.pl/ocentrum/aktualnosci/szcze
Environment 122, 294-306 (2017). goly-aktualnosci/news/energis-to-inteligentny-
doi:10.1016/j.buildenv.2017.06.016 energooszczedny-zasilany-z-odnawialnych-zrodel-
energii-nowy-budynek-poli/
11. B. Hamzah, M.T. Ishak, S. Beddu, M.Y. Osman,
Thermal comfort analyses of naturally ventilated 22. P.O. Fanger, Komfort cieplny (Arkady, Warszawa,
university classrooms. Structural Survey 34, 427-445 1974)
(2016). doi:10.1108/SS-12-2015-0055 23. ISO International Organisation for Standardization,
12. J. Liu, X. Yang, Q. Jiang, Y. Liu, Occupants’ thermal Ergonomics of the thermal environment – Analytical
comfort and perceived air quality in natural ventilated determination and interpretation of thermal comfort
classrooms during cold days. Building and using calculation of the PMV and PPD indices and
Environment 158, 73-82 (2019). local thermal comfort criteria, International Standard
doi:10.1016/j.buildenv.2019.05.011 ISO 7730, 2005.
13. L.V. de Abreu-Harbich, V.L.A. Chaves, M.C.G.O.
Brandstetter, Evaluation of strategies that improve
the thermal comfort and energy saving of a
classrooms of an institutional building in a tropical
5You can also read