Technical Advisory Cell Summary of advice - 29 January 2021 - GOV.WALES
←
→
Page content transcription
If your browser does not render page correctly, please read the page content below
Technical Advisory Cell

Summary of advice
29 January 2021

 © Crown copyright 2020

TAC ADVICE ONLY NOT WELSH GOVERNMENT POLICY
Technical Advisory Cell: Summary Brief
29 January 2021
Top-line summary
The most recent estimate of the Reproduction number (Rt) for Wales from
SAGE (approved by SAGE on 28 January) is between 0.7 and 0.9. This is the
official estimate of the Rt number for Wales based on data available up until 25
January. SAGE estimates that the epidemic is shrinking by between -6% and -
1% per day.
Based on case numbers only, Public Health Wales estimates Rt to be between
0.71 and 0.74 (as of 22 January) and halving time to be 17.6 days (as at 26
January).
For the 7 day period ending 28 January, test positivity (rolling 7 days) was
11.2%, which has decreased since last week, but remains high and is above
the red circuit breaker in all areas of Wales. Positivity is highest in the North
Wales areas of Wrexham (21.8%) and Flintshire (16.5%).
Data from the ONS infection study indicates that the positivity rate in Wales has
levelled off in the most recent week, however estimates still suggest that 1 in
70 people in Wales had the virus in the week ending 23 January. Following a
recent increase, positive cases that are compatible with the new variant
VOC202012/01 have levelled off and cases that are clearly not compatible with
the new variant have decreased. Cases where quantities of the virus were too
low for the variant to be identifiable have increased; these may represent cases
where the Ct (cycle threshold1) value is high and individuals have had the virus
for a longer period of time.
ONS study data is helpful because it provides an indication of asymptomatic
cases and is not affected by other factors such as people coming forward for
testing or testing capacity, however it is important to stress the uncertainty
around the estimates. Since the survey picks up relatively few positive tests
overall, the results can be sensitive to small changes in the number of these
positive tests. The sequencing data from Public Health Wales for positive cases
may be more robust and less subject to a time lag, even though it generally
only includes people who have chosen to be tested.
1
A high Ct value indicates a low concentration of genetic material and a low Ct value indicates a high
concentration of viral genetic material
Page 2 of 21
TAC ADVICE ONLY NOT WELSH GOVERNMENT POLICY
As at 28 January VOC 202012/01 (VOC1, identified in Kent) continues to
increase in all parts of Wales with between 45 and 88% of recent cases being
VOC1 (identified by the proxy indicator SGTF).
As of 1 February, there are 13 genomically confirmed or probable cases of VOC
202012/01 (the variant linked to South Africa) in Wales. No cases of the variants
linked to Brazil have yet been identified.
As at 28 January, the proportion of calls to NHS 111 and NHS Direct related to
possible COVID-19 symptoms is stable, overall GP consultations for any Acute
Respiratory Infection (ARI) and suspected COVID-19, and the number of
ambulance calls possibly related to COVID-19 have decreased in the most
recent week.
As of 29 January, the number of people with confirmed COVID-19 in hospital
has shown a plateau and a reduction over recent weeks, but remains high and
above the April peak. Both overall critical care occupancy (COVID-19 and non-
COVID-19 patients) and occupancy for COVID-19 patients only remains high
and close to the April peak. The number of people recovering from COVID-19
is high, at over 1,100 in the most recent week.
The weekly number of deaths reported through rapid mortality surveillance by
Public Health Wales has decreased in the most recent week, but remains high
at around 200 per week. Data on deaths from the Office for National statistics,
which is more complete but subject to a time lag, shows that for the week ending
22 January, the number of registered deaths involving COVID-19 decreased
from 467 (Week 2) to 447 (Week 3), the third highest recorded at any point
during the pandemic. According to data available up until 15 January, deaths in
care homes are high and have continued to increase. The average number of
COVID-19 deaths is now generally between 10 and 15 each day, which is
higher than the increase observed in November 2020.
As at 1 February, a total of 439, 640 first doses of COVID-19 vaccine have been
given in Wales. 1,066 people have received two doses. The actual number of
doses will be higher due to ongoing data entry.
Both the mobility and adherence information show no change since the last
update. Self-reported adherence and understanding of the rules continues to
be high whilst the mobility data is very similar to last week.
Papers from SAGE considered by the Technical Advisory Cell are published
here. Recent papers published by TAG are available here:
o Examining the use of behavioural science to inform policy and practice
o Surveillance approaches to determine the risk, frequency and origin of
SARS-CoV-2 entry into UK airports
Page 3 of 21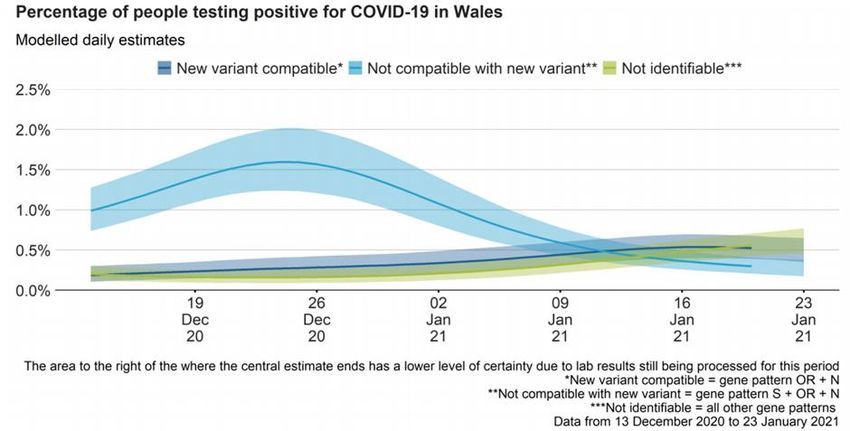
TAC ADVICE ONLY NOT WELSH GOVERNMENT POLICY
o Air cleaning devices
o Long-COVID
Growth rate and Reproduction number
The Reproduction (Rt) number is the average number of secondary infections
produced by a single infected individual. Rt is an average value over time,
geographies, and communities. This should be considered when interpreting
the R estimate for the UK given the differences in policies across the four
nations.
The most recent estimate of the Reproduction number (Rt) for Wales from
SAGE (approved by SAGE on 28 January) is predicted to be between 0.7 and
0.9 (90% confidence interval). The estimate of Rt is shown as a range without
a central estimate and is a lagging indicator, based on the latest data available
up to 25 January.
The current daily growth rate estimated by SAGE (approved by SAGE on 28
January) is between -0.06 and -0.01 (90% confidence interval) in Wales,
indicating that infections could be shrinking by between -6% and -1% per day.
Public Health Wales also estimate Rt for Wales using data on the number of
positive cases. These estimates should be interpreted with caution may be
effected by changes in testing patterns. As at 22 January, Rt in Wales is
estimated to be between 0.71 and 0.74 (95 % confidence interval). See Figure
below.
Care should still be taken when interpreting Rt and growth rate estimates for the
UK, due to their inherently lagged nature, testing availability and, as these
figures mask variation in the number of infections, how rates of transmission
are changing in some parts of the country.
The estimates of Rt are shown as a range without a central estimate. A growth
rate that is lower but still positive, or an Rt number above 1, indicates that the
epidemic is growing exponentially.
Halving time
As at 26 January, Public Health Wales estimated the halving time (the time it
takes for the number of cases to half) to be 17.6 days (95% confidence interval
10.4 to 57.9 using data from 09/01/2021 to 22/01/2021 (see Figure below).
Halving time (and Rt and growth rates), gives an indication of the rate of change
and therefore it should be treated with caution for the reasons outlined above.
Page 4 of 21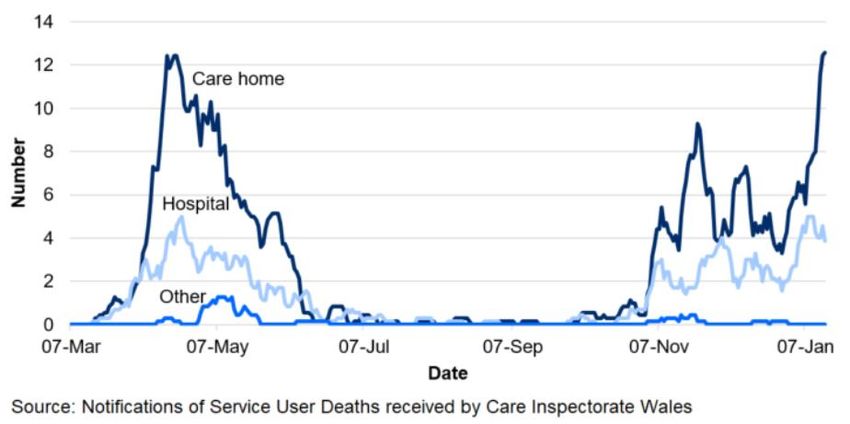
TAC ADVICE ONLY NOT WELSH GOVERNMENT POLICY
International update
Overall the situation in Europe shows reducing infection trends as continued
lockdowns restrict the chances of transmission between people. However,
there are two significant exceptions as described below.
Spain and Portugal
The recent rapid rises in cases in Portugal has continued this week with record
numbers of cases reported. For Portugal, this latest wave is higher than all
previous waves, notwithstanding the uncertainty of the first wave in March and
April 2020. As deaths rates have far exceeded previous waves, it would appear
that the current situation is as bad or worse than any previous wave. It is
reported that this rapid rise is due to the new variant.
In Spain the recent rise has been arrested and there are signs the situation
might be starting to improve. In an attempt to combat this recent rise, Spain is
to pilot a 4 day week (i.e. 32 hours spread over 4 days rather than slightly more
hours spread over 5 days) so as to reduce the potential for cross infection in
work places. It is reported that employees will continue to be paid for a 5 day
week with costs covered by the government.
Israel
The infection rate is beginning to fall from a high point of about a week ago
although it is still one of the highest in the world in per population terms. This
reduction in cases is due to a 4 week lock down which will continue for at least
two weeks more. Israel states that the rapid raise it experienced through
January has been due to the new variants and this has led to record number of
deaths in recent days. As expected, the death rate lags the infection rate by 1
to 2 weeks.
So far approximately 21% of the whole Israeli population has received the
second dose of the vaccine and has one of the highest levels of first vaccination
of any country. However, the vaccine roll out is not thought to be contributing
to the very recent reduction in cases (this is thought to be due to the lockdown)
so authorities have high hopes that the high vaccination rate will start to have
beneficial effects over the coming weeks and months.
The map below shows the 14-day average notification rate per 100,000 people
in the EU. The UK is not included due to Brexit.
Page 5 of 21
TAC ADVICE ONLY NOT WELSH GOVERNMENT POLICY
Data on the picture across Europe, including caveats around data lags and
variable testing policies is available here.
Case numbers
The figure below shows that numbers of confirmed COVID-19 cases per day (7
day rolling sum, per 100,000 of the population). Cases continue to show a
downward trend.
Source: Data from Public Health Wales as of 26 January
Page 6 of 21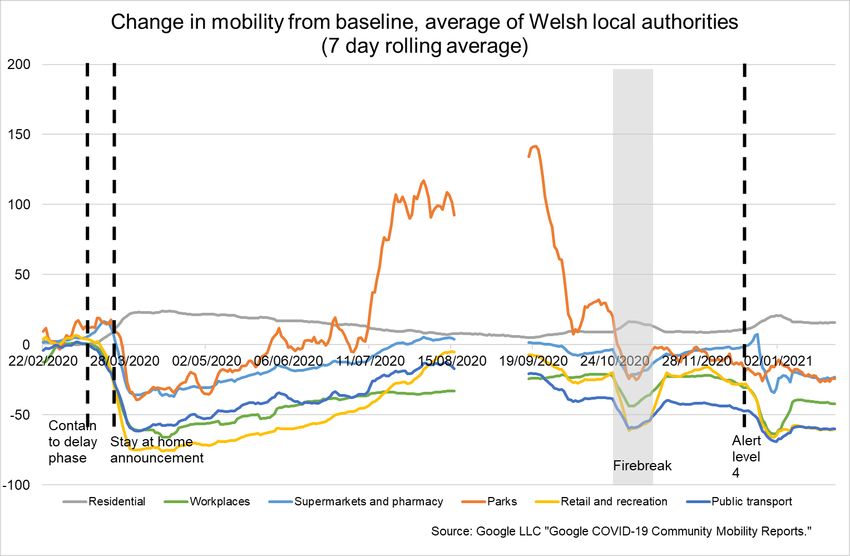
TAC ADVICE ONLY NOT WELSH GOVERNMENT POLICY
Age profile
The Figure below shows the number of confirmed COVID-19 episodes per
100,000 population, by week of sample collection and age group. The darker
red indicates an increased number of weekly cases.
Source: Welsh Government dashboard, data from Public Health Wales as at 20
January.
According to Public Health Wales, during week 03, incidence decreased in all
age groups, incidence was highest in those aged 85+
Covid-19 Infection Study results (Office for National Statistics)
These data are helpful because they are the only estimates of infection covering
asymptomatic as well as symptomatic cases, and they are not affected by other
factors such as testing capacity or the number of people coming forward for
testing. The results are for private households only – the ‘community population’
– and do not apply to those in hospitals, care homes or other institutional
settings.
However there is a greater lag in data from the infection survey than from other
sources such as Public Health Wales. It is also important to stress the
uncertainty around these estimates. Since the survey picks up relatively few
positive tests overall, the results can be sensitive to small changes in the
number of these positive tests. The sequencing data from Public Health Wales
Page 7 of 21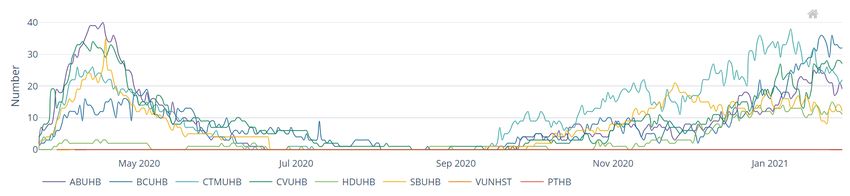
TAC ADVICE ONLY NOT WELSH GOVERNMENT POLICY
for positive cases may be more robust and less subject to a time lag, even
though it generally only includes people who have chosen to be tested.
The ONS infection survey data for the most recent week (17 to 23 January
2021) indicates that the positivity rate in Wales has levelled off in the most
recent week, after falling from the peak seen just before Christmas.
For the week 17 to 23 January 2021, an average of 1.43% of the community
population had COVID-19 (95% credible interval: 1.19% to 1.70%). This
equates to approximately 1 person in every 70 (95% credible interval: 1 in 85
to 1 in 60), or 43,600 people during this time (95% credible interval: 36,100 to
51,600).
The Figure below shows the latest estimates for positivity rates (%) since 13
December 2020 across the 4 UK Nations.
There is some uncertainty around the individual point estimates for the nations.
Estimates for the last few days of the series, shown as dashed lines in the chart
below, have more uncertainty.
Source: Coronavirus (COVID-19) Infection Survey, ONS, 27/01/21
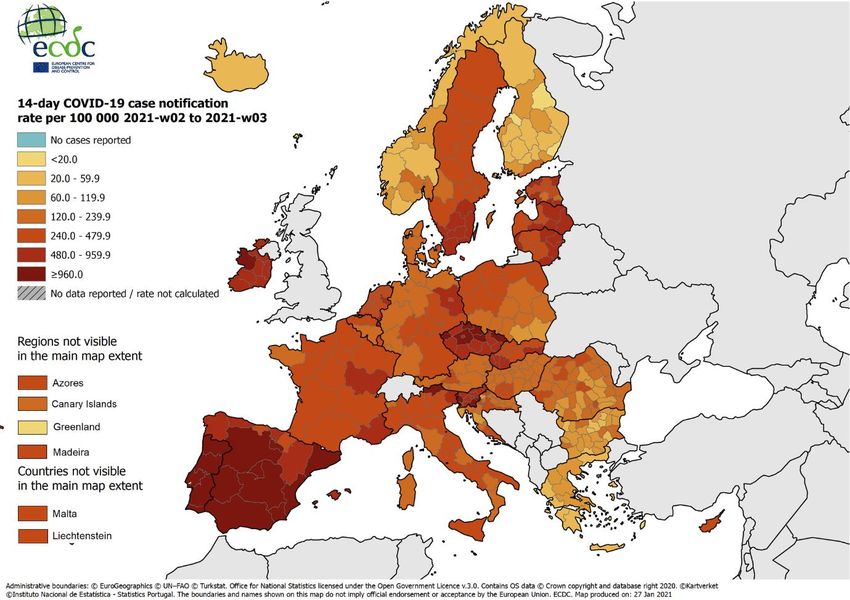
Following a recent increase, positive cases that are compatible with the new
variant VOC202012/01 have levelled off in the most recent week. Cases that
are clearly not compatible with the new variant have decreased. Cases where
quantities of the virus were too low for the variant to be identifiable has
Page 8 of 21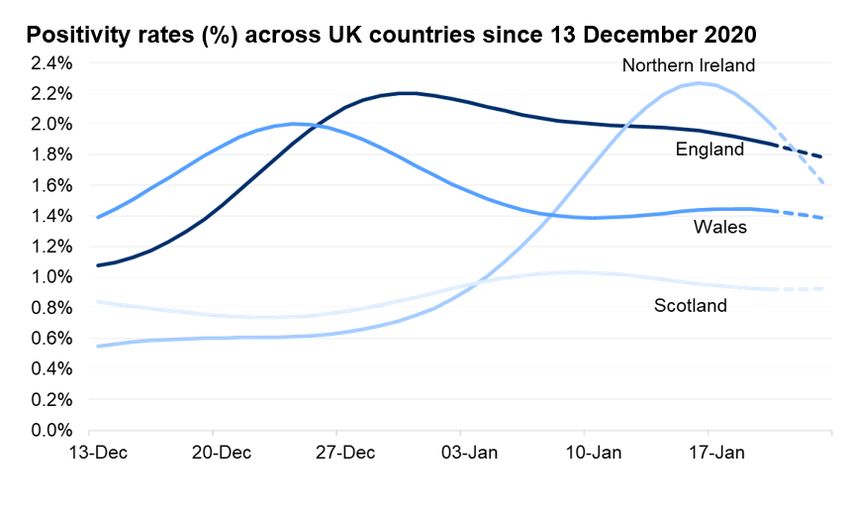
TAC ADVICE ONLY NOT WELSH GOVERNMENT POLICY
increased; these may represent cases where the Ct (cycle threshold2) value is
high and individuals have had the virus for a longer period of time. See chart
below.
Source: Coronavirus Infection Survey, ONS, 27/01/21
Full results are published here for Wales and here from the ONS.
Vaccination in Wales
As at 1 February, a total of 439, 640 first doses of COVID-19 vaccine have been
given in Wales. 1,066 people have received two doses.
The actual number of doses will be higher due to ongoing data entry.
Vaccinations data is available from the PHW tableau.
Deaths
The Figure below shows the 7 day rolling sum of COVID-19 deaths reported by
Public Health Wales rapid mortality surveillance as at 26 January. The weekly
number of deaths reported has decreased in the most recent week, but remains
high. Care should be taken in interpreting the most recent trends.
2
A high Ct value indicates a low concentration of genetic material and a low Ct value indicates a high
concentration of viral genetic material
Page 9 of 21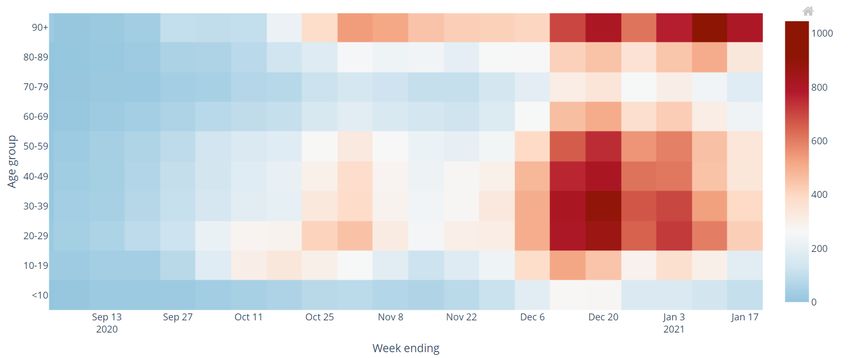
TAC ADVICE ONLY NOT WELSH GOVERNMENT POLICY
Source: Welsh Government dashboard, data from Public Health Wales as at 26
January.
It is important to note that this data includes reports of a death of a hospitalised
patients in Welsh hospitals or care homes where COVID-19 has been
confirmed with a positive laboratory test and the clinician suspects COVID-19
was a factor that caused death. It does not include patients who may have died
from COVID-19 but who were not confirmed by laboratory testing, those who
died in other settings, or Welsh residents who died outside of Wales. The true
number of deaths will be higher.
The Office for National Statistics (ONS) reports on both suspected and
confirmed COVID-19 deaths using data available on completion of the death
registration process and whilst subject to a time lag, is more complete.
The Figure below shows ONS data of the number of deaths involving COVID-
19 registered by week in Wales and the number of all cause deaths registered
by week from 28 December 2019 to 22 January 2021.
Page 10 of 21TAC ADVICE ONLY NOT WELSH GOVERNMENT POLICY
Source data: Office for National Statistics
In Wales, the number of registered deaths involving COVID-19 decreased from
467 (Week 2) to 447 (Week 3), the third highest recorded at any point during
the pandemic.
As notified to Care Inspectorate Wales (CIW), between 1 March 2020 and 15
January 2021, care home resident deaths with suspected or confirmed COVID-
19 has made up 21% of all reported deaths.
At the start of the November 2020 there was an increase in the number of
COVID-19 related deaths notified to CIW. Following a decrease in December
2020, there has been a further increase in January 2021. The average number
of COVID-19 deaths is now generally between 10 and 15 each day, which is
higher than the increase observed in November 2020.
The Chart below shows notifications of deaths of adult care home residents
with confirmed or suspected COVID-19 by location of death and day of
notification (7 day rolling average, between 7 March 2020 and 15 January
2021).
Page 11 of 21TAC ADVICE ONLY NOT WELSH GOVERNMENT POLICY
Further information on care home deaths is available here.
Adherence and understanding of current measures
There is new data from Public Health Wales this week. The results from IPSOS
MORI are the same as last week, new data are due next week.
The most recent IPSOS MORI data for the period 15-19 January for Wales
shows increases from the last survey which was before alert level 4 was
introduced (4-7 December). Those who reported wearing a face covering was
at its highest since collection started whilst those who reported making essential
trips only was the highest since May and higher than the survey during the
firebreak. It should be noted that this is self-reported adherence and will be
affected by individuals understanding of the rules and the circumstances that
apply to them.
The figure below represents data collected online by IPSOS MORI as part of a
multi-country survey on the Global Advisor platform. Each of the waves has
included c.500 respondents in Wales. The sample is broadly representative of
the adult population aged 16-74. Data is weighted to reflect the age and gender
profile of the Welsh population aged 16-74. All samples have a margin of error
around them. For a sample of around 500, this is +/- 4.8 percentage points.
Page 12 of 21TAC ADVICE ONLY NOT WELSH GOVERNMENT POLICY
The latest results from the Public Engagement Survey on Health and Wellbeing
during Coronavirus Measures for the period 4 January – 10 January show that
53% of people say they understand the current restrictions in Wales ‘very well’.
A further 40% reported understanding the restrictions ‘fairly well’. These results
are similar to two weeks ago which were higher than those in mid-December
before alert level 4 started. The survey also shows that 55% of people said they
were following coronavirus restrictions ‘completely’ and a further 37% reported
majority compliance, again similar to two weeks ago and higher than in mid-
December. 19% reported having people outside their household/permitted
extended household come into their house, whilst 13% reported going into
others people’s houses, both of these are lower than in mid-December and
similar to two weeks ago.
Mobility
Mobility data for the latest week (mostly the fourth week in January) shows little
change compared to the previous week. Patterns of mobility continue to be in
line with the firebreak – with levels mostly between the first and second week
of the firebreak.
Page 13 of 21TAC ADVICE ONLY NOT WELSH GOVERNMENT POLICY
Mobility of Facebook users in Wales shows movement was 29% below the
baseline for the week to the 29 January. This is similar to the week before
(30%). The percentage of users staying put (near to home) was 35%, the same
as the week before. The baseline is the average value, for the corresponding
day of the week, during the 4-week period 2 February – 29 February 2020.
Apple data for the week to the 30 January shows that requests for driving
directions in Wales were slightly down from the previous week at 70% of the
baseline (was 71%). Requests for walking directions and requests for public
transport directions were also slightly lower than the previous week relative to
the baseline. The baseline is the 13th of January 2020.
The Google mobility data to the week of the 26 January for residential (i.e
people spending time at home) are similar to the week before at 16% above the
baseline. Workplaces were down slightly (at 42% below the baseline). Retail &
recreation are the same as last week (60% below the baseline) whilst
supermarkets & pharmacy show a small increase (23% below the baseline, up
from 24%). Public transport and parks show no change compared to the
previous week.
The figure below shows the change in mobility in Wales using Google mobility
data. The figures are based on the average of the local authorities that have
data. The baseline is the median value, for the corresponding day of the week,
during the 5-week period Jan 3–Feb 6, 2020. The data for several categories
is not available for August 17th – September 10th due to the data not meeting
quality thresholds.
Page 14 of 21TAC ADVICE ONLY NOT WELSH GOVERNMENT POLICY
Anonymised and aggregated mobile phone data from O2 for the week to the 22
January shows a similar level of trips compared to the week before. Trips
starting in Wales rose by 1 percentage point to 51% of the baseline. The
baseline for the O2 data is the same day of the week in the first week of March.
Research
There are currently 10,767 Welsh patients recruited to COVID-19 urgent public
health studies, an increase of 234 since last report.
COVID-19 weekly surveillance and epidemiological summary from Public
Health Wales
As at 28 January
The proportion of calls to NHS 111 and NHS Direct related to possible COVID-
19 symptoms is stable compared to the previous week, overall GP
consultations for any Acute Respiratory Infection (ARI) and suspected COVID
and the number of ambulance calls possibly related to COVID-19 have
decreased in the most recent week.
The all-Wales number of lab confirmed COVID-19 episodes has continued to
decrease in the most recent week. Sample positivity for testing episodes was
14% in week 03.
Page 15 of 21TAC ADVICE ONLY NOT WELSH GOVERNMENT POLICY
During week 03, incidence decreased in all age groups, incidence was highest
in those aged 85+
Confirmed case incidence and testing episode positivity has decreased in all
regions of Wales in recent weeks.
At a national level, confirmed case admissions to hospitals and confirmed cases
who are inpatients in hospital decreased compared to the previous week. In the
most recent week, admissions to critical care wards decreased compared to
the previous weeks.
Recent surveillance data suggest that COVID-19 infections in Wales is
decreasing in all regions of Wales. Cases remain geographically widespread,
however the majority of local authority (LA) areas are seeing decreasing overall
trends in confirmed case incidence in the most recent week.
The number of incidents reported in recent weeks has decreased but remains
high in residential care homes.
Most school pupils are currently being taught online, with some face-to-face
learning for vulnerable children and children of critical workers. Schools
surveillance information is available on the Public Health Wales dashboard.
Between 7th December 2020 and 24th January 2021, 278,246 COVID-19
vaccinations had been given in Wales (data as at 27th January).
All-cause deaths are higher compared to the 5 year average, but decreased in
the most recent week.
Deaths in confirmed cases in hospital, reported through PHW mortality
surveillance decreased in the most recent week, but remain high.
Influenza and Respiratory Syncytial Virus (RSV) is not currently circulating in
Wales.
Local authority analysis from Public Health Wales
(Period covering 17 to 23 January 2021)
All local authorities are in the highest threshold for 7-day incidence (> 50 per
100,000) and test positivity (>5%).
Page 16 of 21TAC ADVICE ONLY NOT WELSH GOVERNMENT POLICY
Please use caution in interpreting trends for the most recent period as testing
data is not always complete and figures will be subject to future revision if late
data feed though.
Further information is available on the Public Health Wales dashboard.
Hospital occupancy
The figure below shows the confirmed COVID-19 hospital occupancy over the
first and second wave of the pandemic (7 day rolling average, as at 29 January).
The Figure below shows the confirmed COVID-19 intensive care unit (ICU)
occupancy over the first and second wave of the pandemic (7 day rolling
average, as at 29 January).
Page 17 of 21TAC ADVICE ONLY NOT WELSH GOVERNMENT POLICY
As of 29 January, the number of people with confirmed COVID-19 in hospital
has plateaued and reduced over recent weeks, but remains high and above the
April peak. Overall ICU occupancy (COVID-19 and non-COVID-19 patients) is
also high and close to the April peak. The number of people recovering from
COVID-19 is high, at over 1,100 in the most recent week.
When considering data on capacity (242 beds) and occupancy (196 beds)
reported to us by local health boards, Level 3 ICU across Wales is
approximately 81% occupied with both COVID and non-COVID patients (as of
29 January). However, there are normally approximately 152 critical care beds
(Level 3 ICU equivalent) and so hospitals are creating additional critical care
bed capacity due to increased demand. Therefore, critical care units in Wales
are at or over 100% occupied for their normal critical care capacity and 1:1
nursing staffing ratio for all critical patients may not possible for many patients,
even with non-critical care staff helping to care for patients.
The Figure below shows the total number of people who have tested Covid-19
positive and are in ICU in hospitals across the different health boards in Wales.
Data as of 25 January 2021.
The Figure below shows the number of people admitted to hospital and are
either suspected or confirmed as having Covid-19. The purple line represents
the total number over a rolling 7 day average, whilst the fainter grey lines show
the actual figures at that time. Data as of 29 January 2021.
Page 18 of 21TAC ADVICE ONLY NOT WELSH GOVERNMENT POLICY
The Figure below shows the number of hospital discharges of people who are
either suspected or confirmed as having Covid-19. The purple line represents
the total number over a rolling 7 day average, whilst the fainter grey lines show
the actual figures at that time. Data as of 29 January 2021.
The Figure below shows patients admitted to the intensive care units and are
either suspected or confirmed as having Covid-19. The purple line represents
the total number over a rolling 7 day average, whilst the fainter grey lines show
the actual figures at that time. Data as of 29 January 2021.
Professional Head of Intelligence Assessment (PHIA) probability yardstick
Where appropriate, TAC advice will express Likelihood or confidence in the advice
provided using the PHIA probability yardstick to ensure consistency across the
different elements of advice.
Page 19 of 21TAC ADVICE ONLY NOT WELSH GOVERNMENT POLICY
Page 20 of 21TAC ADVICE ONLY NOT WELSH GOVERNMENT POLICY
Page 21 of 21You can also read