Special Climate Statement-record warmth in the Tasman Sea, New Zealand and Tasmania - 27 March 2018 - Bureau of Meteorology
←
→
Page content transcription
If your browser does not render page correctly, please read the page content below
Special Climate Statement—record warmth in the Tasman
Sea, New Zealand and Tasmania
27 March 2018

Special Climate Statement—record warmth in the Tasman Sea, New Zealand and Tasmania

Version number/type      Date of issue
1.0                      27 March 2018

                  Unless otherwise noted, all images in this document are licensed under the Creative Commons
Attribution Australia Licence.

© Commonwealth of Australia and NIWA 2018

Published by the Bureau of Meteorology and NIWA

This publication may not be reproduced or copied in any form without the permission of the copyright
owner(s). This copyright extends to all forms of copying and any storage of material in any kind of information
retrieval system. NIWA makes no representations or warranties regarding the accuracy, completeness or fitness
for purpose of the information in this document. Any reliance on or other use of the information by a third party is
entirely at the third party’s own risk. NIWA accepts no liability for any loss or damage, whether direct or indirect,
consequential or otherwise, arising from reliance on or use of the information.

Cover image: Kapiti Coast, North Island, New Zealand. (Photograph: Dave Allen, NIWA).

                                                                                                                        2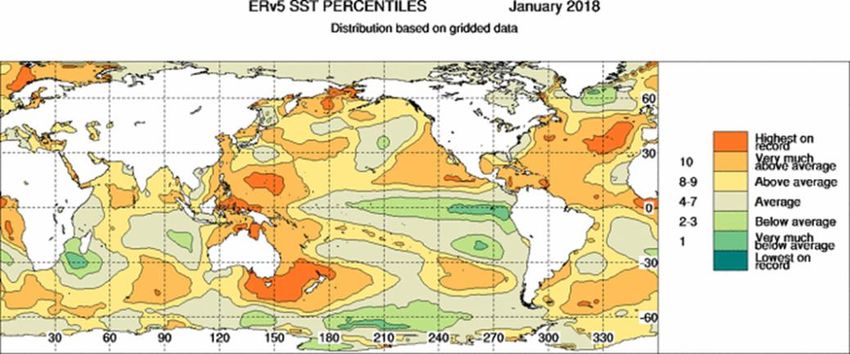
Special Climate Statement—record warmth in the Tasman Sea, New Zealand and Tasmania

Table of contents
Introduction ............................................................................................................................................. 4

        1.1 Record high temperatures in the south Tasman Sea ................................................................ 4

        1.2. Major climate anomalies in New Zealand ................................................................................ 8
          1.2.1. Temperature ...................................................................................................................... 8
          1.2.2. Rainfall............................................................................................................................. 11

        1.3. Major climate anomalies in Australia ..................................................................................... 12
          1.3.1. October and November .................................................................................................... 12
          1.3.2. Summer ........................................................................................................................... 13
          1.3.3. Overall warmth across the period..................................................................................... 14

References and further information ....................................................................................................... 16

                                                                                                                                                          3
Special Climate Statement—record warmth in the Tasman Sea, New Zealand and Tasmania

Introduction
Sea surface temperatures in the southern Tasman Sea rose to exceptionally high levels in late 2017 and early
2018. These temperatures were far above any others previously observed at that time of year in the region, and
extended west from New Zealand to Tasmania and mainland southeast Australia. In parallel with this, land
temperatures were well above average in areas near the Tasman Sea warm anomalies, with many records set
both in New Zealand and in southeast Australia (especially Tasmania).

Sea surface temperatures in the southern Tasman Sea were above average throughout 2017 but rose sharply
from November, reaching 2 °C or more above average1 over most of the Tasman Sea south of 35 °S. In
November, they were at record-high levels over a region extending from New Zealand to Tasmania. This warming
coincided with an extended period of blocking high pressure over the Tasman Sea sector, with monthly mean sea
level pressure (MSLP) for November as much as 10 hPa above average in places, and 7.5 hPa or more above
average over a belt extending from the South Island of New Zealand to west of Tasmania. Sea surface
temperatures persisted at record-high levels through December 2017 and January 2018. The peak of the event
had passed by February 2018, with sea surface temperatures falling below record levels but remaining well above
average.

Abnormally warm conditions developed on land on both sides of the Tasman in relation to the Tasman Sea marine
heat wave. In New Zealand, very warm conditions began to develop in the interior South Island from October
onwards, before extending nationwide during the summer. The summer of 2017–18 (December 2017 to February
2018) was the hottest on record for New Zealand, and January 2018 was the hottest month recorded. Atmospheric
moisture over much of New Zealand was also notably high during this time, and February 2018 saw several
extreme rainfall events, two of which were associated with former tropical cyclones.

Tasmania also warmed markedly from October 2017 onwards. In Tasmania, November was the most extreme
month of the period, with the largest mean temperature anomaly on record for any month in the State. October
2017, December 2017 and January 2018 were all the second-warmest on record for the respective month, and the
October–January and November–January periods were both the warmest on record by substantial margins.
Tasmania cooled substantially in February 2018 with temperatures in that month close to average, resulting in
summer mean temperatures falling below record levels. It was also a very warm period in coastal and near-coastal
areas of mainland southeast Australia, particularly southern Victoria and adjacent areas of southeast South
Australia and the southern New South Wales coast, although conditions in these regions were generally less
exceptional than those in Tasmania.

1.1 Record-high temperatures in the south Tasman Sea
The south Tasman Sea2 experienced record-high monthly sea surface temperature (SST) anomalies for November
2017 (+1.19 °C), December 2017 (+2.12 °C) and January 2018 (+1.96 °C) Records commence in 1950 and use a
1981–2010 baseline for calculation of anomalies..

The December 2017 and January 2018 values were close to a degree above the previous records for those
months (respectively, +1.00 °C in December 2005 and +0.98 °C in January 1971), whilst November 2017 was
0.25 °C above the previous November record from November 2005. The December 2017 and January 2018

1 Consistent with national reporting standards, a 1981-2010 base period is used for averages for New Zealand and
for sea surface temperatures, and a 1961-1990 base period is used for Australia.

2   Defined here as the region bounded by longitudes 145 °E and 175 °E, and latitudes 35 °S and 45 °S.

                                                                                                                   4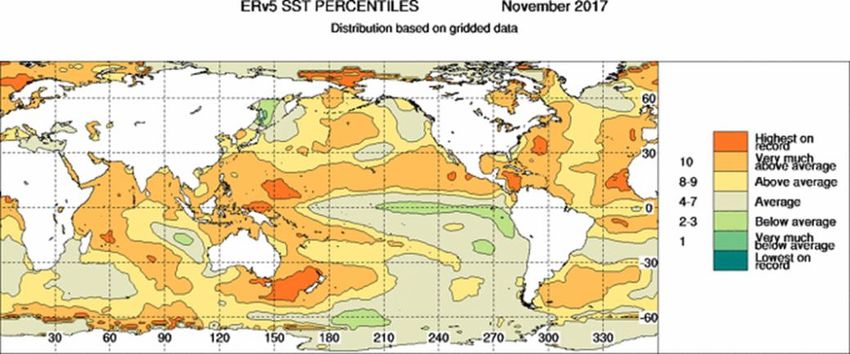
Special Climate Statement—record warmth in the Tasman Sea, New Zealand and Tasmania

values are also clearly the largest monthly anomalies on record for any month, surpassing the previous record of
+1.52 °C set in February 1971. 3

These higher than average SSTs developed from higher than normal mean sea level pressures that began in
October 2017 and persisted until the end of December 2017 (Figure 1). These blocking highs suppressed cloud
development in the region, which created sunny conditions that warmed the surface ocean, and low winds that
suppressed vertical mixing between the upper and lower ocean waters over the subsequent months. The warmer
than average SSTs developed first in the waters surrounding Tasmania in mid-November 2017 where the weekly
mean SSTs in the Tasman Sea exceeded 16 °C, which is over 3 °C above the 1981–2010 average and ranked as
some of the highest values on record. The persistent highs led to the warmer than average SSTs expanding
across the Tasman Sea to New Zealand. Record-high SSTs were analysed over an area extending from Tasmania
to New Zealand in November and December 2017 and January 2018 before becoming more localised at the end
of summer (Figure 2).

In February 2018 the SSTs in the Tasman Sea had cooled to the second warmest on record (1.09 °C above
average compared to 1.52 °C in 1971), but the SSTs maintained record-high warmth to the south and east of New
Zealand. This was due to the high mean sea level pressures that had developed in the east and southeast of New
Zealand from January 2018 onwards, and lower than normal pressures over and to the west of the country (over
the Tasman Sea).

3The early 1971 event coincided with severe flooding both in the Taranaki region of New Zealand, and two
separate major flood events on the South Coast of New South Wales and in eastern Victoria. A fall of 450.3 mm at
Brogo (Stockridge) on 6 February 1971 is the highest daily total ever recorded so far south in Australia.

                                                                                                                   5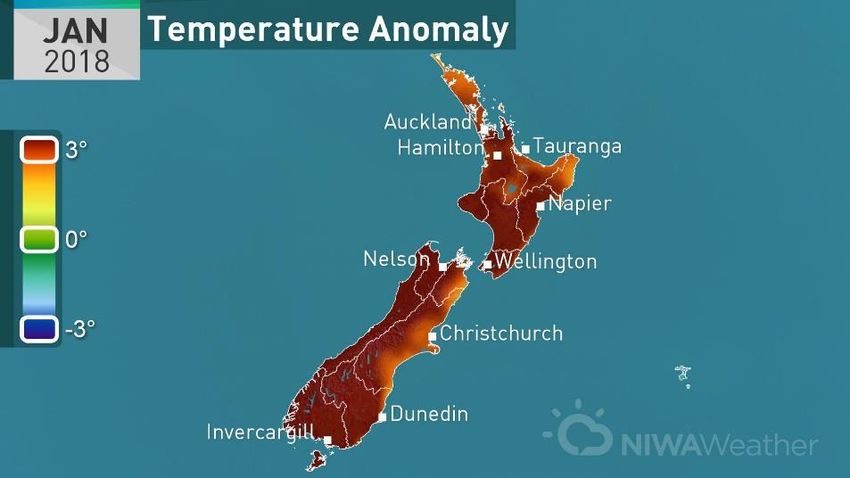
Special Climate Statement—record warmth in the Tasman Sea, New Zealand and Tasmania

Figure 1. Mean sea level pressure anomalies (hPa) for: (top left) November 2017, (top right) December
2017, (bottom left) January 2018, (bottom right) February 2018. Climatology period 1979–2000.

                                                                                                         6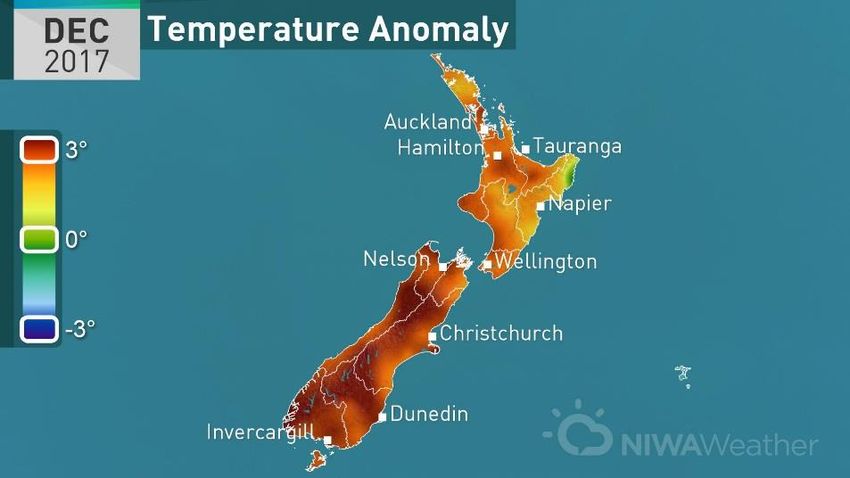
Special Climate Statement—record warmth in the Tasman Sea, New Zealand and Tasmania
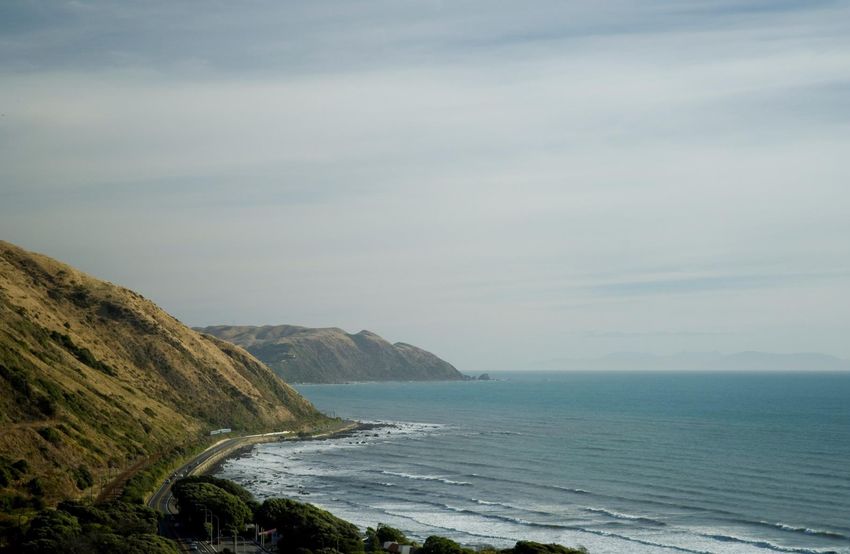
Figure 2. Monthly sea surface temperature deciles for November and December 2017, and January and
February 2018, from the ERSSTv5 dataset.
7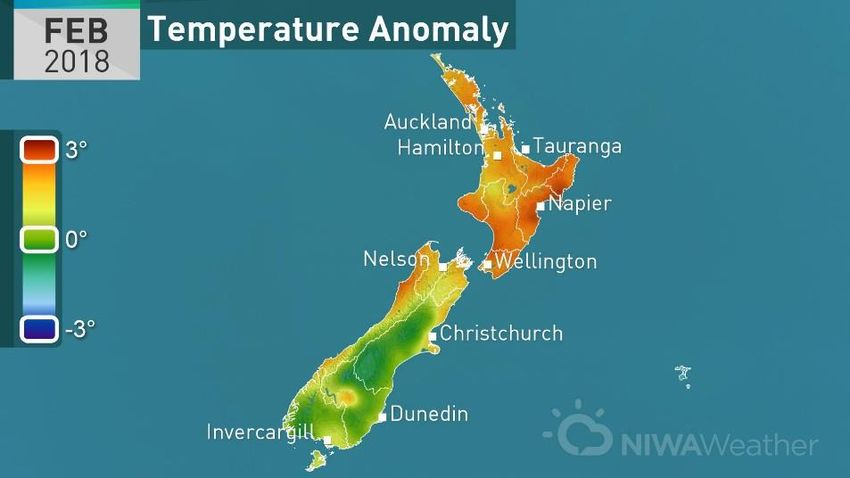
Special Climate Statement—record warmth in the Tasman Sea, New Zealand and Tasmania

1.2. Major climate anomalies in New Zealand
November 2017-February 2018 was characterised by mean sea level pressures that were higher than usual
across the New Zealand region. This pressure pattern delivered more frequent warm northerly and northeasterly
winds than normal, consistent with La Niña conditions. The warm air temperatures and sunny conditions warmed
the surface ocean around the country. In addition, calm winds meant there was lower than normal vertical mixing
between the warm surface ocean and cooler underlying water. These influences resulted in a relatively thin (in the
order of 25 m) surface layer of anomalously warm water forming in the Tasman Sea during November and
December 2017. This combination of high SSTs and increased frequency of northerly winds, as well as the
background influence of climate change on global temperatures, delivered unprecedented warmth to New Zealand
during summer.

In November 2017, Invercargill (southern South Island) set a record for its highest November average mean sea
level pressure, with 1019.2 hPa, with records going back to 1948. Nelson had its 2 nd-highest average November
MSLP (records back to 1942) and Milford Sound had its 3rd-highest average November MSLP (records back to
1934).

The marine heatwave in the Tasman Sea also affected rainfall during summer 2017–18 (December 2017-February
2018). Subtropical and tropical storms (including ex-tropical cyclones) that affected New Zealand during the
summer were able to retain characteristics which are usually present over warmer oceans, resulting in intense
rainfall rates and large rainfall amounts not typically observed in New Zealand. For example, as ex-tropical cyclone
Gita approached New Zealand, its low-level centre became displaced and then moved north over the abnormally
warm waters of the eastern Tasman Sea. This allowed for some warm core tropical storm characteristics to persist,
along with a rejuvenation in convection and heavy rainfall.

1.2.1. Temperature
Summer 2017–18 was New Zealand’s hottest summer on record. The nationwide average temperature for summer
was 18.8 °C—2.1 °C above the 1981–2010 summer average using NIWA’s seven station temperature series which
begins in 19094. Summer 2017–18 exceeded the former record held by the summer of 1934–1935, which was
1.8 °C above the 1981–2010 summer average temperature.

Although outside of the official summer season, it is worth noting that the warmth was initiated on land in
November 2017 (Figure 3). The persistent ridge of high pressure that was located over New Zealand and the
Tasman Sea caused very warm and dry conditions for the time of the year, particularly in the second half of the
month. The South Island experienced particularly warm temperatures, with some locations having their warmest
November on record. Cromwell (south-central South Island) experienced 23 consecutive days with a maximum
temperature above 25 °C, ending on 10 December 2017, which is unprecedented for Cromwell at that time of year.

4 https://www.niwa.co.nz/our-science/climate/information-and-resources/nz-temp-record/seven-station-series-
temperature-data

                                                                                                                   8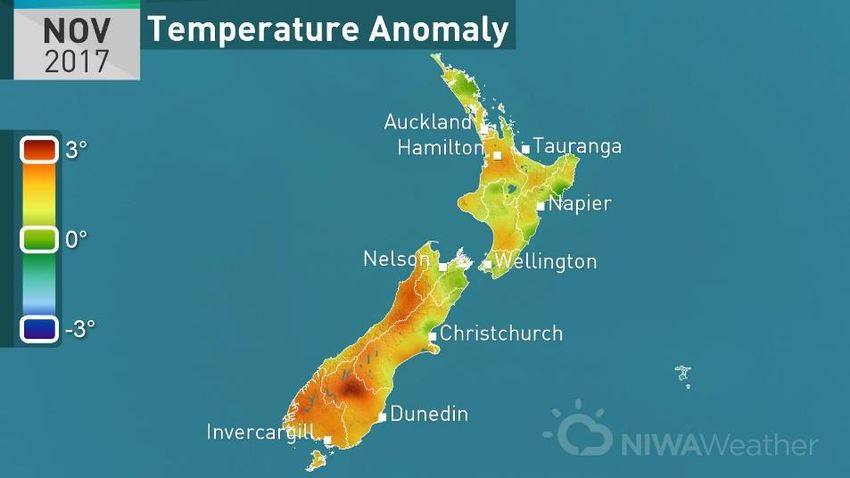
Special Climate Statement—record warmth in the Tasman Sea, New Zealand and Tasmania

        Figure 3. Mean temperature anomaly for New Zealand, November 2017 (1981–2010 climatology period).

The official summer season was off to a hot start with nearly the entire country observing well above average
mean temperatures (more than 1.20 °C above the 1981–2010 December average) during December 2017 (Figure
4). This was the second-warmest December on record for New Zealand with a nationwide mean temperature of
18.1 °C—2.4 °C above the 1981–2010 December average temperature from NIWA’s seven station temperature
series. Thirty-eight locations experienced record-high mean December temperatures. Notably, three locations
experienced their warmest December, with records going back into the 19 th century: Nelson in the northern South
Island)—1862, Levin in the southwest North Island—1895, and Ranfurly in the south-central South Island—1897.

        Figure 4. Mean temperature anomaly for New Zealand, December 2017 (1981–2010 climatology period).

January 2018 was the hottest month on record for New Zealand, with a nationwide mean temperature of 20.3 °C,
3.1 °C higher than the 1981–2010 January average temperature using NIWA’s seven station series (Figure 5). The
previous hottest month on record was February 1998, with a nationwide average temperature of 19.6 °C. Over half
of New Zealand’s regularly reporting climate stations observed mean temperatures at least 3 °C above their 1981–
2010 January average in January 2018, and 94 stations observed their highest mean January temperature on
record. Notably, Christchurch (eastern South Island) and Hokitika (western South Island) observed their hottest
January since records began in 1863 and 1866, respectively. Gore (southern South Island) had a mean
temperature of 19.2 °C—4.8°C higher than its January average—which is equal to the average daily maximum
temperature for January in the town. Mean maximum temperatures for January 2018 were highest about Central
Otago (south-central South Island), where Cromwell and Clyde observed maximum temperatures above 30 °C on
21 and 20 days, respectively. On average, these towns would usually observe 6 days above 30 °C in an entire
year.

                                                                                                                   9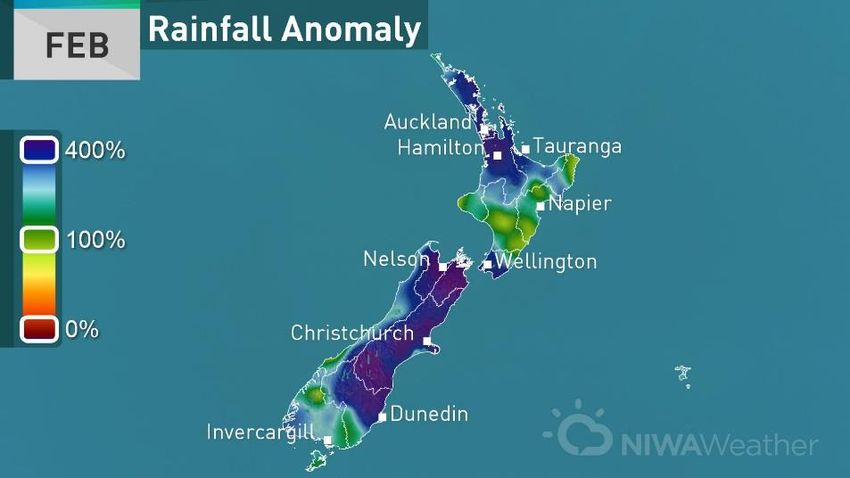
Special Climate Statement—record warmth in the Tasman Sea, New Zealand and Tasmania

        Figure 5. Mean temperature anomaly for New Zealand, January 2018 (1981–2010 climatology period)

February 2018 recorded a nationwide average temperature of 18.0 °C—0.8 °C above the 1981–2010 February
average temperature from NIWA’s seven station temperature series (Figure 6). February was a contrasting month
for temperatures, compared with December and January which saw widespread warmth across the country. In
February, many North Island locations experienced above (0.51–1.20 °C above average) or well above average
(more than 1.20 °C above average) temperatures while the South Island had above average temperatures in the
north and near (-0.50 to 0.50 °C of average) or even slightly below average (-0.51 to -1.20 °C of average)
temperatures elsewhere. The number of near-record high mean minimum (night time) temperatures exceeded the
number of near-record high mean maximum (day time) temperatures, which was a product of a very humid month
marked by sub-tropical and tropical airflows, keeping overnight temperatures elevated. Wellington (Kelburn) fell to
just 20.2 °C on 1 February, making it the warmest minimum temperature of any month there (records go back to
1928). Humidity was also a fixture in the capital, where on 11 February the city’s highest dew point temperature
(meteorological measure for humidity) was recorded.

        Figure 6. Mean temperature anomaly for New Zealand, February 2018 (1981–2010 climatology period).

For summer as a whole, over 50 locations set new summer mean temperature records, and approximately 50
other locations experienced their second- or third-hottest summer on record. The largest mean temperature
anomaly was experienced in Masterton in the southeast of the North Island, where the summer mean temperature
was 3.2 °C above average. Meanwhile, Leigh (northeast of Auckland) observed the highest mean temperature
overall for summer 2017–18 with 21.8 °C.

Many record or near-record high summer mean maximum (daytime) and mean minimum (night-time) temperatures
were also observed across all regions of the country. Notably, eight locations recorded mean summer maximum
temperatures which were at least 3.0 °C warmer than average. This includes Leigh, Levin (in the southwest North

                                                                                                                  10
Special Climate Statement—record warmth in the Tasman Sea, New Zealand and Tasmania
Island), and Westport (western South Island) which each experienced mean daytime maximums which were 3.4 °C
above average. Meanwhile, a further seven locations observed mean summer minimum temperatures which were
also at least 3.0 °C warmer than average. Of these, the most extreme was Masterton where mean night-time
minimum temperatures were 3.6 °C warmer than average.
Eighteen locations observed new record-high daily maximum temperatures during summer 2017–18, with an
additional two sites recording their equal-highest daily maximum temperature on record. During January 2018,
Invercargill (southern South Island) recorded three consecutive days above 30 °C. This is unprecedented in
records going back to 1905; the city had never previously recorded consecutive days above 30 °C. Alexandra
(south-central South Island) recorded 38.7 °C in late-January, which is New Zealand’s equal 15th-highest
temperature on record.
1.2.2. Rainfall
Summer 2017–18 was a contrasting season for rainfall in New Zealand, particularly due to the impacts of ex-
tropical cyclones Fehi and Gita during February.
During November 2017, numerous locations experienced their driest November on record, and much of the South
Island and southern North Island had well below normal rainfall (less than 50% of the 1981–2010 November
normal). Christchurch had its driest November in its record of 154 years, and Lincoln (near Christchurch) had its
2nd-driest month overall since records began there in 1881. Levin also recorded its driest November since records
began there in 1895.
The summer season had a dry start with most of the country experiencing calm weather and below normal (50–
79% of the 1981–2010 normal December rainfall), or well below normal (less than 50% of normal) rainfall during
December 2017. A large number of locations observed either their lowest or near-lowest December rainfall on
record. This included Auckland Airport, which recorded only 8 mm of rain (9% of the 1981–2010 December normal
rainfall total), its driest December since records began there in 1959. A medium scale adverse drought event was
declared by the Ministry for Primary Industries in the lower North Island, the West Coast, Otago, and Southland
during December due to prolonged dry conditions. Christchurch Airport observed a 47-day dry spell (defined as
less than 1 mm of rain on any day), which ended in mid-December 2017.
During January 2018, several rainfall events occurred, delivering above normal (120–149% of the 1981–2010
January normal rainfall), or well above normal (greater than 149% of January normal rainfall) rainfall levels to much
of the top half of the South Island, as well as many areas of the North Island. Below normal, or well below normal
January rainfall was experienced for much of Southland, Otago, and Hawke’s Bay. The wet month contrasted to a
relatively dry end to 2017 in many areas. For example, Auckland’s North Shore observed a total of 275 mm of rain
for January 2018, which was higher than the combined rainfall of the previous four months (256 mm was observed
from September to December 2017).
February 2018 was the wettest month of the season as the passage of ex-tropical cyclones Fehi and Gita over the
country brought significant amounts of rainfall and contributed to rounds of flooding and severe slips, especially
across the upper and eastern South Island. Rainfall totals in some locations in the northern and eastern South
Island were 300–400% of the February normal (Figure 7), and parts of the northern and southern North Island
experienced over 200% of normal February rainfall. Nelson recorded 234 mm of rain for February 2018, which
made it the wettest February in the 156-year historical record there. In Cromwell (south-central South Island), 97
mm of rain occurred during the month, making it the wettest February on record for that station. This gave the town
35% of the total rainfall that it received last year—Cromwell was New Zealand’s second-driest location in 2017
(280 mm of rain fell). Kaikoura (northeast South Island) recorded 233 mm of rain during February—422% of the
February normal or about a third of the annual normal rainfall total. Most of this rain fell in an 18-hour window on
20 February during ex-tropical Cyclone Gita. In contrast, parts of Gisborne, Hawke’s Bay, Manawatu-Whanganui
and Southland were somewhat sheltered from the moist northerly-quarter airflows and observed near normal (80–
119% of normal), or slightly below normal (50–79% of normal) rainfall.
11Special Climate Statement—record warmth in the Tasman Sea, New Zealand and Tasmania
Figure 7. Rainfall percentage of normal for New Zealand, February 2018 (1981–2010 climatology period).
For the summer as a whole, the north and east of the South Island received above or well above normal summer
rainfall where the impacts of the ex-tropical cyclones were most intense. Notably, Appleby (northern South Island)
and Waipara (northeast South Island) recorded their wettest summer on record, observing 276% and 211% of
normal summer rainfall, respectively, while several other South Island stations observed near-record amounts. Due
to the dry start and the wet end to summer, there were not many records or near-records for high or low summer
rainfall totals.
1.3. Major climate anomalies in Australia
1.3.1. October and November 2017
Above-average temperatures became established in Tasmania during October. It was the second-warmest
October on record for the State, with mean temperatures 1.48 °C above the 1961–1990 average. October was also
significantly warmer than average in Victoria (mean temperatures 1.40 °C above average), although well short of
the records set in October 2015.
The most relatively extreme conditions in Tasmania occurred in November, as a result of a large blocking high
being positioned to the east for most of the last three weeks of the month. This caused an exceptionally persistent
period of warm temperatures (at a time of year which is more commonly characterised by high variability). In total,
there were 14 consecutive days, from 17 to 30 November, when daily mean temperature averaged over the State
was 5 °C or more above the 1961–1990 monthly average. This was far in excess of the longest previous such
sequence at any time of year, an 8-day sequence from 6 to 13 March 2013. Several locations, especially in
southern and western Tasmania, set records for persistent warmth for any time of year, despite it not yet being
summer; at Strahan, seven consecutive days of 27 °C or above, and 18 consecutive days of 21 °C or above were
both records for any month, whilst Hobart's six consecutive days of 25 °C also equalled its record, last set in
January 2013. 5The warm spell was more notable for its duration than its intensity, with only a few locations, mostly
in the State's north, experiencing their highest November temperature on record.
5
Further details on November 2017 climate anomalies in Tasmania and Victoria are available in Special Climate
Statement 63—A prolonged warm spell in Tasmania and Victoria.
12Special Climate Statement—record warmth in the Tasman Sea, New Zealand and Tasmania
Mean temperatures for Tasmania for November were the highest on record almost everywhere in the State, except
for the Bass Strait islands (Figure 8). The statewide average was 2.58 °C above the 1961–1990 average, which
was 0.54 °C above the previous November record, set in 2000, and 0.33 °C above the previous largest monthly
anomaly for any month. Daytime maximum temperatures were particularly high, with the monthly mean anomaly of
+3.79 °C also the highest on record for any month (previously +3.20 °C in October 1914), and 1.7 °C above the
previous record. Combined with the warm October temperatures, this gave Tasmania its warmest spring on record,
despite below-average temperatures in September.
Southern Victoria, and some adjacent parts of eastern South Australia, also experienced extended periods of
warmth, both by day and night. Melbourne had six consecutive days of 30 °C or above, equalling the previous
November record, whilst fourteen consecutive nights of 15 °C or above easily surpassed the previous November
record of nine (and is a sequence unmatched previously before January). Numerous stations in an area extending
from Melbourne to Bairnsdale, in Gippsland, set November records for consecutive days of 25 °C or above, while
records for consecutive November nights of 15 °C or above were set across a range of stations in the western half
of Victoria and eastern border areas of South Australia. Whilst monthly mean temperatures for Victoria (3.08 °C
above the 1961–1990 average) fell well short of those observed in November 2009—the most extreme month on
record in mainland southeastern Australia, although with a limited impact on Tasmania—it was still the State's
second-warmest November on record, and only the sixth month in which Victorian mean temperatures have been
3 °C or more above average.
A major contributor to the warmth was exceptionally high pressure over and south of Australia. The monthly mean
sea level pressure at 9am local time at Hobart was 1019.6 hPa—7.1 hPa above the 1961–1990 average, and the
highest on record for November (previously 1018.8 hPa in November 2007). Other long-term stations to set record
November monthly mean pressures included Launceston Airport in northern Tasmania, and Gabo Island in far
eastern Victoria.
Persistent onshore flow on the northern side of the blocking high resulted in a notable lack of warm days in coastal
New South Wales and southern Queensland, and the adjacent ranges. This was most significant in northeastern
New South Wales, where Armidale failed to reach 22 °C on 16 consecutive days, a November record. Sydney had
17 consecutive days below 25 °C, the longest such sequence in November since 2000.
Figure 8. Mean temperature deciles for Australia, November 2017.
1.3.2. Summer
Although the blocking high in the south Tasman Sea broke down in early December, abnormally warm conditions
continued in Tasmania through December and January (Figure 9). Both had the second-warmest mean
temperatures on record for their respective months; December (1.73 °C above the 1961–1990 average) ranked
13Special Climate Statement—record warmth in the Tasman Sea, New Zealand and Tasmania
behind December 2015 (+2.17 °C), while January (1.84 °C above average) was second after January 1961
(+2.18 °C).
December's warmth was more prominent by night than by day, with statewide minimum temperatures setting a
new record (1.78 °C above average, previously 1.58 °C in December 1985), and as in November, was marked
more by persistent warmth than individual extremes. January was particularly warm in the second half of the
month, which featured two significant periods of extreme heat. In the first, larapuna (Eddystone Point) had its
hottest day on record with 38.2 °C on the 19th, whilst in the second, Campania reached 39.6 °C on the 28th, the
highest temperature in Tasmania since January 2013. This was followed by exceptionally high overnight
temperatures on the 29th, which had the highest statewide mean daily minimum on record for Tasmania (19.47 °C,
surpassing the previous record of 18.70 °C on 30 January 2009). Numerous locations in northern and central
Tasmania had their warmest night on record on either the 28th or 29th, including larapuna (Eddystone Point), Low
Head, Devonport, Burnie, Smithton and Butlers Gorge.
Conditions cooled significantly in Tasmania in the last two days of January (Marrawah in the far northwest, which
had had its warmest night on record on the 29th, had its coldest January day on record on the 31st), setting the
scene for a near-average February. Despite the very warm December and January, the mild conditions in February
prevented any significant summer mean temperatures from being set. Overall summer mean temperatures for
Tasmania were 1.24 °C above the 1961–1990 average, which made it the fifth-warmest summer on record, and
0.54 °C cooler than the record set in 2015–16.
December was particularly notable for overnight warmth on the mainland. Mean monthly minimum temperatures
for the month were the highest on record over coastal areas and the adjacent ranges for most of eastern Victoria,
and for eastern New South Wales as far north as the Sydney region—although not in Sydney itself. Monthly mean
temperatures were generally less significant than those in Tasmania (partly because the normal range of variability
is higher on the mainland). Victoria's December mean was 1.48 °C above the 1961–1990 average, which ranks as
equal 11th highest of the post-1910 period.
January was a period of more general warmth through eastern mainland Australia, with monthly mean
temperatures well above average throughout Victoria, New South Wales and Queensland (except the far north),
rather than being focused in southern coastal areas as they had been in December. There were several significant
heatwaves, particularly in New South Wales and northern Victoria. Mean January temperatures in Victoria were
2.75 °C above average, the third-highest on average. Unlike Tasmania, Victorian mean temperatures were also
significantly above average in February (1.00 °C above the 1961–1990 average), although not as much so as in
New South Wales and Queensland, or as they had been in Victoria earlier in the summer. Overall it was Victoria's
third-warmest summer on record, and the warmest since 2000–01.
Figure 9. Mean temperature deciles for Australia, December 2017 and January 2018.
1.3.3. Overall warmth across the period
The most significant temperature anomalies on land were focused on the period from November to January, which
coincided with the most extreme sea surface temperature anomalies in the southern Tasman Sea.
14Special Climate Statement—record warmth in the Tasman Sea, New Zealand and Tasmania
For the November–January period, mean temperatures were 2.05 °C above the 1961–1990 average for Tasmania,
and 2.44 °C above average for Victoria. It was the warmest such period on record for both States. In Tasmania,
the record was set by a substantial margin—0.44 °C above the period from November 2015 to January 2016. The
differential was less in Victoria, where 2017–18 was 0.07 °C warmer than the period from November 2009 to
January 2010. Record-high mean temperatures over this period occurred over almost all of Tasmania, and much
of central and western Victoria (Figure 10).
Records were also set for Tasmania for some longer periods; both October to January (1.91 °C above average,
previously +1.53 °C in 2015–16) and November to February (1.58 °C, previously +1.55 °C in 2015–16). In Victoria,
the October to January and November to February periods ranked as second- and third-warmest respectively.
Figure 10. Mean temperature deciles for Australia, November 2017 to January 2018.
15Special Climate Statement—record warmth in the Tasman Sea, New Zealand and Tasmania
References and further information
This statement is based on information available as of 19 March 2018. There may be changes to some data points
as a result of routine quality control processes.
Reference periods used for anomalies are according to standard national practices. 1981–2010 is used as the
standard base period for New Zealand and for sea surface temperatures, whilst 1961–1990 is used as the
standard base period for Australia.
Further Australian information is available from:
http://www.bom.gov.au/climate
Further New Zealand information is available from:
http://www.niwa.co.nz/our-science/climate
16You can also read