AIR NEW ZEALAND 2020 INTERIM RESULT - Air New Zealand website

Page created by Jerome Paul
 
CONTINUE READING
AIR NEW ZEALAND 2020 INTERIM RESULT - Air New Zealand website
AIR NEW ZEALAND 2020 INTERIM RESULT
AIR NEW ZEALAND 2020 INTERIM RESULT - Air New Zealand website
Forward-looking statements
This presentation contains forward-looking statements. Forward-looking statements often include words
such as “anticipate”, “expect”, “intend”, “plan”, “believe”, “continue” or similar words in connection with
discussions of future operating or financial performance.

The forward-looking statements are based on management's and directors’ current expectations and
assumptions regarding Air New Zealand’s businesses and performance, the economy and other future
conditions, circumstances and results. As with any projection or forecast, forward-looking statements are
inherently susceptible to uncertainty and changes in circumstances. Air New Zealand’s actual results
may vary materially from those expressed or implied in its forward-looking statements.

The Company, its directors, employees and/or shareholders shall have no liability whatsoever to any
person for any loss arising from this presentation or any information supplied in connection with it. The
Company is under no obligation to update this presentation or the information contained in it after it has
been released.

Nothing in this presentation constitutes financial, legal, tax or other advice.

                                                                                  AIR NEW ZEALAND 2020 INTERIM RESULT   2
AIR NEW ZEALAND 2020 INTERIM RESULT - Air New Zealand website
Forward-looking statements
 Changes in accounting treatment
This presentation contains forward-looking statements. Forward-looking statements often include words
  Throughout this presentation and all related commentary, prior period comparative figures have been
such as “anticipate”, “expect”, “intend”, “plan”, “believe”, “continue” or similar words in connection with
  restated, where applicable, to reflect the retrospective disestablishment of fair value aircraft hedges
discussions of future operating or financial performance.
  following clarifications on the treatment of these hedges by the International Financial Reporting
  Interpretations Committee during the 2020 interim reporting period.
The forward-looking statements are based on management's and directors’ current expectations and
assumptions regarding Air New Zealand’s businesses and performance, the economy and other future
conditions, circumstances and results. As with any projection or forecast, forward-looking statements are
  The Group’s
inherently      adoptiontoofuncertainty
            susceptible       the new leasing  standard
                                         and changes    in (NZ   IFRS 16) effective
                                                            circumstances.   Air New1 Zealand’s
                                                                                      July 2019,actual
                                                                                                    has also impacted
                                                                                                          results
  the vary
may    way materially
           in which the   Group
                       from      presents
                             those         lease
                                    expressed  or costs
                                                  impliedandin other  associated balances
                                                               its forward-looking           in the income
                                                                                   statements.
  statement, balance sheet and statement of cash flows. Prior year comparatives have not been restated,
  in accordance
The   Company, its with the transition
                     directors,        provisions
                                employees   and/orofshareholders
                                                     the new standard.
                                                                     shall have no liability whatsoever to any
person for any loss arising from this presentation or any information supplied in connection with it.
             The Company is under no obligation to update this presentation or the information contained in
it For
   afterfurther
          it has information, please refer to Note 8 of the Group’s 2020 Interim Financial Statements.
                  been released.

Nothing in this presentation constitutes financial, legal, tax or other advice.

                                                                                     AIR NEW ZEALAND 2020 INTERIM RESULT   3
AIR NEW ZEALAND 2020 INTERIM RESULT - Air New Zealand website
AIR NEW ZEALAND 2020 INTERIM RESULT
AIR NEW ZEALAND 2020 INTERIM RESULT - Air New Zealand website
AIR NEW ZEALAND 2020 INTERIM RESULT
AIR NEW ZEALAND 2020 INTERIM RESULT - Air New Zealand website
1H 2020 result reflects delivery of our strategy amidst a mixed
 economic environment

• Changes in network strategy outlined last March are performing well
   − Solid revenue performance in 1H, driven by growth into new markets and strong demand in the
     Domestic and Pacific Islands markets
   − Overall revenue performance impacted by further decline in the global cargo market
• Underlying unit cost improvement in 1H reflects successful implementation of business
  transformation activities
   − Remaining cost initiatives on track to be delivered in the next 18 months
   − Overall cost performance impacted by maintenance costs, increased domestic air navigation
     and landing charges, a weaker New Zealand dollar, and higher ownership costs
   − Fuel costs in-line with expectations
• Well placed to navigate short-term demand impact of the recent Covid-19 outbreak

                                                                           AIR NEW ZEALAND 2020 INTERIM RESULT   6
AIR NEW ZEALAND 2020 INTERIM RESULT - Air New Zealand website
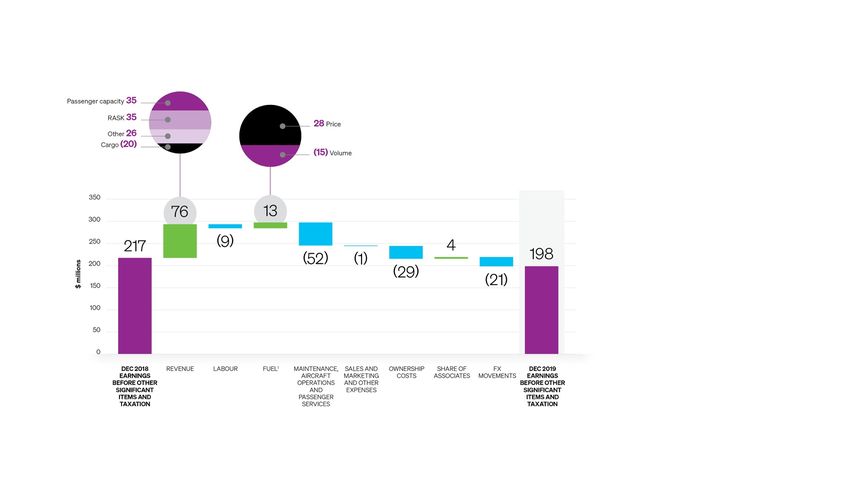
Our network responses to the lower demand growth environment
helped drive improved revenue outcomes in the first half
  Previously communicated drivers of network
                  growth:

                                                Good performance from recently launched
   1          Attractive new
                 markets
                                                 growth markets across Asia and the US

                                                A321 NEO’s on the Tasman and Pacific
   2              Upgauge
                   aircraft                      Islands network provide ~30% more
                                                 seats, at the same fuel cost per trip

             Moderate growth                    Strong demand across the Domestic and
   3         on existing routes                  Pacific Islands networks

                                                                     AIR NEW ZEALAND 2020 INTERIM RESULT   7
AIR NEW ZEALAND 2020 INTERIM RESULT - Air New Zealand website
Our cost reduction initiatives previously outlined in March last year
remain on track

                                                           What we said in March   On track to achieve or
      Cost programme targets                                       2019                   exceed?
                                                           Amount       Timing1    Amount         Timing

     1            Removal of inefficiencies associated
                  with the Rolls-Royce engine issues
                                                           ~$20
                                                           million
                                                                       All 2020
                                                                                                  
                                                                                                                    On track to deliver planned
                                                                                                                    savings despite additional
                                                                                                                    TEN maintenance backlog

                                                                        Split

     2
                  ~5% reduction in overheads through
                  reprioritisation, process efficiencies
                             and automation
                                                           ~$20
                                                           million
                                                                       evenly
                                                                      2020 and
                                                                        2021
                                                                                                                             On track

                                                                        Split                                       On track to achieve target,
     3                                                                                            
                   A targeted review of the operations     ~$20        evenly                                       with timing skewed to 2021
                                cost base                  million    2020 and
                                                                        2021

1 Refers   to Air New Zealand’s financial year.

                                                                                                            AIR NEW ZEALAND 2020 INTERIM RESULT   8
1H 2020 financial highlights                                                               Earnings before other significant items and taxation
                                                                                           ($ million)

                                                                                          500

• Operating revenue $3.0 billion, up 3.0%                                                 450
                                                                                                  464
                                                                                          400

• Earnings before other significant items and                                             350
                                                                                          300                  331          327
  taxation $198 million, down 8.8%                                                        250
                                                                                          200
                                                                                                                                           217
• Earnings before taxation $139 million                                                   150                                                           198

                                                                                          100

• Net profit after taxation $101 million, down 33%                                         50
                                                                                            0
                                                                                                  Dec          Dec         Dec             Dec         Dec
• Reported operating cash flow of $534 million                                                    2015         2016        2017            2018        2019

    $198m
 Earnings before                          ($59m)                         $139m                  ($38m)                    $101m
 other significant                      Other significant               Earnings before                                     Net profit
                                                                                                Taxation
    items and                               items1                         taxation                                       after taxation
      taxation

1 Refer   to slide 31 for further details on other significant items.

                                                                                                                         AIR NEW ZEALAND 2020 INTERIM RESULT   9
AIR NEW ZEALAND 2020 INTERIM RESULT
Solid revenue growth and CASK* improvement offset by a weaker
New Zealand dollar

                                         • Passenger revenue excluding FX up 2.8%; reported up 3.2%
                                               –   Strong demand up 4.0% on capacity growth of 2.8%
          Revenue
                                               –   RASK excluding FX down 0.1%; reported up 0.3%
                                         • Cargo revenue excluding FX down 9.4%; reported down 8.5%

                                         • CASK* improvement of 0.5%
                                               −   Reported CASK including fuel, FX and maintenance for third parties up 0.7%
                                               −   Economies of scale and efficiencies of $59 million more than offset the impact of
                                                   non-fuel price changes
              Cost
                                         • Reported fuel cost increased $7 million, 1.1% driven by:
                                               –   Average fuel price decrease (net of hedging) of $28 million, down 4.3%1
                                               –   Weaker New Zealand dollar adversely impacted fuel cost by $20 million
                                               –   Increased volumes from capacity growth drove $15 million of additional cost
* Excluding   fuel price movement, FX and maintenance for third parties.
1   Fuel cost movement details provided in supplementary slides.

                                                                                                       AIR NEW ZEALAND 2020 INTERIM RESULT   11
Changes in profitability
                                                                      Additional commentary

                                                                      • Labour cost increase of 1.3%,
                                                                       below capacity growth of 2.8%
                                                                       and driven by reduced incentive
                                                                       payments as well as impact of
                                                                       cost initiatives outlined in
                                                                       business review

                                                                      • Maintenance, aircraft operations
                                                                       and passenger services costs
                                                                       reflect 2.8% capacity growth and
                                                                       additional maintenance activity
                                                                       for third parties, as well as an
                                                                       increase in domestic air
                                                                       navigation and landing charges

                                                                      • Ownership cost increase driven
                                                                       by new aircraft deliveries

1   For further details refer to Fuel Cost Movement slide 26.

                                                                AIR NEW ZEALAND 2020 INTERIM RESULT   12
1H 2020 Passenger revenue performance by market

                            • Robust revenue growth driven by new
                              services, as well Rugby World Cup
                                                                                                     • Additional market capacity                              • Performance
                              demand in Japan
               Asia                                                                      North       • Weaker New Zealand dollar                                 in-line with
                                                                                                                                                   Europe
                            • Softness in Hong Kong remains due to                      America                                                                  expectations
                                                                                                       impacted demand from
                              ongoing unrest
                                                                                                       New Zealand to the US

                                                    • Strong RASK growth due to capacity
                                          Pacific     rationalisation
                                         Islands1   • Some softness in Samoa following the
                                                      measles outbreak

                                                                                                                                                    • Steady performance
                                                                                                                                       South          across peak season,
                             • Market capacity remains high although                                                                  America         however economic
              Tasman           some signs of rationalisation towards the                                                                              environment continues
                               end of 1H 2020                                                                                                         to be challenging
                                                            • Strong demand has driven improved RASK
                                                            • Domestic fare restructure has stimulated
                                                              additional leisure demand
                                                            • Robust Corporate sector demand
1   Pacific Islands includes Bali and Honolulu.

                                                                                                                                AIR NEW ZEALAND 2020 INTERIM RESULT   13
Challenges in the global cargo market impacted 1H 2020
 performance

  • Overall cargo decline of 9.4%*, excluding
    FX, driven by:
                                                                                                            Volume
        – Load factor declines, particularly in North                                                        down
          America and Asia, partly due to declining                                                          8.1%
          flow of goods between the US and China
        – Moderation of capacity on some parts of the                            Revenue
          network, partially offset by cargo capacity
                                                                                  down
          into new routes
                                                                                  9.4%*
        – Continued intense pricing competition on the
          Tasman as market remains over supplied                                                                Yield
                                                                                                               down
                                                                                                               1.3%

* Reported Cargo revenue decreased 8.5%, inclusive of foreign exchange impact.

                                                                                           AIR NEW ZEALAND 2020 INTERIM RESULT   14
Strong focus on cost initiatives drove an underlying improvement in
1H 2020 CASK*
• CASK* improvement of 0.5%
        − Reported CASK increased 0.7%, primarily due to increased costs associated with maintenance for
          third parties, which is offset by a corresponding increase in operating revenue
        − $59 million in efficiencies and economies of scale
                   11                               CASK*
                                         decreased 0.5%
                        10.04                                  0.21         0.10                     0.14              10.11
                   10

                                        (0.26)                                          (0.12)
    CASK (cents)

                   9

                   8

                   7
                        DEC 2018      ECONOMIES                PRICE     THIRD PARTY   FUEL PRICE    FOREIGN           DEC 2019
                         CASK        OF SCALE AND                        MAINTENANCE                EXCHANGE            CASK
                                     EFFICIENCIES
* Excluding fuel price movement, FX and maintenance for third parties.

                                                                                                            AIR NEW ZEALAND 2020 INTERIM RESULT   15
Robust operating cash flow and financial resilience in a
     challenging environment
     Operating cash flow
     ($ millions)
                                                                                     •      On a comparable basis1, operating cash flow has declined
          541                                                       534
                                       479            475                                   11% to $423 million
                        376
                                                                                           − Includes one-off cash outflow of ~$55 million related to the pre-
                                                                                             purchase of certain engine parts
                                                                                           − Reported operating cash flow of $534 million

          Dec           Dec           Dec            Dec          Reported
                                                                                     •      Cash on hand of $1.0 billion, down 4.9% from June 2019
          2015          2016          2017           2018           Dec
                                                                   2019              •      Stable outlook Baa2 rating from Moody’s
    Interim dividend declared
    (cents per share)
                                       11.0           11.0          11.0
                                                                                     •      Gearing of 54.3%2, an increase of 2.6 percentage points
          10.0          10.0
                                                                                            from 1 July 2019, driven by continued investment in fleet

                                                                                     •      Fully imputed interim dividend of 11.0 cents per share,
                                                                                            consistent with the prior period
          Dec           Dec            Dec           Dec            Dec
          2015          2016           2017          2018           2019
1   Operating cash flow on comparable basis excludes reclassifications arising under the new leasing standard, NZ IFRS 16.
2   Refer to slide 30 for further information on gearing movements. The net debt calculation has changed this year following the Group’s adoption of NZ IFRS 16 from 1 July 2019.

                                                                                                                                              AIR NEW ZEALAND 2020 INTERIM RESULT   16
Fleet investment update
Actual and forecast aircraft capital expenditure*
         1,000
                                                         Forecast    Actual                      • Forecast investment of $1.5 billion in aircraft and
              800                                                                                  associated assets through to 2023, including the
              600
                                                                                                   first Boeing 787-10 aircraft
 $ millions

                                                                                                 • Assumes NZD/USD = 0.65
              400
                                                                                                 • Timing of forecast expenditure has shifted with
              200
                                                                                                   the delay in the arrival of 4 domestic NEOs**
                0
                    2015   2016   2017   2018   2019   2020   2021    2022    2023

       Aircraft delivery schedule (as at 31 December 2019)

                                                                                       Number in          Number                     Delivery Dates (financial year)
                                                                                     existing fleet       on order              2H 2020             2021            2022            2023
                                                  Boeing 787-10                                      -            1***                     -               -               -              1
       Owned fleet on order                       Airbus A320/A321 NEOs                             6             7***                     -              1               4               2
                                                  ATR72-600                                        27                2                     1              1                -              -

       Leased aircraft****                        Airbus A320/A321 NEOs                             5                 -                    -               -               -              -

* Includes progress payments on aircraft.                                                *** Does not reflect seven Boeing 787-10 and two A321 NEO aircraft on order for expected delivery from 2024.
** Two aircraft have been delayed from 2021 to 2022, and two from 2022 to 2023.          **** Leased aircraft will be returned to the lessor at the end of the lease term.

                                                                                                                                                  AIR NEW ZEALAND 2020 INTERIM RESULT         17
AIR NEW ZEALAND 2020 INTERIM RESULT
We are adjusting our business to reflect demand softness across a
   number of markets following the outbreak of Covid-19

                                                 Asia                   Tasman/Pacific Islands*                               Domestic

                            - Softer inbound demand across Asia to      - Weaker demand on Tasman routes          - Domestic network impacted from
                                          New Zealand                     following China travel restrictions        Covid-19 related cancellations
  Demand                          - Outbound demand to Asia             - Pacific Islands demand remain solid        (inbound travel with intra-New
                                                                                                                          Zealand itineraries)
environment                    destinations has reduced substantially
                             - Cargo impact from reduced demand
                                    and capacity reductions
                              - Total Asia capacity decline of ~17%      - 3% targeted capacity reductions,     - Overall domestic capacity reductions
                                          from Feb to Jun                   focused on services to Sydney,              of ~2% from Mar to Apr
                                                                          Melbourne and Brisbane across Mar
                              - Temporary suspension of Shanghai                                                   - Reductions focused on leisure
                                                                                       to May
    Air New                    services from Jan through to late Mar                                                destinations of Christchurch and
    Zealand                                                             - Reallocated efficient Boeing 787-9         Queenstown which have seen
                                 - Temporarily suspending Seoul
                                                                           aircraft from lower demand Asia                   greatest impact
    actions                          services from Mar to Jun
                                                                              routes to Honolulu and Bali
                                                                                                                  - Increasing market development
                                - Additional capacity adjustments
                                                                          - Increasing market development            activities to stimulate demand
                                  across Asia, primarily focused on
                                                                             activities to stimulate demand
                                            Hong Kong
*Pacific   Islands includes Bali and Honolulu.

                                                                                                                 AIR NEW ZEALAND 2020 INTERIM RESULT   19
Revised capacity outlook reflects actions taken to mitigate
impact of slower demand from Covid-19
                                                                           Full year           Previous
                                                  1H 2020    2H 2020
    Sector                                                                   2020            2020 capacity
                                                  capacity   capacity                            plan1
                                                                           capacity

    Domestic                                       (2.4%)    (1%) - flat   (1%) - (2%)         (2%) - (3%)

    Tasman &
                                                   +0.3%     +0.5% - 1%    flat - +1%            +2% - 3%
    Pacific Islands2

    International
                                                   +5.8%     +2% - 3%      +3% - 4%              +7% - 8%
    Long-haul

    Group                                          +2.8%     +1% - 2%      +1.5 - 2.5%           +4% - 5%

1   Prior to the outbreak of Covid-19.
2   Pacific Islands includes Bali and Honolulu.
                                                                                         AIR NEW ZEALAND 2020 INTERIM RESULT   20
Fuel cost outlook and sensitivities for the remainder of 2020

2020 Fuel cost outlook
                                                                                                        2H 2020 Fuel Cost1 sensitivity (inclusive of hedging)
                      1,400                                                                                             620
                                                            1,271 ~1,2502
                      1,200

                                                                                                                        600

                                                                                          NZD Cost of Fuel (millions)
                      1,000
       NZD millions

                       800
                                                                                                                        580
                              649 656         622
                                                    ~590
                       600

                       400                                                                                              560

                       200

                                                                                                                        540
                         0                                                                                                    $55   $60              $65               $70          $75
                                1H                 2H           FY                                                                        Singapore Jet (USD/barrel)

                                     2019   2020    2020E

1   Assumes an average jet fuel price of US$65 per barrel for the second half of the 2020 financial year and a NZD/USD rate of 0.65.
2   Assumes an average jet fuel price of US$72 per barrel for the full 2020 financial year.

                                                                                                                                                  AIR NEW ZEALAND 2020 INTERIM RESULT   21
2020 Outlook

     While the situation is uncertain, based on our current assumptions of lower demand
        as well as the benefit of the announced capacity reductions and lower jet fuel
      prices, the airline currently expects a net negative impact to earnings in the range
                       of $35 million to $75 million as a result of Covid-19.

       At the midpoint of the estimated range above, which is approximately $55 million,
       the airline is targeting earnings before other significant items and taxation to
                 be in a range of approximately $300 million to $350 million1.

       The airline will provide an update to this guidance should the current assumptions
                                        materially change.
1   Assuming jet fuel prices remain at US$65 per barrel for the remainder of the year and excludes the impact of NZ IFRS 16.

                                                                                                                               AIR NEW ZEALAND 2020 INTERIM RESULT   22
AIR NEW ZEALAND 2020 INTERIM RESULT
Supplementary
slides

                AIR NEW ZEALAND 2020 INTERIM RESULT
Fuel cost movement

                                                                            $28 million
                                                           (4%)        effective decrease
                                                                           in fuel price
               800

                                  15                                                20
                                                                  46
               600     649                                                                            656
                                              (74)            Dec 2019
                                                             hedge loss of
  $ millions

                                           Decrease in           $22m
               400                                                vs
                                          jet fuel price
                                          US$87 to US$76      Dec 2018
                                            per barrel          hedge
                                                             gain of $24m
               200

                0
                      DEC 2018   VOLUME    UNDERLYING       NET HEDGING            FX               DEC 2019
                     FUEL COST               PRICE                              MOVEMENTS          FUEL COST

                                                                                            AIR NEW ZEALAND 2020 INTERIM RESULT   26
Hedging update

Fuel hedging*                                                Foreign exchange hedging
• 91% of estimated volumes hedged in 2H                      • 2H 2020 US dollar is 88% hedged at a rate
  2020                                                         of 0.6617

• 56% of 1H 2021 estimated volumes                           • 1H 2021 US dollar is 50% hedged at a rate
  currently hedged                                             of 0.6472

* Based on fuel hedging disclosure as at 21 February 2020.

                                                                                    AIR NEW ZEALAND 2020 INTERIM RESULT   27
Projected aircraft in service and fleet age

Aircraft fleet age in years
(seat weighted)

                                                                             7.8             8.0
    7.5
                  7.0
                                 7.5
                                                 7.1                 7.1                                                        2020          2021            2022
                                                                                                     Boeing 777-300ER                   7             7            7
                                                                                                     Boeing 777-200ER                   8             8            7
                                                                                                     Boeing 787-9                      14            14            14
                                                                                                     Airbus A320                       22            20            16
                                                                                                     Airbus A320/A321 NEO              11            12            16
                                                                                                     ATR72-600                         28            29            29
                                                                                                     Bombardier Q300                   23            23            23

                                                                                                    Total Fleet                    113           113           112
   2016           2017          2018 *           2019 *              2020    2021            2022

                                         Historical       Forecast

* Excludes short-term leases which provide cover for the global Rolls-Royce engine issues.

                                                                                                                        AIR NEW ZEALAND 2020 INTERIM RESULT   28
Impact of new lease accounting standard (NZ IFRS 16)

Income statement impact

                                   Dec 2018                                                   Dec 2019                 Notes
                                   $M                                                         $M

Rental and lease expense                 122           Depreciation expense                            111            Net movement of $6 million comprised of:

                                                       Interest expense                                 14            NZ IFRS 16 methodology changes                               3

                                                       Other expenses                                    3            Underlying changes to lease portfolio                        3

Total income statement                    122          Total income statement                          128                                                                         6

Statement of cash flows impact
                                   Dec 2018                                                   Dec 2019                 Notes
                                   $M                                                         $M
Cash flows from                    111                  Cash flows from financing             111                      This represents the reclassification of the principal
operating activities                                    activities                                                     portion of operating lease payments

 Note: For details on the transitional impact of NZ IFRS 16 on the balance sheet, refer to Note 8 of the Group’s Interim Financial Statements.

                                                                                                                                             AIR NEW ZEALAND 2020 INTERIM RESULT   29
Reconciliation of gearing movements

                                                                 Reported             Fair value           Adjusted            Impact of        Restated          Reported
                                                                30 Jun 2019            hedge              30 Jun 2019         NZ IFRS 16        1 Jul 2019       31 Dec 2019
                                                                                     adjustment

    Net Debt ($M)                                                  2,517*                   -                2,517*               (384)            2,133            2,389
    Equity ($M)                                                     2,089                 (97)                1,992                  -             1,992            2,014
    Gearing (%)                                                      54.6*                                     55.8*                                51.7             54.3
                                                         Impact of bringing operating leases on balance sheet:

                                                                  $862m       Operating lease liabilities

                                                                          Aircraft lease commitments for
                                                                $(1,246m)     the next twelve months
                                                                          multiplied by a factor of seven

* Includes capitalised off-balance sheet aircraft lease commitments at 30 June 2019.
1 Refer to Note 8 in the Group’s 2020 Interim Financial Statements for details of the fair value hedge adjustment and impact of NZ IFRS 16.

                                                                                                                                         AIR NEW ZEALAND 2020 INTERIM RESULT   30
Earnings before other significant items and taxation

                                                                                                        Dec 2019                   Dec 2018                    Full year
                                                                                                              $M                         $M                    estimate
                                                                                                                                                                     $M
      Earnings before taxation (per NZ IFRS)                                                                     139                         211
      Add back other significant items:
             Disestablishment of fair value aircraft hedges1                                                       46                           6                         46
             Reorganisation costs2                                                                                 13                            -                20 - 25
             Gain on sale of airport slots3                                                                           -                          -                      (21)
      Earnings before other significant items and taxation                                                       198                        217
Earnings before other significant items and taxation represent Earnings stated in compliance with NZ IFRS (Statutory Earnings) after excluding items which due to their size or
nature warrant separate disclosure to assist with understanding the underlying financial performance of the Group. Earnings before other significant items and taxation is
reported within the Group’s condensed interim financial statements which was subject to review by the external auditors. Further details are contained within Note 3 of the
Group’s condensed interim financial statements.

1 The     International Financial Reporting Interpretations Committee ("IFRIC") published a new interpretation on the principals of NZ IFRS 9. The interpretation no longer permits
    fair value hedges of underlying United States Dollar aircraft values previously undertaken by the Group. The retrospective application of the interpretation resulted in the
    disestablishment of these hedges.

2   Reorganisation costs relate to the withdrawal of services on the London-Los Angeles route and a two-year cost reduction programme.
3A    gain on sale related to the sale of northern winter Heathrow landing slots (arising from the exit of the London-Los Angeles route) is expected to be recognised in June 2020.

                                                                                                                                          AIR NEW ZEALAND 2020 INTERIM RESULT     31
Financial overview

                                                                                            Dec 2019    Dec 2018    Movement              Movement
                                                                                                  $M          $M         $M                     %
   Operating revenue                                                                           3,015       2,927               88                 3.0%
   Earnings before other significant items and taxation                                          198         217              (19)               (8.8%)
   Earnings before taxation                                                                      139         211              (72)             (34.1%)
   Net profit after taxation                                                                     101         150              (49)             (32.7%)
   Operating cash flow                                                                           534         475               59                12.4%
   Cash position*                                                                              1,003       1,055              (52)               (4.9%)
   Gearing**                                                                                  54.3%       51.7%                   -             2.6 pts
   Ordinary dividends declared***                                                            11.0 cps    11.0 cps                 -                       -

* Comparative is for 30 June 2019.
** Comparative information is at 1 July 2019, the Group’s transition date for NZ IFRS 16.
*** Dividends are fully imputed.

                                                                                                                    AIR NEW ZEALAND 2020 INTERIM RESULT       32
Group performance metrics

                                                  Dec 2019    Dec 2018              Movement*

 Passengers carried (‘000s)                           9,040       8,895                          1.6%

 Available seat kilometres (ASKs, millions)          23,741      23,084                          2.8%

 Revenue passenger kilometres (RPKs, millions)       20,021      19,244                          4.0%

 Load factor                                         84.3%       83.4%                         0.9pts
 Passenger revenue per ASKs as reported
                                                       10.8        10.8                          0.3%
 (RASK, cents)
 Passenger revenue per ASKs, excluding FX
                                                       10.8        10.8                        (0.1%)
 (RASK, cents)

* Calculation based on numbers before rounding.

                                                                    AIR NEW ZEALAND 2020 INTERIM RESULT   33
Domestic

                                                  Dec 2019    Dec 2018              Movement*

 Passengers carried (‘000s)                           5,787       5,755                          0.6%

 Available seat kilometres (ASKs, millions)           3,506       3,591                        (2.4%)

 Revenue passenger kilometres (RPKs, millions)        2,973       2,970                          0.1%

 Load factor                                         84.8%       82.7%                         2.1pts
 Passenger revenue per ASKs as reported
                                                       24.3        22.5                          7.7%
 (RASK, cents)
 Passenger revenue per ASKs, excluding FX
                                                       24.2        22.5                          7.6%
 (RASK, cents)

* Calculation based on numbers before rounding.

                                                                    AIR NEW ZEALAND 2020 INTERIM RESULT   34
Tasman & Pacific Islands1

                                                     Dec 2019    Dec 2018              Movement*

    Passengers carried (‘000s)                           2,111       2,074                          1.8%

    Available seat kilometres (ASKs, millions)           7,093       7,072                          0.3%

    Revenue passenger kilometres (RPKs, millions)        5,852       5,832                          0.3%

    Load factor                                         82.5%       82.5%                                    -
    Passenger revenue per ASKs as reported
                                                           9.7         9.9                        (1.9%)
    (RASK, cents)
    Passenger revenue per ASKs, excluding FX
                                                           9.7         9.9                        (1.5%)
    (RASK, cents)

1    Pacific Islands including Bali and Hawaii.
*    Calculation based on numbers before rounding.

                                                                       AIR NEW ZEALAND 2020 INTERIM RESULT       35
International

                                                  Dec 2019    Dec 2018              Movement*

 Passengers carried (‘000s)                           1,142       1,066                         7.2%

 Available seat kilometres (ASKs, millions)          13,142      12,421                         5.8%

 Revenue passenger kilometres (RPKs, millions)       11,196      10,442                         7.2%

 Load factor                                         85.2%       84.1%                         1.1pts
 Passenger revenue per ASKs as reported
                                                        7.9         8.0                        (0.9%)
 (RASK, cents)
 Passenger revenue per ASKs, excluding FX
                                                        7.8         8.0                        (1.9%)
 (RASK, cents)

* Calculation based on numbers before rounding.

                                                                    AIR NEW ZEALAND 2020 INTERIM RESULT   36
Glossary of key terms

Available Seat Kilometres (ASKs)          Number of seats operated multiplied by the distance flown (capacity)

Cost/ASK (CASK)                           Operating expenses divided by the total ASK for the period

                                          Net Debt / (Net Debt + Equity); Net Debt includes capitalised aircraft operating lease commitments at 30 June
Gearing
                                          2019

                                          Interest-bearing liabilities, lease liabilities less bank and short-term deposits, net open derivatives held in relation
                                          to interest-bearing liabilities and lease liabilities, and interest-bearing assets, plus, for the prior period, net aircraft
Net Debt
                                          operating lease commitments for the next twelve months multiplied by a factor of seven (excluding short-term
                                          leases, which provide cover for Boeing 787-9 engine issues)

Passenger Load Factor                     RPKs as a percentage of ASKs

Passenger Revenue/ASK (RASK)              Passenger revenue for the period divided by the total ASK for the period

Revenue Passenger Kilometres
                                          Number of revenue passengers carried multiplied by the distance flown (demand)
(RPKs)

Yield (referring to Cargo)                Cargo revenue for the period divided by freight tonne kilometres

The following non-GAAP measures are not audited: CASK, Gearing, Net Debt, RASK and Yield. Amounts used within the calculations are derived from the
condensed Group interim financial statements where possible. The interim financial statements are subject to review by the Group’s external auditors. The
non-GAAP measures are used by management and the Board of Directors to assess the underlying financial performance of the Group in order to make
decisions around the allocation of resources.

                                                                                                                               AIR NEW ZEALAND 2020 INTERIM RESULT       37
Find more information about Air New Zealand

Resources

 Investor website: www.airnewzealand.co.nz/investor-centre

 Monthly traffic updates: www.airnewzealand.co.nz/monthly-operating-data

 Quarterly fuel hedging disclosure: www.airnewzealand.co.nz/fuel-hedging-announcements

 Corporate governance: www.airnewzealand.co.nz/corporate-governance

 Sustainability: https://www.airnewzealand.co.nz/sustainability

Contact information

 Email: investor@airnz.co.nz

 Share registrar: enquiries@linkmarketservices.com

                                                                                         AIR NEW ZEALAND 2020 INTERIM RESULT   38
AIR NEW ZEALAND 2020 INTERIM RESULT
You can also read