Better Metlink fares Post implementation review Summary findings
←
→
Page content transcription
If your browser does not render page correctly, please read the page content below
Better Metlink fares
Post implementation review
Summary findings
                             March 2020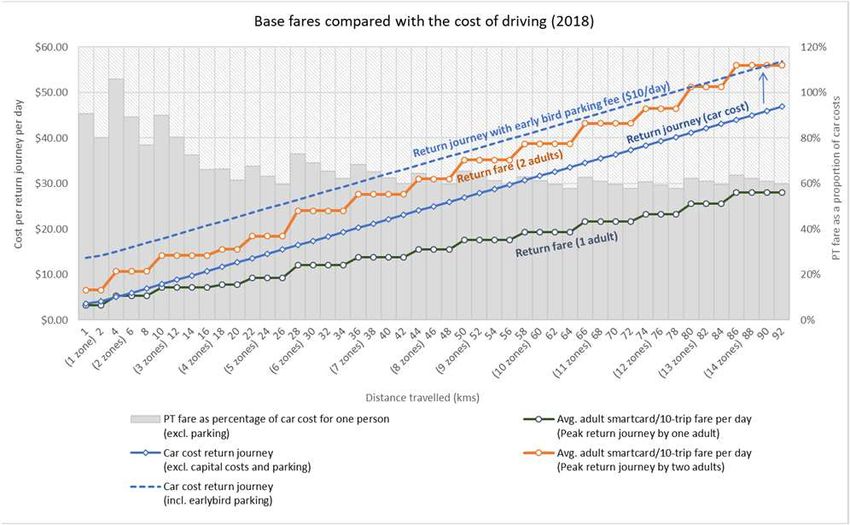
Purpose and scope                                                                          March 2020

Description of changes
•   This report presents summary findings of the Post Implementation Review of the
    Better Metlink Fares changes
•   The Review covers both the ‘fares and ticketing’ components of the Better Metlink
    Fares changes and was guided by the following questions:
     – How well did the fares package perform against expectations for patronage and travel
       behaviour?
     – How well did the fares package perform against expectations for fare revenue and share
       of funding?
     – How successful for customers was the roll-out of ticketing across bus, rail and ferry?
     – How well did the fares and ticketing changes perform against the new policies in the PT
       Plan (concession fares policy and policy to reward target behaviours)?
     – What lessons can we learn for future changes to fares and ticketing?
Background                                                                                  March 2020

Description of changes
•   The Better Metlink Fares package was introduced in July 2018 across the Metlink
    public transport network, with the new bus network and Snapper ticketing roll-out
    in Wellington city.
•   The package was developed through a comprehensive review process that
    included wide-spread public consultation and detailed analysis to provide some
    insight into the likely impacts of the changes.
•   The package was given effect through a variation to the Wellington Regional Public
    Transport Plan (PT Plan) and the introduction of two new policies:
     – Concession fares policy, to improve access to affordable public transport for those most
       dependent on public transport
     – Policy to reward target behaviours, to encourage more frequent use of public transport,
       more off-peak travel and greater use of electronic ticketing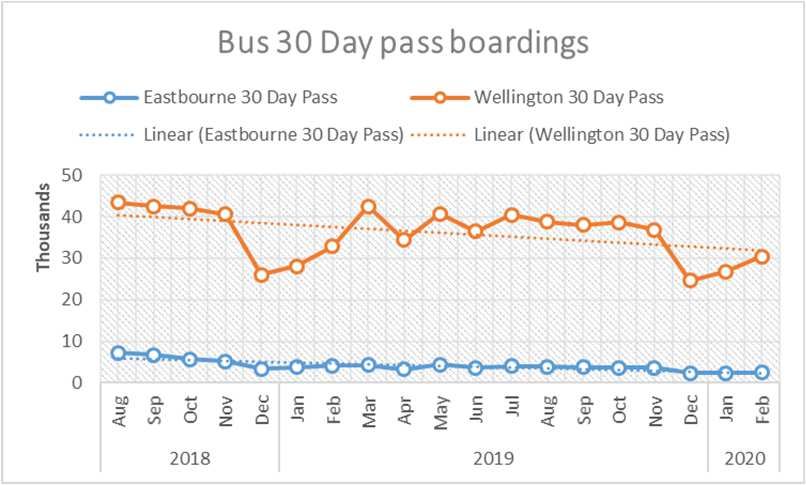
Description of key Better Metlink Fare changes                                    March 2020

•    General 3% fare increase               •   25% off-peak discount
•    25% discount for full-time students    •   Free bus connections to trains with
•    50% accessible discount                    MonthlyPlus pass
•    50% discount for all school children   •   Metlink Explorer day pass, replaces
                                                other day passes
•    25% premium for all cash fares
                                            •   Discontinue school term passes

•    New zone-based tickets                 •   Free bus transfers
•    Discontinue old day passes             •   Snapper on all Metlink buses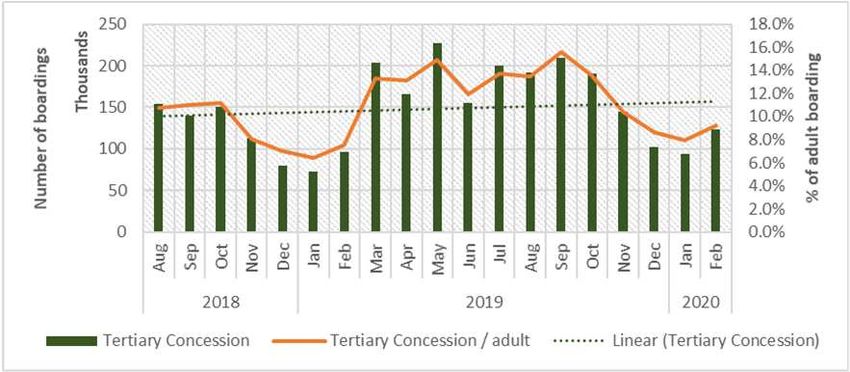
Expected outcomes – combined fares package                                                   March 2020

•   The fare changes represent the first major change to fares in Wellington since 2006.
    Many legacy tickets and fares offered by previous operators needed to be
    discontinued or replaced with Metlink equivalents. The new PT Plan policies needed
    to be given effect. Fares needed to be simplified in readiness for integrated
    electronic ticketing.
•   In response, the fares package aimed to:
     – Create simpler and more consistent fares, concessions and products across all modes
     – Improve affordability for those most dependent on public transport
     – Encourage more off-peak travel to spread the load
     – Encourage greater use of electronic ticketing and less use of cash
     – Enable ‘journey-based’ fares via free bus to bus transfers and a new rail/bus Monthly pass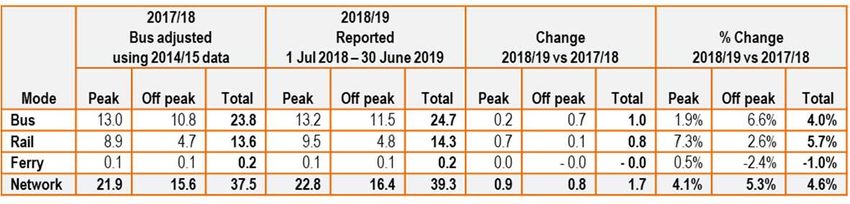
Expected outcomes – patronage and revenue                                           March 2020

•   The Better Metlink Fares package introduced a wide range of new and cheaper fare
    products, as well as a 3% increase to the base (electronic) fare.
•   A 4% increase in patronage (about 1.5m passenger trips) was expected after a year
    of the changes coming into effect. The 25% off-peak discount was expected to
    account for about two thirds of that increase (about 1m passenger trips).
•   The combined cost of these changes was expected to be about $7.8m per annum,
    with expectation that the 3% fare increase would re-coup about $2.1m. The 3% fare
    increase was also expected to keep fares share of public transport funding within the
    target ranges.
•   We expected that about half of all passengers would face a fare increase, less than a
    quarter of passengers would face no change, and the remaining would enjoy a fare
    decrease.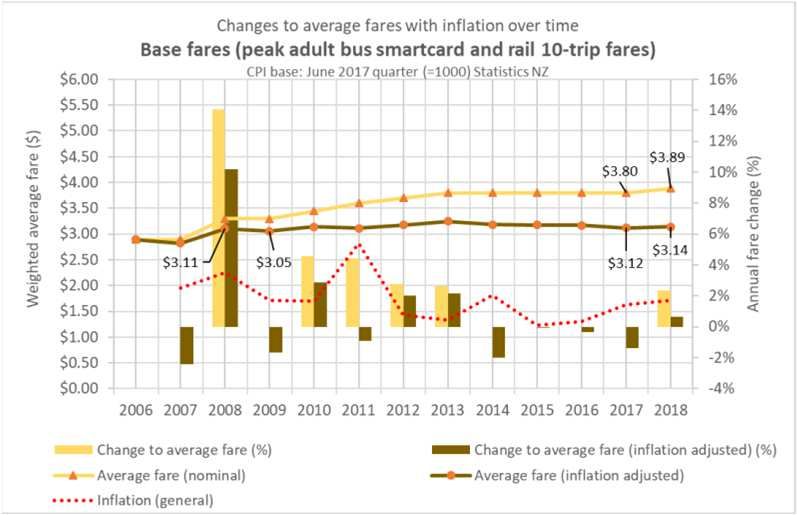
Summary findings                                                                            March 2020

•   The changes appear to have delivered well against the new policy expectations
    (affordability, more frequent use of public transport, more off-peak travel and greater use
    of electronic ticketing).
•   Actual patronage growth (4.6%) was slightly higher than expected (4%). While much of this
    growth can be attributed to fares - natural growth, network changes and improved
    customer experience would have also influenced passenger numbers.
•   Actual revenue impact (-$5.4m) was lower than expected (-$7.8m) due to high peak
    passenger growth on rail and greater uptake of monthly rail passes.
•   Overall, bus passengers benefited most from the fares package, highlighting the
    importance of electronic ticketing to deliver on policy outcomes.
•   For the customer, the rollout of Snapper on bus and new paper ticketing products on rail
    went smoothly.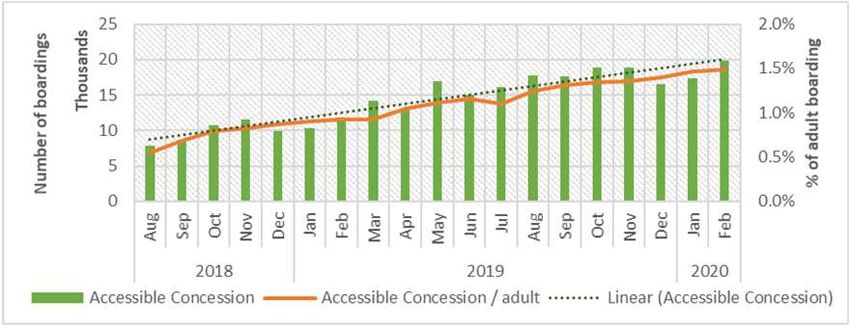
Lessons                                                                                      March 2020

•   Modelling is effective if done well. The methods and modelling tools used to predict the
    effects of the fares changes on patronage and travel behaviour proved to be effective, as
    evidenced by the close correlation between modelling expectations and high level results.
•   Prioritise integrated electronic ticketing. While rail customers were offered fare products
    and discounts priced the same as for bus, the benefits were much easier to realise for bus
    customers due to electronic ticketing. This is particularly true for off-peak travel and
    transfers between bus services.
•   Take a customers-first approach, engage and communicate! Overall there seemed to be
    good public acceptance of the fares changes, including the 3% fare increase. This was likely
    due to the timing and comprehensiveness of the Better Metlink Fares public engagement
    process prior to the changes coming into effect, and the fares component of the ‘On Our
    Way’ customer communications campaign.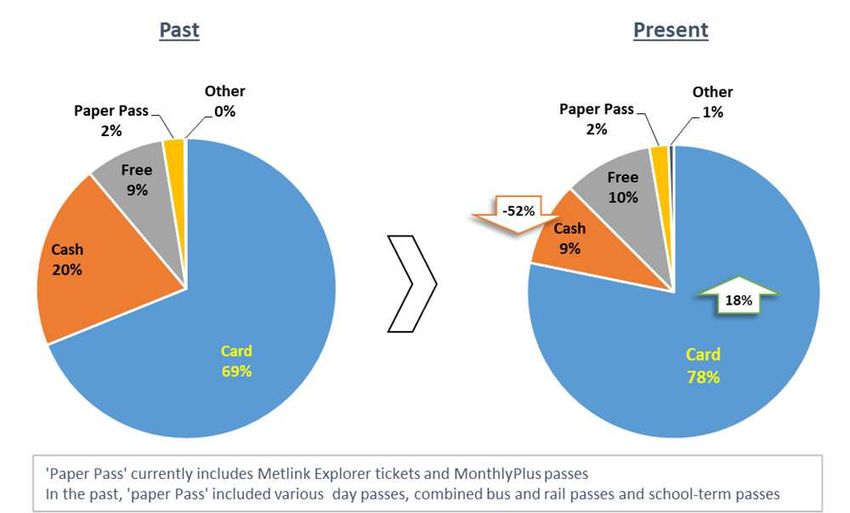
Data and methodology                                                                            March 2020

•   Expectations for patronage and revenue for Better Metlink Fares were based on a
    comprehensive modelling framework, which included detailed elasticity modelling and other
    modelling approaches. The modelling framework was recorded and peer reviewed.
•   Actual figures for patronage and revenue for the 2018/19 year were derived primarily from
    Snapper data on bus, and ticketing sales data on rail (cross-checked with rail on-board
    passenger counts and GWRC financial reports).
•   The level and quality of data generated by Snapper ticketing has resulted in a greater level of
    surety for planning and performance monitoring, than in the past (with multiple ticketing
    systems and limited GWRC access to data). Rail patronage data is limited by paper ticketing
    and more reliant on assumptions.
•   The move to the new Public Transport Operating Model (PTOM) resulted in some structural
    and definitional inconsistencies between the current and past data. Adjustments were
    required to enable better comparison between data sets - for example, removing exempt
    services from old data and aligning definition of time periods.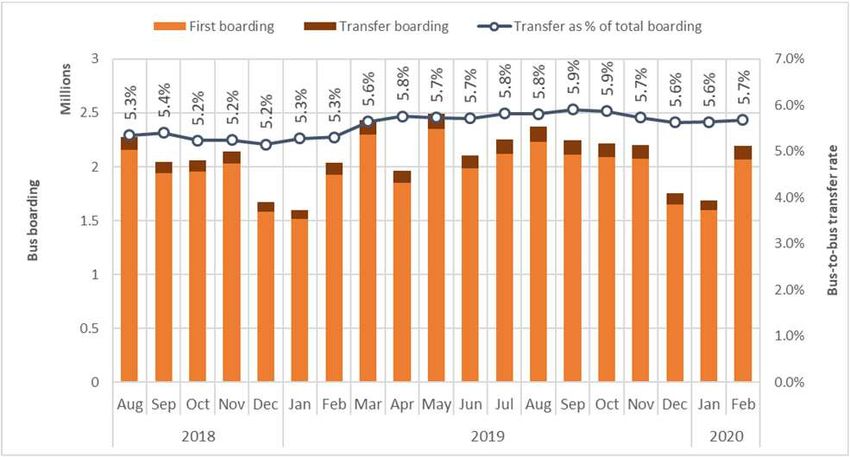
Better Metlink fares
Post implementation review
Additional information
                             March 2020
Expected vs Actual Patronage and revenue March 2020
Key changes Modelled patronage Actual patronage Modelled net revenue Actual net revenue
change (%) change (%) impact ($m) impact ($m)
Free bus transfers +0.4% - -$2.4m -$2.3m
25% off-peak discount +2.6% - -$3.1m -$3.2m
25% tertiary discount +0.2% - -$0.7m -$0.8m
50% accessible discount - - -$0.2m -$0.1m
50% school student discount +1.0% - -$0.7m -$1.4m
25% cash premium -0.6% - +$0.3m +$0.4m
Metlink Monthly Plus +0.9% - -$0.4m +$1.1m
Porirua zone boundary +0.2% - -$0.4m -$0.2m
Other (bus 30 Day pass, penalty revenue) +0.1% - -$0.2m +$0.7m
A general 3% fare increase -0.8% - $2.1m +$2.9m
Net revenue gain from additional boardings - - - +$0.5m
Totals +4.0% +4.6% -$5.7m -$2.5m
Notes:
• Actual change to patronage and travel behaviour appear to have been a combined effect of the fare package and external factors, rather than the individual fare initiatives.
• We know that total patronage has grown by 4.6% and how various payment methods have driven the growth (see next pages). We cannot, however, identify with certainty how each
initiative contributed to growth. For example, growth in off-peak bus boardings may have been a combined effect of extending Snapper card, off-peak and tertiary discounts and free
transfers plus other factors (e.g. additional off-peak bus services, parking policy or fuel price)
• The actual net revenue impacts for individual initiatives slightly overstate the amounts of fare revenue actually lost or gained. This has been due to the method used for estimating
the revenue loss. The sum of understated amounts is $0.5m as in the last row “Net revenue gain from additional boardings” in the table.Bus transfers and off-peak March 2020
Initiative Policy intent Achieved yes/no
Bus to bus transfers • Avoid penalising passengers required to transfer by • Yes – policy intent and outcomes achieved.
the new bus network
(journey-based fare • Higher than expected patronage growth (estimate 750k)
calculation) • Provide consistent user experience across the Metlink
network • Revenue in line with expectations
• Provide an interim step to enable fare integration • Use of electronic ticketing has increased by 18%, with
within mode approximately 78% of bus boardings now using a Snapper card
• Support transition to integrated fares and ticketing by • Note – estimated that only about 0.6% (150k) transfers
providing a viable interim alternative for some required as a result of the new bus network
discontinued legacy passes (e.g. Hutt Commuter 30
Day Pass)
25% off-peak discount • Primary: Encourage a shift from peak to off-peak or • Yes – policy intent and outcomes achieved
shoulder-peak times to spread peak demand and
better utilise off-peak capacity • Revenue in line with expectations
• Supporting: Provide affordable travel option for • Off-peak bus boardings is higher than expected (approx 5.3%) –
transport disadvantaged who are more likely able to likely driven by greater demand for off-peak transfers
adjust their travel to benefit from discounted fare out
of peak hours • Travelling on an off-peak discount on average costs about $2
for adult bus users compared with the $2.65 in the pastTertiary and Accessible concession March 2020
Initiative Policy intent Achieved yes/no
25% discount for full-time • Responding to the sector’s demand for affordable • Yes – policy for more affordable fares and outcomes achieved
tertiary students travel option for tertiary students • Revenue in line with expectations
• Potential to attract students and grow the regional • Patronage in line with expectations - use of tertiary and
economy accessible concession continues to grow, accounting for about
8% of total bus boardings
• Average fare has reduced from $2.35 to $1.96, largely due to off-
peak fare and concessions
50% discount for blind or • Provide access to affordable travel for those who are • Yes – policy intent and outcomes achieved.
disabled passengers, and free most in need and highly dependent on public • Revenue in line with expectations.
travel for accompanying carers transport
• Patronage in line with expectations - and use of tertiary and
• Improve consistency of targeted concessions across accessible concession continues to grow, accounting for about
the network 8% of total bus boardings.
• Average fare has reduced from $2.35 to $1.96, largely due to off-
peak fare and concessionsSchool student concession & cash premium March 2020
Initiative Policy intent Achieved yes/no
50% discount for school • Ensure the discount applies consistently to base • Yes – policy intent and general alignment with expected
students fares across all number of zones travel outcomes achieved.
• Simplify eligibility assessment, validation and • School fares and products are consistently priced and applied.
administration of the concession Eligibility is clear
• Provide more affordable and convenient travel and • At $1.4m, revenue loss is about double what was expected, likely
payment option for children due to the increasing number of school students switching from
• Facilitate the transition to new fares and network the discontinued exempt services and legacy school term passes
to the Metlink services and paying using a Snapper card or the
new 10-trip tickets or MonthlyPlus passes
25% premium for all cash fares • Ensure that cash fares are priced at a premium • Yes – policy intent and outcomes achieved
over base fares to encourage greater use of • Cash premium applied consistently across all zones
electronic ticketing, while taking into account the
needs of the people on low income • Patronage and revenue in line with expectations
• Ensure cash premium applies consistently to base • Use of electronic ticketing has increased by 18%, with
fares across all numbers of zones travel approximately 78% of bus boardings now using a Snapper card –
a significant improvement
• Number of cash tickets on rail and bus has significantly reducedMonthlyPlus and 30-day passes March 2020
Initiative Policy intent Achieved yes/no
Rail monthly passes with • Manage demand for park and ride by • Yes – MonthlyPlus is consistently applied to all lines, and
regional bus connection encouraging commuters to use bus to connect provides a journey based product for rail commuters
(MonthlyPlus) to train instead of driving to stations • Likely to have resulted in some relief for ‘Park and Ride’ as there
• Improve consistency by making the product is evidence of increased use of passes on bus (1.5% now vs 0.5%
available to all across the network in past)
• Provide a viable interim solution while • Revenue (+$1.1m) significantly higher than expectations, but
transitioning to fare capping includes revenue gain from rail component
30 Day passes for Wellington • Provide an interim bus pass to commuters in • Yes – 30 Day passes provide alternative period pass
and Eastbourne bus commuters Wellington City and Eastbourne, where the • As expected, the use of 30-passes has declined considerably due
rail MonthlyPlus passes are not available. to the better value and convenience of using standard Snapper
with free bus to bus transfersTicketing - Snapper electronic and rail paper March 2020
Initiative Policy intent Achieved yes/no
Extension of Snapper as an • Enable the new bus network in Wellington City to • Yes – policy intent and alignment with outcomes achieved
Interim Bus Ticketing Solution operate without penalising those who will need to
transfer • Free transfers have ensured customers not penalised for
additional transfers required from network changes in
• Provide consistent user experience across the Wellington city
Metlink network
• Note – estimated that only about 0.6% (150k) additional
• Provide the type and level of data desirable for required transfers as a result of the new bus network
managing fare revenue, monitoring performance,
accurate planning of services, and the design of • Free transfers have enabled concept of ‘journey-based’ fares to
future ticketing features become the norm for customers
• Support transition to integrated fares and ticketing • Quality and extent of data is significantly enhanced ability to
analyse performance of the bus network
Rail paper ticketing • Simplify and standardise Metlink fares and • Yes - number of rail tickets in circulation (240) now is
products in the lead-up to integrated ticketing and significantly less than the 309 tickets in the past
fare capping
• All period passes and 10-trip tickets now zone-based, allowing
use across all lines
• One further adjustment was required to enable Accessible
Concession customers to purchase 50% single cash tickets for
rail and ferry travel.Key Metrics : patronage growth (1) March 2020
Between July 2018 and January 2020 :
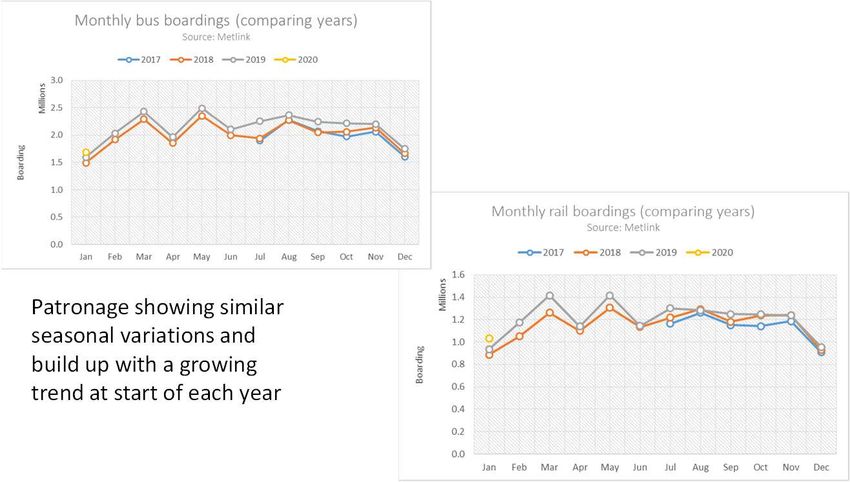
3 million more boardings (8% growth over 19 months): 1 million rail + 2 million busKey Metrics : patronage growth (2) March 2020 • Patronage growth has increased year on year following the fare changes introduced in July 2018 • Patronage reached 40 million in the first quarter of current financial year, with steady growth over the four months prior to March 2020 • Bus patronage has been growing faster than rail and remained steady between October 2019 and January 2020 • Rail patronage growth remains strong with a slight levelling off over the last quarter of 2019 Patronage showing similar seasonal variations and build up with a growing trend at start of each year
Changes to fare revenue and share of funding                                                                            March 2020

• Bus passengers benefited most from reduced fares. Bus fare        • Fares share of funding required to deliver services (excluding
  revenue reduced by about ($5m)                                      network-wide and capital costs) remains above 50% for all
                                                                      modes and network after the fare and network changes
• Rail generated an additional revenue of about $2.5m, offsetting
  the $5m revenue loss on bus network                               • Fares share of funding reduced by less than 1% for bus due
                                                                      to lower bus fare revenue, remained relatively unchanged
• No significant change to ferry fare revenue                         for rail and lowered by about 3.5% for ferry
• Overall, fare package reduced fare revenue by about $2.5m         • Fares share of funding reduced by 0.4% for Metlink network
  ($3m less than the budget of $5.5m allocated for 2018/19)           but remained within the expected target range of 55% - 60%
Key Metrics: drivers of patronage growth March 2020 Bus patronage growth between 2017/18 and 2018/19 Rail patronage growth between 2017/18 and 2018/19 • 4% (0.96m) growth largely driven by more users making free transfers • 5.7% (0.77m) growth largely driven by greater use of prepaid tickets • Shift from cash to smartcard was about 10% across the bus network • 10-trip tickets grew rail boadings by 3.2% • Only 0.6% of total bus boardings are transfers required by network • Monthly passes grew rail boadings by 2.8%
Key Metrics : changes to methods of payment                                                                           March 2020

Bus                                                                        Rail
• Growing number of passengers using Snapper card since July 2018          • Rail network shows declining cash use while growing number
                                                                             of pre-paid 10-trip tickets and monthly passes
• Use of cash has been halved in 2018/19
                                                                           • Growth likely encouraged by new products and concessions
• Free travel (SuperGold, Child under 5, Parking wardens, Maori Wardens,
  Police, Metlink staff) has increased slightly
• Improved access to affordable travel has been realised with growing
  number of bus users benefiting from reduced fares on Snapper card
Key Metrics : bus to bus transfers (1) March 2020
• In 2018/19 about 5.5% (1.4m) of all bus boardings were transfers to a next bus within 30 minutes (0.75m growth compared with past)
• The growth in transfer boardings (0.75m) accounted for about 78% of the 0.96m (or 4.6%) growth in total bus boardings
• Only 0.6% (0.15m) of total bus boardings were transfers made by passengers required by the new bus network to change buses
• The remaining 4.9% (or 1.2m) were transfers made by passengers who chose to transfer to pay less for their journey
Transfers as a proportion of all bus boardings in the past (2014-15) vs present (2018-19)Key Metrics : bus to bus transfers (2) March 2020
• In 2018/19, majority of bus-to-bus transfers (76.7%) were in
Wellington City followed by Porirua (15.6%)
• Most of the total bus-to-bus transfers in Wellington City (about 1m)
were made by passengers who chose to transfer
• The remaining bus-to-bus transfers in Wellington City (about 0.15m)
were transfers required by the network
• Bus-to-bus transfers continue to grow – showing 8% growth between
July 2019 and February 2020 (average 1% per month)
• Off-peak has higher number of transfers than peak
• People on Accessible Concession make more transfers than othersKey Metrics : peak vs off-peak travel (1) March 2020
• Definition of off-peak was changed to align with SuperGold off-peak times – improving
consistency and ease of administration of fares and tickets across the network
• In 2018/19, about 47% of all bus boardings and 33% of rail boardings were off-peak
• The share of off-peak share of boardings (Feb 19 to Feb 20) has grown from 43.7% to
48.1% while peak share of boardings has declined proportionally from 56.3% to 51.9%
• Trend suggests off-peak capacity is now better utilised with growing off-peak travel,
while peak growth has most likely been constrained by ongoing capacity issuesKey Metrics : peak vs off-peak travel (2) March 2020
• Network-wide growth in off-peak travel (5.3%) was higher than peak (4.1%)
• By mode, growth in off-peak travel was higher for bus (6.6%) than rail (2.6%)
• Rail network shows more peak growth (7.3%) than off-peak
• 74% of off-peak bus boardings are in Wellington City and largely made by adults
• The new rail Off-peak 10-trip tickets have been used more than the single-trip off-
peak tickets in the past showing more off-peak train travel
Bus
Bus
RailKey Metrics : Use of MonthlyPlus pass (bus and rail)
March 2020
MonthlyPlus pass:
• A new monthly pass was introduced providing rail travel with free bus connections between zone 4 and outer zone on the pass. Can be
used on any rail line. Adult and child versions available.
• Mostly used by adult commuters in Lower Hutt. Child version had a big uptake by school students in Porirua, where no combined bus and
rail pass was available in the past.
• Mostly used on rail (about 38% of all rail boardings) but also accounts for about 1.5% of total bus boardings, an increase compared to past
estimate (about 0.5% of total boardings).
• Compared with 2017/18, demand for monthly passes has grown by about 6%.
Greater uptake by
adults
Greater uptake by
school students
unintended outcome
needing actionKey Metrics : Use of 30-day bus pass March 2020 30-day bus pass (Wellington City and Eastbourne): • Two 30 Day passes were retained in response to concerns by bus commuters and Wellington City Council about equity between bus and rail during consultation on “Better Metlink Fares”. • As expected, the use of 30-day passes has declined significantly (about 45%). The decline is due to the improved value and convenience that free bus-to-bus transfers provide when using the standard stored value Snapper product. Use is continuing to decline. • The pass is used mostly in Wellington City (90% are Wellington City 30-day passes) and for longer distance travel involving 3 or 2 zones (79%). • Wellington 30-day pass is used slightly less during off-peak (45%) than peak (55%), while Eastbourne commuters have used their pass largely during peak hours (67%)
Key Metrics : impact of new concessions                                                   March 2020

• New concessions included:
      – an all-time 25% discount for full-time tertiary students
      – a 50% discount for Total Mobility card holders and members of the Blind Foundation
        with free travel for an accompanying carer
      – a standard 50% discount for school students (was variable in the past)
• 36% of bus boardings benefited from a concession compared with 18% on rail
• Boardings on Accessible Concession is growing faster than tertiary concession
• Child concession has been mostly used during peak than off-peak, while other
  concessions are largely used during off-peak than peak

                       Bus and rail users’ share of total boardings

                                        Bus       Rail
Key Metrics : changes to fare levels March 2020
• 35% of bus and rail boardings have experienced a reduced fare (higher than expected 28%)
Actual
• 47% of bus and rail boardings have experienced a fare increase (less than expected 50%)
• 17% of bus and rail boardings have remained unchanged (less than the expected 21%)
• 70% of rail boardings and less than 30% of bus boardings have been affected by 3% fare
increase (less than expected)
• The significant difference between bus and rail highlights importance of integrated
electronic ticketing for equitable distribution of benefits
ExpectedKey Metrics : affordability March 2020 • Comparing the changes to fares over time relative to the changes to general consumer price index (CPI) shows average base fare has been flat since the fare zone system was introduced in 2006 • The growth in average base fare over five years has been about half of the growth in general cost of living and income • Excluding parking fees, base fares are on average 60% cheaper than driving a car for longer distance journeys. Including an average early bird parking cost of $10/day makes public transport a more cost-effective alternative for private car
User experience                                                                                             March 2020

Rollout of Snapper provided improved user experience and operational outcomes:
• Users have benefited more from the concessions and reduced fares, highlighting importance of electronic ticketing to
  deliver policy outcomes (nearly half of bus passengers experienced a fare reduction)
• Growing uptake of cards indicates an improved user experience and provides more flexibility to change fares, respond
  to operational disruptions and offer occasional promotional fares
• Taking inflation into account, users now have access to more affordable travel options

The transition to new fares and ticketing was relatively seamless for customers despite wider
operating issues at the time:
•   Low levels of enquiries and complaints relating to fares and ticketing to Metlink, its operators and Snapper
•   Achieved by strong support from ticketing providers and operators and a major communications campaign
•   Concerns raised by users and operators relate mostly to paper-based ticketing on rail, which cannot be fully resolved
    until the integrated electronic ticketing is in place
Transition and communications March 2020
Transition requires a complex public communications campaign with a large amount of change
happening at the same time:
• Overall there were approx. 250 separate communications (includes bus and rail)
• Messages about where to catch, where it goes, costs of tickets across three rollouts
• Customer segmentation campaign with strong focus on pushing people to Metlink website and app
Significant development and implementation was required from the ticketing provider:
• New on-board devices required with lead times at same time new operators were setting up new fleets
• Snapper rollout and conversion was smooth and issues such as refunds fixed quickly
• Successfully built and managed the portal for tertiary concessions
• Snapper provides flexibility to change fares, respond to operational disruptions and offer occasional
promotional faresYou can also read