FY 2020 Results Presentation - Milan, March 10th 2021 - Prada Group
←
→
Page content transcription
If your browser does not render page correctly, please read the page content below
FY 2020
Results Presentation
    Milan, March 10th 2021
Agenda
Patrizio Bertelli – CEO
Business update

Alessandra Cozzani – CFO
FY-2020 Financial Review

Lorenzo Bertelli – Head of Marketing and Head of CSR
Marketing and Communication update

Carlo Mazzi – Chairman
Outlook

Q&A Session

         FY 2020 Results Presentation                  March 10th 2021   2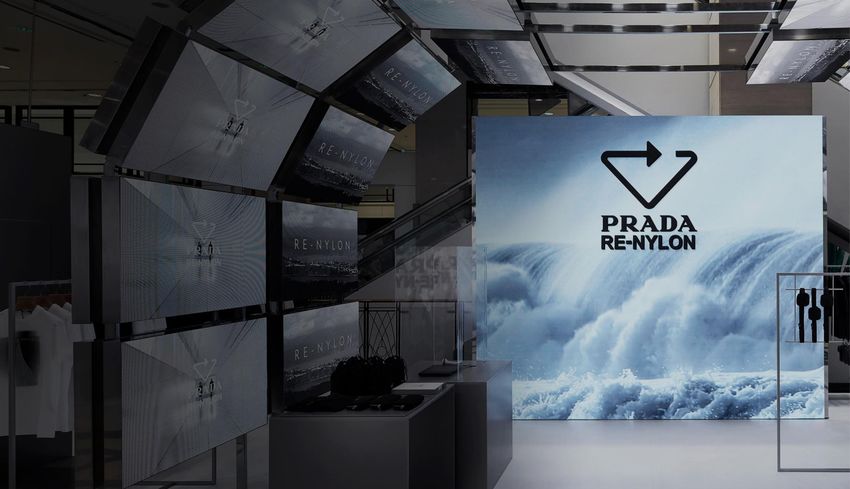
Agenda
Patrizio Bertelli – CEO
Business update

Alessandra Cozzani – CFO
FY 2020 Financial Review

Lorenzo Bertelli – Head of Marketing and Head of CSR
Marketing and Communication update

Carlo Mazzi – Chairman
Outlook

Q&A Session

         FY 2020 Results Presentation                  March 10th 2021   3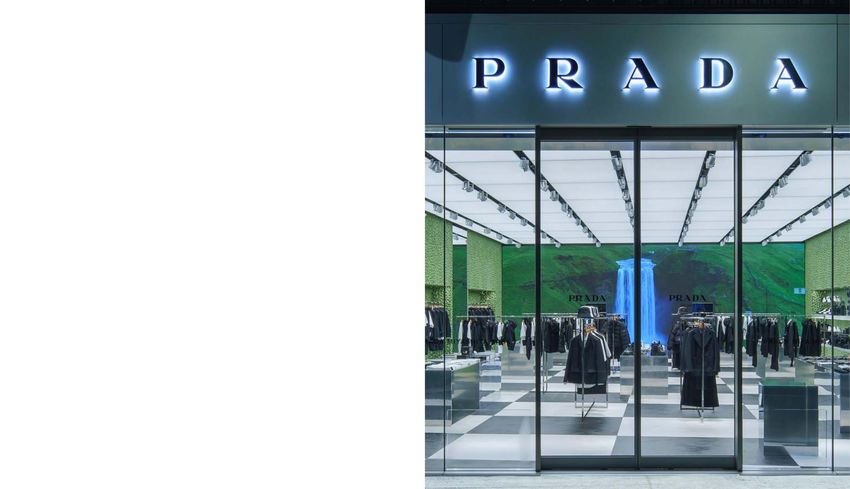
Good execution in a challenging environment
                                   H2 performance returning to pre-Covid levels

Prada Group proved to be very resilient in this unprecedented crisis

Ensured safe environment for employees and customers in different
phases of lockdown worldwide

Sequential improvement in Retail trend throughout the year

Efficient cost containment plan

Active and flexible management of supply chain, avoiding excess
inventory

Capex restricted to strategic projects

Sharp improvement in EBIT in H2, enough to fully offset the
operating losses of H1

Strong operating Cash flow generation

Significant improvement in the Net Financial Position

           FY 2020 Results Presentation                                           March 10th 2021   4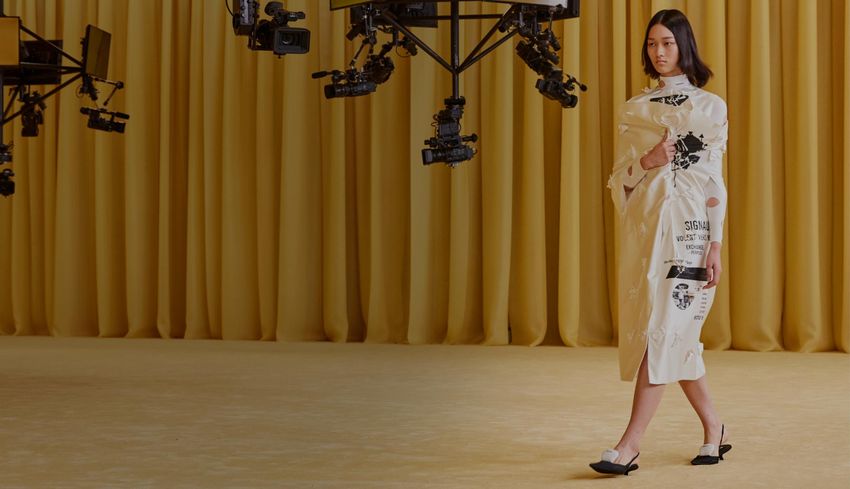
Focus on retail and brands.com
                   Effective retail distribution network and focus on local clientele

Continued brand elevation supported by
strategic decisions
• Discount termination
• Wholesale rationalisation continued

Improvement in Retail trends seen across all
geographies despite ongoing restrictions
• Growing sales from local consumption reaching
  double digit in H2

Outstanding e-commerce growth supported by
powerful global logistics platform

Focus on a dynamic and appealing
omnichannel experience
• Roll-out of ~ 80 pop up and special in store
  installations (of which ~ 50 in H2) fully
  integrated with digital campaigns

           FY 2020 Results Presentation                                       March 10th 2021   5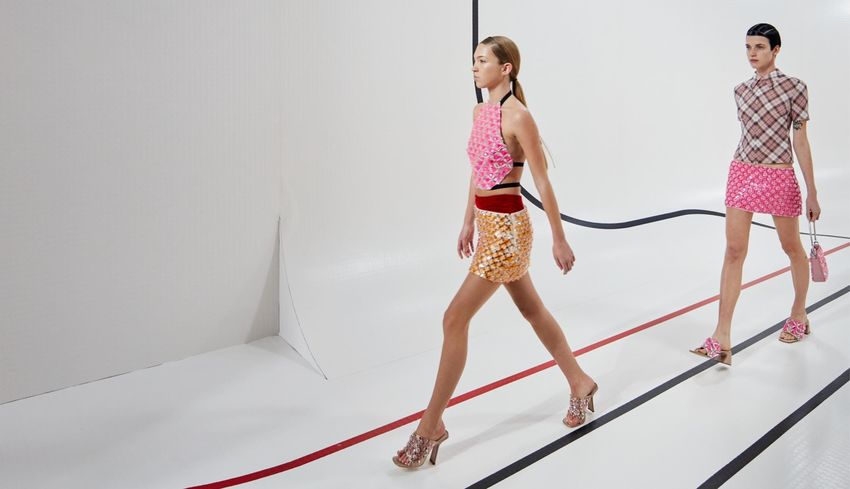
Brand value
                                        Continuous investment delivering growth

Group confirmed as a creative and industry pioneer

Positive momentum across brands, embodying
contemporary values while remaining faithful to
their DNA

Raf Simons appointment as co-designer confirms
the independent and innovative vision of the Group.
The shows were highly appreciated, with excellent
reception for new collections in the stores

Group’s investment in digital communication
leveraged successfully

Continuously connecting with our consumers via
innovative marketing and cultural initiatives

         FY 2020 Results Presentation                                             March 10th 2021   6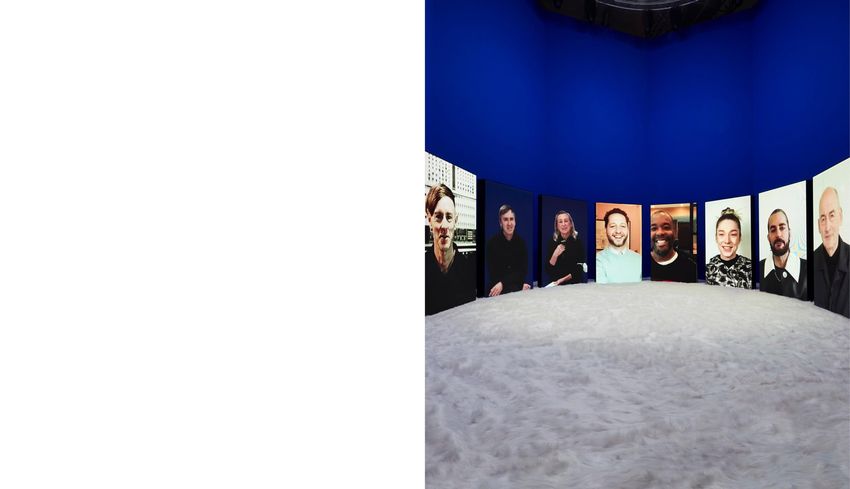
Agenda
Patrizio Bertelli – CEO
Business update

Alessandra Cozzani – CFO
FY 2020 Financial Review

Lorenzo Bertelli – Head of Marketing and Head of CSR
Marketing and Communication update

Carlo Mazzi – Chairman
Outlook

Q&A Session

          FY 2020 Results Presentation                 March 10th 2021   7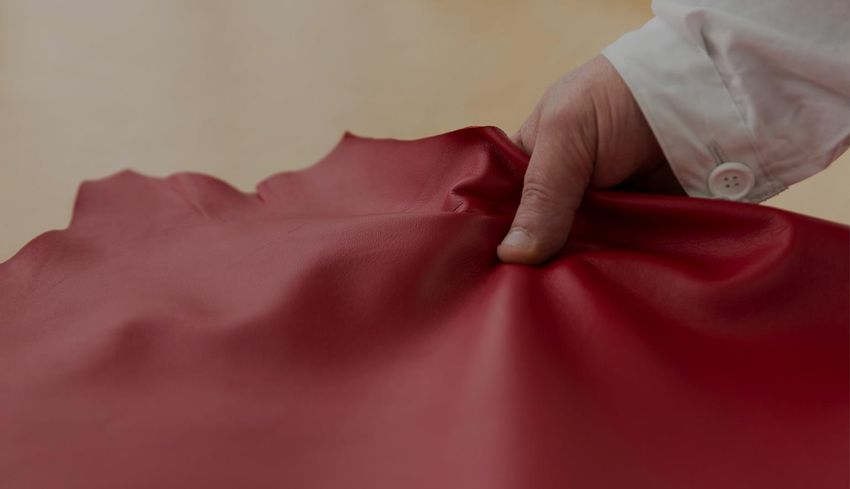
Condensed P&L
                                                    Back to profitability

€m                                                                FY-2020                          FY-2019

Net Revenues                                              2,423             100%        3,226                100%
COGS                                                      -679              -28,0%       -906                -28.1%
Gross Margin                                              1,743             72.0%       2,320                71.9%
Selling                                                  -1,143             -47.2%      -1,470               -45.6%
Advertising & Promotion                                   -207              -8.5%        -231                -7.2%
Design and Product Development                            -102              -4.2%        -127                -3.9%
G&A                                                       -154              -6.8%        -184                -5.7%
Operating expenses                                       -1,607             -66.3%      -2,013               -62.4%
EBIT before selling expenses of the closed stores         136               5.6%
during lockdowns
Selling expenses of the closed stores during              -116              4.8%
lockdowns
EBIT                                                       20               0.8%         307                 9.5%
Total Financial expenses                                   -72              -3.0%         -72                -2.2%
EBT                                                        -52              -2.1%        235                 7.3%
Income Taxes                                               -3               -0.1%         23                 0.7%
Minority Income                                            0                0.0%           2                 0,1%
Group Net income                                           -54              -2.3%        256                 7.9%

                  FY 2020 Results Presentation                                       March 10th 2021                  8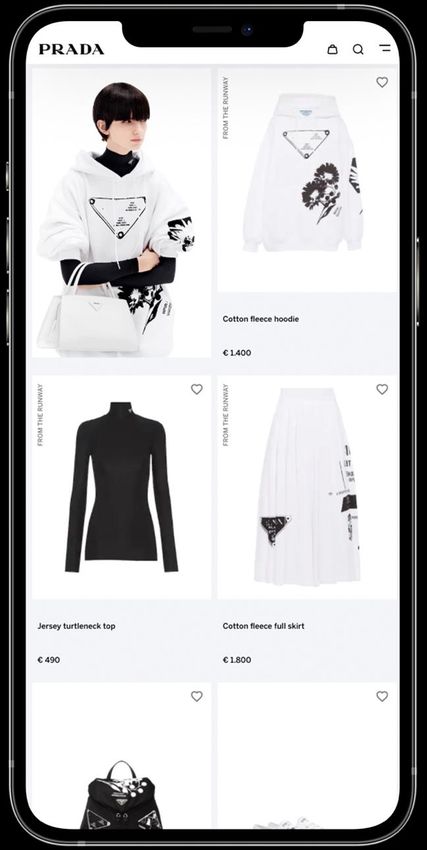
Condensed Balance Sheet and Cash flow
                                                Strong balance sheet

€m                                                                     31 Dec 2020                31 Dec 2019
Right of use                                                              2,054                      2,363
Non current assets (excl deferred tax assets)                             2,506                      2,671
Net operating working capital                                             667                        703
Other current assets / (liabilities), net                                  26                         -6
Other non current assets / (liabilities), net                              42                         79
Net invested capital                                                      5,296                      5,809
Consolidated shareholders’ equity                                         2,850                      2,989
Net financial position (surplus) / deficit                                311                        406
Long term lease liability                                                 1,730                      2,006
Short term lease liability                                                404                        410
Equity + Net Financial position                                           5,296                      5,809
Operating Cash flow                                                       262                        362
Capex                                                                     122                        302
Net Operating Working Capital / Sales                                     28%                        22%
Debt / Equity                                                             11%                        14%

                 FY 2020 Results Presentation                                   March 10th 2021                 9
Net sales by Channel
Progressive recovery across the year
DFS
% change same FX H2 20 FY 20 2%
H1 20 Wholesale
9%
Retail -32% -6% -18%
Wholesale -71% -20% -49%
Total -40% -8% -24%
Retail
89%
Retail
• Q4 retail trend improving vs. Q3 notwithstanding a second wave of lockdown in November-December
• October and December retail trend back to pre-pandemic level
• Sharp acceleration of the online business (>+200% in FY-20)
• 633 DOS end of 2020, 12 additions / 20 closures in 2020
Wholesale
• Continued rationalization process in H2 (-20%)
FY 2020 Results Presentation March 10th 2021 10Retail sales trend
Sequential improvement in H2
Retail sales organic growth %
0%
Q1-20 Q2-20 Q3-20 Q4-20
-5%
-10%
-15%
-20%
-25%
-30%
-35%
-40%
-45%
-50%
% average 22% 33% 4% 15%
store closed
FY 2020 Results Presentation March 10th 2021 11Retail sales by Geography
Strong local consumption in every market
Retail / % change same FX H1 20 H2 20 FY 20 Middle East
4%
Europe -41% -31% -35%
Asia Pacific -18% +19% +1% Japan Americas
13% 14%
Americas -42% +4% -17%
Japan -39% -18% -28%
Europe
Middle East -44% +26% -12% 26%
APAC
Total -32% -6% -18% 43%
Europe
• Trend heavely impacted by the absence of tourists and store closures
• European local customers up double-digit in H2
• Outstanding growth in Russia (+46% yoy)
Asia Pacific
• Back to pre-pandemic levels for the year Japan
• Strong growth in H2 driven above all by China (+52%), Taiwan (+61%) • Particularly impacted by store closures in tourist destinations
and Korea (+22%) (Hawaii, Guam and Saipan)
• Improving local consumption in the second part of the year
Americas
• Sound performance in H2 thanks to strong local consumption Middle East
• Brazil exceeded FY-19 levels • Significant turnaround in H2 driven by all countries
FY 2020 Results Presentation March 10th 2021 12Retail sales by Product
Improvement across all categories
Retail / % change same FX H1 20 H2 20 FY 20
Other
1%
Leather Goods -31% -7% -19%
Ready to Wear -27% +1% -12% Shoes
17%
Footwear -41% -6% -23%
Other -53% -36% -44%
Leather Goods
RTW
Total 56%
-32% -6% -18% 26%
Leather Goods
• Successful new product launches and reinterpretation of iconic products
• Sustained double digit increase in H2 in Asia, US and Middle East
Ready to Wear
• Strong recovery for Prada and Miu Miu collections in H2
Footwear
• Successful reception of new lifestyle collections drove the improvement in H2
FY 2020 Results Presentation March 10th 2021 13Retail sales by Brand
Strong recovery for Prada and Miu Miu in H2
Retail / % change same FX H1 20 H2 20 FY 20 Other Church's
1% 1%
Prada -31% -4% -17%
Miu Miu
Miu Miu -36% -10% -22% 14%
Church’s -52% -44% -47%
Other (*) -57% -38% -46%
Total -32% -6% -18%
Prada
(*) includes Marchesi and Car Shoe
84%
Church’s
• Heavely impacted by the geographic exposure (~80% Europe)
FY 2020 Results Presentation March 10th 2021 14Gross margin development
Very resilient industrial margins
+2.0% -1.9%
71.9% 72.0%
FY 2019 mix (full Fixed costs / FX FY 2020
price/channel/country)
• Under absorption of industrial fixed costs impact in H1 fully offset by H2 improvement
• Gross Margin reached ~ 73% in H2
FY 2020 Results Presentation March 10th 2021 15Operating costs
Proactive cost management
€ mln
2,013 -210
-24 -25 1,723
-30 -116
1,607
FY-19 Selling A&P PD G&A FY-20 Selling expenses FY-20 adj
of closed stores
during lockdowns
• Total opex declined by -14% (or - € 290 mln)
• Extensive savings programme implemented across all areas of cost
• G&A include the capital gain arising from the Milan real estate disposal
FY 2020 Results Presentation March 10th 2021 16EBIT bridge
Back to positive operating profit
€ mln
+124
216
+38 156
150
+170
-111
-196
-465 H2 19 Gross Margin Opex H2 20
+119
H1 19 Gross Margin Opex H1 20
FY 2020 Results Presentation March 10th 2021 17Revenues, EBIT and Cash flow evolution
€ mln
Revenues EBIT Operating cash
1.655 flow
1.570
1.485
+124
938 289
10% on 9% on 12% on
revenues revenues revenues (*)
225
216
150 156 137
H1-19 H2-19 H1-20 H2-20 H1-19 H2-19 H1-20 H2-20 H1-19 H2-19 H1-20 H2-20
-26
-196
(*) net of capital gain from the Milan real estate disposal
FY 2020 Results Presentation March 10th 2021 18Capex
Limited to strategic projects
€ mln
302
119
Corporate, IT & Industrial
Real estate
Retail 60
122
61
122
61
FY-19 F Y- 2 0
• 12 openings and 20 closures in 2020
FY 2020 Results Presentation March 10th 2021 19Net Operating Working Capital
Managing supply chain effectively
€ mln
703
667
318
290
Trade Payables
Trade Receivables
Inventory 713 667
-327 -290
F Y- 1 9 F Y- 2 0
Net working capital remains well under control
• Effective management of the supply chain
• Inventory down yoy
• Trade receivables down as a result of the wholesale reorganization
FY 2020 Results Presentation March 10th 2021 20Net financial position
Opening Net financial position surplus / (deficit) - 31/12/2019 (406)
Consolidated Net Result -54
Net Working Capital +106
Depreciation and Amortization +225
Investments -150
Other -32
Closing Net financial position surplus / (deficit) - 31/12/2020 (311)
FY 2020 Results Presentation March 10th 2021 21Agenda
Patrizio Bertelli – CEO
Business Update
Alessandra Cozzani – CFO
FY 2020 Financial Review
Lorenzo Bertelli – Head of Marketing and Head of CSR
Marketing and Communication update
Carlo Mazzi – Chairman
Outlook
Q&A Session
FY 2020 Results Presentation March 10th 2021 22E-commerce
Optimise the online experience as e-commerce penetration accelerates
Strong focus on brands.com and selected market places
/ e-concessions
• Roll out on a global scale ongoing at all brands
• Building a dedicated e-commerce Chinese team
Further improving the online customer experience and
conversion rates
• Restyled Prada website across all major markets
Optimisation of the e-commerce order-fulfillment process
• Providing shipment from both stores and central / regional
warehouses
Improving technological platforms and applications to support
the high level of demand online
Sharp acceleration of the online business across geographies
and categories
FY 2020 Results Presentation March 10th 2021 23Focus on client engagement and omnichannel
A systemic approach on all digital platforms
Wider range of omnichannel services as
digital is augmented with physical and
viceversa
• More interactive relationships with customers
thanks to clienteling actions supported by
technology
Leveraging advanced analytics to develop
personalised customer strategy
Storytelling strategy to engage clients on brand
and company’s values
Rolled out Net Promoter Score (NPS) system
globally to continuosly improve cross channel
customer experience
FY 2020 Results Presentation March 10th 2021 24Prada brand heat strong and accelerating
Data statistics confirming brand momentum
• Growth rate on Instagram: Prada ranked 3rd in H2-20 (**) • Google search indicator: +29% in H2-20 vs. H2-19;
+41% in H2-20 vs H1-20 (*)
• Engagement rate on Instagram: +32% in H2-20 vs. H2-19 (**)
• Site traffic: +74% in H2-20 vs. H2-19 (***)
• Growth rate on Weibo: Prada ranked 3rd in H2-20 (**)
• Chinese Organic Site traffic : +71% in H2-20 vs. H2-19 (****)
H2-20 Instagram engagement rate
Instagram growth rate comparison trend Prada brand
9%
0,18%
8%
7%
0,16%
6%
0,15%
5%
0,14%
4%
3%
2%
1%
0%
H1 2019 H2 2019 H1 2020 H2 2020
(*) Google trend (***) Adobe analytics
(**) Sprinklr – comparing the growth rate of a panel made of 9 luxury peers (****) Adobe Analytics – Including only traffic from Search Engine or Direct
FY 2020 Results Presentation March 10th 2021 25Prada and Miu Miu SS21 digital shows as effective as physical events
Successfully adapted to the critical environment
Prada
• Prada SS21 top ranked in terms
of online buzz during Milan Fashion Week
• Triple digit growth in views on Instagram
(SS21 vs. SS20)
• Weibo hashtag #PradaSS21 hit 170 mln
views in one day
• 32 mln views on Weibo and 35 mln on Douyin
Miu Miu
• Miu Miu SS21 fashion show is the third most
mentioned brand at Paris Fashion Week.
• Triple digit growth in views on Instagram
(SS21 vs. SS20)
FY 2020 Results Presentation March 10th 2021 26Innovative ways of connecting with our audiences
Accessible approach towards communication
Prada Dialogues, an innovative concept within
the Prada marketing strategy
Starting at the debut collection (SS21) by the co-
creative directors Miuccia Prada and Raf Simons,
Prada inaugurated an open dialogue between the
brand and its audiences
Prada and Sotheby’s «Tools of memory»
Fall/Winter 2020 campaign conceived as an online
auction in collaboration with Sotheby’s. Proceeds
donated to UNESCO’s educational projects
Prada Possible Conversations
A series of digital talks exploring fashion, culture
and life on Instagram, later translated into local
events. Each conversation resulted in a donation
to UNESCO
FY 2020 Results Presentation March 10th 2021 27Global and local approach in communication
Activations and cultural events around the world
Culture-related activities
• Prada Mode event - experiential marketing format to
connect with local audiences in Paris and Shanghai
• Miu Miu Women’s Tales local screenings in Tokyo and
Shanghai
Product-oriented initiatives involving key celebrities
and influencers
• Prada Cleo bag local activations - #Pradacleobag saw
55 million impressions and 410,000 discussions on Weibo
within hours of the launch
• Miu Miu Select - Retail experience inviting a community of
Miu Miu girls to showcase their favourite wardrobe among
the collection worldwide
FY 2020 Results Presentation March 10th 2021 28ESG
Continuing to prioritise ESG delivery
Prada Group to unveil its comprehensive CSR
roadmap in 2021
Continuous focus on fostering an inclusive
company culture
• Appointment of Chief Diversity and Inclusion Officer
• Prada Group joins the Valuable 500 global
community putting disability on sustainability agenda
Completion of Sea Beyond
Educational programme conducted in collaboration
with UNESCO’s Intergovernmental Oceanographic
Commission (IOC)
Prada Group leadership in sustainable finance
confirmed
Third issuance of a sustainable linked loan
FY 2020 Results Presentation March 10th 2021 29ESG
Product innovation from a sustainability perspective
The Group is strongly committed to the research
and development of alternative materials
• Industrial partnership with Adidas
• Implementing Fashion Pact objectives
Prada Re-Nylon
• Successfully expanded collection
• Full conversion from Prada virgin nylon to
regenerated nylon on track by end of 2021
Upcycled by Miu Miu
• A special collection of vintage dresses transformed
according to Miu Miu aesthetic codes
• New collaboration with Levi’s in 2021
FY 2020 Results Presentation March 10th 2021 30Agenda
Patrizio Bertelli – CEO
Business Update
Alessandra Cozzani – CFO
FY 2020 Financial Review
Lorenzo Bertelli – Head of Marketing and Head of CSR
Marketing and Communication update
Carlo Mazzi – Chairman
Outlook
Q&A Session
FY 2020 Results Presentation March 10th 2021 31Outlook
Prada Group successfully withstood the unprecedented
challenges of the pandemic while continuing to drive
forward strategy
Continuous investment in brand equity, people, product and
customers delivered resilience and strong recovery in sales
Direct control of the supply chain and distribution channels
combined with a focus on digital communications are the
pillars of positive future prospects
Encouraging start to 2021 in spite of continuing restrictions
In an environment that is still uncertain, the fundamentals
of the luxury sector remain strong and the Prada Group is
well positioned to capture long term growth
FY 2020 Results Presentation March 10th 2021 32You can also read