The Allstate Corporation Investor Supplement First Quarter 2021

Page created by Bob Mills
 
CONTINUE READING
The Allstate Corporation Investor Supplement First Quarter 2021
The Allstate Corporation

                                                                            Investor Supplement
                                                                              First Quarter 2021

The condensed consolidated financial statements and financial exhibits included herein are unaudited. These condensed consolidated financial statements and exhibits should be read in conjunction with the
consolidated financial statements and notes thereto included in the most recent Annual Report on Form 10-K and Quarterly Reports on Form 10-Q. The results of operations for interim periods should not be
considered indicative of results to be expected for the full year.

Measures used in these financial statements and exhibits that are not based on generally accepted accounting principles ("non-GAAP") are denoted with an asterisk (*). These measures are defined on the pages
"Definitions of Non-GAAP Measures" and are reconciled to the most directly comparable generally accepted accounting principles ("GAAP") measure herein.
THE ALLSTATE CORPORATION
                                                       Investor Supplement
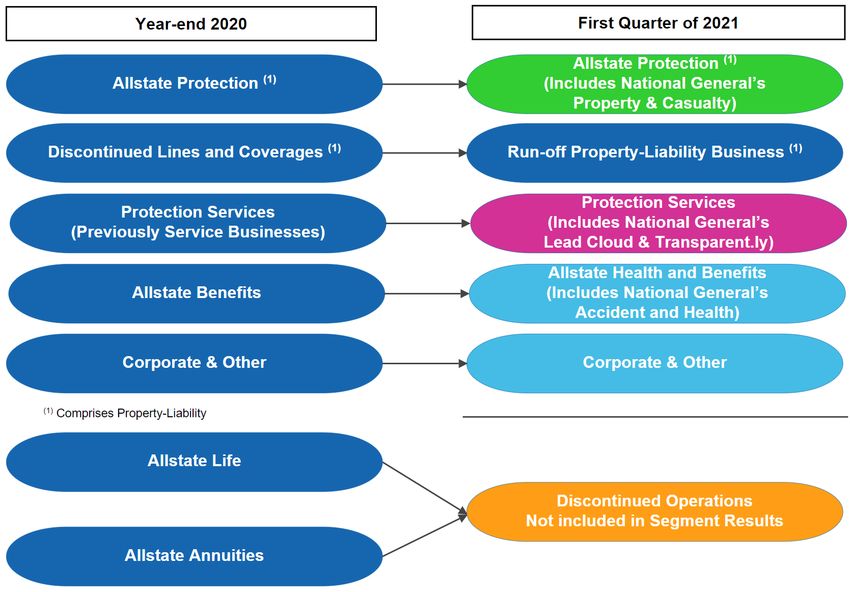
                                 Historical Results Updated to Reflect Divestitures and Acquisition

In the first quarter of 2021, we completed the acquisition of National General Holdings Corp. We also announced the sale of Allstate Life
Insurance Company and certain subsidiaries, and Allstate Life Insurance Company of New York.

These changes are reflected in the following reportable segments: Allstate Protection, Run-off Property-Liability Business (previously
Discontinued Lines and Coverages), Protection Services, Allstate Health and Benefits (previously Allstate Benefits) and Corporate and
Other.

                                                                                                                                            Exec Summary
The Allstate Corporation
                                                    Investor Supplement - First Quarter 2021

Table of Contents
Consolidated Operations                                                 Allstate Health and Benefits (Previously Allstate Benefits)
  Condensed Consolidated Statements of Operations                 1        Segment Results and Other Statistics                                                11
  Contribution to Income                                          2
  Book Value per Common Share and Debt to Capital                 3     Corporate and Other
  Return on Allstate Common Shareholders' Equity                  4        Segment Results                                                                     12
  Policies in Force and Other Statistics                          5
                                                                        Investments
Property-Liability                                                         Investment Position and Results                                                     13
  Results                                                         6        Investment Position and Results by Strategy                                         14
 Allstate Protection
  Allstate Protection Profitability Measures                      7     Definitions of Non-GAAP Measures                                                      15,16
  Auto Profitability Measures                                     8
  Homeowners Profitability Measures                               9     Glossary                                                                               17
                                                                           Items included in the glossary are denoted with a caret (^) the first time used.
Protection Services
  Segment Results                                                 10
The Allstate Corporation
                                                                                              Condensed Consolidated Statements of Operations

                                     ($ in millions, except per share data)                                                                         Three months ended

                                                                                                                   March 31,         Dec. 31,            Sept. 30,           June 30,           March 31,
                                                                                                                     2021             2020                2020                 2020               2020
                                     Revenues
                                       Property and casualty insurance premiums ^                              $      10,307     $       9,279       $       9,336       $       9,223      $       9,235
                                       Accident and health insurance premiums and contract charges ^                     455               262                 287                 263                282
                                       Other revenue ^                                                                   555               271                 272                 257                265
                                       Net investment income                                                             708               660                 464                 220                246
                                       Realized capital gains (losses)                                                   426               490                 319                 440               (162)
                                          Total revenues                                                              12,451            10,962              10,678              10,403              9,866

                                     Costs and expenses
                                       Property and casualty insurance claims and claims expense                       6,043             5,366               6,072               5,222              5,341
                                       Shelter-in-Place Payback expense                                                    -                 -                   -                 738                210
                                       Accident and health insurance policy benefits                                     233               124                 128                 123                141
                                       Interest credited to contractholder funds                                           9                 7                   8                   9                  9
                                       Amortization of deferred policy acquisition costs                               1,523             1,382               1,386               1,344              1,365
                                       Operating costs and expenses                                                    1,731             1,440               1,322               1,394              1,338
                                       Pension and other postretirement remeasurement (gains) losses                    (310)             (371)                (71)                 73                318
                                       Restructuring and related charges                                                  51                40                 196                  13                  4
                                       Amortization of purchased intangibles                                              53                30                  31                  29                 28
                                       Interest expense                                                                   86                80                  78                  79                 81
                                           Total costs and expenses                                                    9,419             8,098               9,150               9,024              8,835

                                     Income from operations before income tax expense                                  3,032             2,864               1,528               1,379              1,031

                                     Income tax expense                                                                  626              594                  312                273                 194

                                     Net income from continuing operations                                             2,406             2,270               1,216               1,106                837

                                     Income (loss) from discontinued operations, net of tax                            (3,793)            354                   (63)              144                (288)

                                     Net income (loss)                                                                (1,387)            2,624               1,153               1,250                549

                                     Less: Net loss attributable to noncontrolling interest                                (6)                  -                    -                  -                   -

                                     Net income (loss) attributable to Allstate                                       (1,381)            2,624               1,153               1,250                549

                                     Less: Preferred stock dividends                                                      27                26                  27                  26                 36

                                     Net income (loss) applicable to common shareholders                       $      (1,408)    $       2,598       $       1,126       $       1,224      $         513

                                     Earnings per common share

                                           Basic
                                             Continuing operations                                             $        7.88     $        7.38       $         3.82      $        3.44      $         2.52
                                             Discontinued operations                                                  (12.53)             1.16                (0.20)              0.46               (0.90)
                                                Total                                                          $       (4.65)    $        8.54       $         3.62      $        3.90      $         1.62

                                           Diluted
                                             Continuing operations                                             $        7.78     $        7.30       $        3.78       $        3.41      $        2.48
                                             Discontinued operations                                                  (12.38)             1.15                (0.20)              0.45               (0.89)
                                                Total                                                          $       (4.60)    $        8.45       $         3.58      $        3.86      $         1.59

                                           Weighted average common shares - Basic                                      302.5             304.3               311.2               313.7              317.4
                                           Weighted average common shares - Diluted                                    306.4             307.6               314.1               317.0              322.4

                                     Cash dividends declared per common share                                  $        0.81     $        0.54       $        0.54       $        0.54      $        0.54

The Allstate Corporation 1Q21 Supplement                                                                                                                                                                        1
The Allstate Corporation
                                                                        Contribution to Income

   ($ in millions, except per share data)                                                                      Three months ended

                                                                             March 31,         Dec. 31,             Sept. 30,           June 30,           March 31,
                                                                               2021             2020                 2020                 2020               2020
   Contribution to income

       Net income (loss) applicable to common shareholders               $      (1,408)    $       2,598        $       1,126       $       1,224      $         513

       Realized capital (gains) losses                                            (426)             (490)                (319)               (440)               162
       Pension and other postretirement remeasurement (gains)
       losses                                                                     (310)             (371)                  (71)                   73             318
       Curtailment (gains) losses                                                    -                 -                    (8)                    -               -
       Reclassification of periodic settlements and accruals on non-
       hedge derivative instruments                                                    1                 (1)                    1                  -                   -
       Business combination expenses and the amortization of
       purchased intangibles                                                        75                30                       31              29                 28
       (Income) loss from discontinued operations                                4,163              (446)                      86            (167)               370
       Income tax expense (benefit)                                               (224)              272                       54              97               (189)
     Adjusted net income *                                               $       1,871     $       1,592        $         900       $        816       $       1,202

   Income per common share - Diluted

       Net income (loss) applicable to common shareholders               $        (4.60)   $        8.45        $        3.58       $        3.86      $        1.59

       Realized capital (gains) losses                                            (1.39)           (1.59)                (1.01)             (1.39)              0.50
       Pension and other postretirement remeasurement (gains)
       losses                                                                     (1.01)           (1.21)                (0.22)              0.23               0.99
       Curtailment (gains) losses                                                   -                -                   (0.02)               -                  -
       Reclassification of periodic settlements and accruals on non-
       hedge derivative instruments                                                -                 -                     -                  -                  -
       Business combination expenses and the amortization of
       purchased intangibles                                                      0.25              0.10                 0.10                0.09                0.09
       (Income) loss from discontinued operations                                13.59             (1.45)                0.27               (0.52)               1.15
       Income tax expense (benefit)                                              (0.73)             0.88                 0.17                0.31               (0.59)
     Adjusted net income *                                               $        6.11     $        5.18        $        2.87       $        2.58      $        3.73

     Weighted average common shares - Diluted                                     306.4            307.6                 314.1              317.0               322.4

The Allstate Corporation 1Q21 Supplement                                                                                                                                   2
The Allstate Corporation
                                                           Book Value per Common Share and Debt to Capital
 ($ in millions, except per share data)                                          March 31,             Dec. 31,             Sept. 30,             June 30,              March 31,
                                                                                   2021                 2020                 2020                   2020                  2020
 Book value per common share

         Numerator:
            Allstate common shareholders' equity (1)                         $       24,649        $      28,247        $       25,293        $      25,016         $       22,203

         Denominator:
            Common shares outstanding and dilutive potential
            common shares outstanding (2)                                              304.0                308.7                 307.0                315.8                   318.7

             Book value per common share                                     $        81.08        $       91.50        $        82.39        $       79.21         $          69.67

 Book value per common share, excluding the impact of
 unrealized net capital gains and losses on fixed income
 securities

         Numerator:
            Allstate common shareholders' equity                             $       24,649        $      28,247        $       25,293        $      25,016         $       22,203
            Less: Unrealized net capital gains and losses on fixed
            income securities                                                         1,680                3,185                 2,750                2,610                    534
            Adjusted Allstate common shareholders' equity                    $       22,969        $      25,062        $       22,543        $      22,406         $       21,669

         Denominator:
            Common shares outstanding and dilutive potential
            common shares outstanding                                                  304.0                308.7                 307.0                315.8                   318.7

 Book value per common share, excluding the impact of
 unrealized net capital gains and losses on fixed income
 securities *                                                                $        75.56        $       81.19        $        73.43        $       70.95         $          67.99

 Total debt                                                                  $        7,996        $       7,825        $        6,635        $       6,634         $          6,633

 Total capital resources                                                     $       34,815        $      38,042        $       33,898        $      33,620         $       30,806

 Ratio of debt to Allstate shareholders' equity                                      29.8 %                25.9 %               24.3 %                24.6 %                27.4 %

 Ratio of debt to capital resources                                                  23.0 %                20.6 %               19.6 %                19.7 %                21.5 %

 (1)
       Excludes equity related to preferred stock of $2,170 at March 31, 2021 and $1,970 million at December 31, 2020, September 30, 2020, June 30, 2020 and March 31, 2020.
 (2)   Common shares outstanding were 300,124,914 and 304,192,788 as of March 31, 2021 and December 31, 2020, respectively.

The Allstate Corporation 1Q21 Supplement                                                                                                                                               3
The Allstate Corporation
                                                                      Return on Allstate Common Shareholders' Equity

($ in millions)                                                                                                                       Twelve months ended

                                                                                               March 31,             Dec. 31,              Sept. 30,             June 30,            March 31,
                                                                                                 2021                 2020                  2020                   2020                2020
Return on Allstate common shareholders' equity

        Numerator:

            Net income applicable to common shareholders (1)                               $        3,540        $       5,461         $        4,570        $        4,333      $        3,930

        Denominator:

            Beginning Allstate common shareholders' equity                                 $       22,203        $      23,750         $       23,088        $      22,546       $       21,488
            Ending Allstate common shareholders' equity (2)                                        24,649               28,247                 25,293               25,016               22,203

            Average Allstate common shareholders' equity ^                                 $       23,426        $      25,999         $       24,191        $      23,781       $       21,846

        Return on Allstate common shareholders' equity                                                15.1 %               21.0 %                 18.9 %                18.2 %              18.0 %

Adjusted net income return on Allstate common shareholders' equity

        Numerator:

            Adjusted net income * (1)                                                      $        5,179        $       4,510         $        3,897        $        3,887      $        3,687

        Denominator:

            Beginning Allstate common shareholders' equity                                 $       22,203        $      23,750         $       23,088        $      22,546       $       21,488
            Less: Unrealized net capital gains and losses                                             530                1,887                  2,023                1,654                  972
            Adjusted beginning Allstate common shareholders' equity                                21,673               21,863                 21,065               20,892               20,516

            Ending Allstate common shareholders' equity                                            24,649               28,247                 25,293               25,016               22,203
            Less: Unrealized net capital gains and losses                                           1,680                3,180                  2,744                2,602                  530
            Adjusted ending Allstate common shareholders' equity                                   22,969               25,067                 22,549               22,414               21,673

            Average adjusted Allstate common shareholders' equity ^                        $       22,321        $      23,465         $       21,807        $      21,653       $       21,095

        Adjusted net income return on Allstate common shareholders' equity *                          23.2 %               19.2 %                 17.9 %               18.0 %               17.5 %

 (1)   Net income applicable to common shareholders and adjusted net income reflect a trailing twelve-month period.
 (2)   Excludes equity related to preferred stock of $2,170 at March 31, 2021 and $1,970 million at December 31, 2020, September 30, 2020, June 30, 2020 and March 31, 2020.

The Allstate Corporation 1Q21 Supplement                                                                                                                                                             4
The Allstate Corporation
                                                                      Policies in Force and Other Statistics

                                                                             March 31,                Dec. 31,              Sept. 30,               June 30,              March 31,
                                                                              2021                     2020                  2020                     2020                 2020
     Policies in force statistics (in thousands) (1)
      Allstate Protection
             Auto                                                                 25,453                  22,260                 22,360                 22,451                 22,311
             Homeowners                                                            7,090                   6,643                  6,634                  6,616                  6,590
             Other personal lines                                                  4,774                   4,530                  4,528                  4,489                  4,460
             Commercial lines                                                        325                     216                    219                    221                    224
                Total                                                             37,642                  33,649                 33,741                 33,777                 33,585

            Allstate brand
                Auto                                                              21,824                  21,809                 21,900                 21,978                 21,826
                Homeowners                                                         6,427                   6,427                  6,414                  6,391                  6,360

            National General (2)
                Auto                                                                3,629                    451                    460                    473                     485
                Homeowners                                                            663                    216                    220                    225                     230

        Protection Services
             Allstate Protection Plans                                           133,510                128,982                125,831                 120,301                107,124
             Allstate Dealer Services                                              3,996                  4,042                  4,075                   4,101                  4,096
             Allstate Roadside                                                       540                    548                    558                     562                    576
             Allstate Identity Protection                                          2,702                  2,700                  2,490                   2,312                  1,932
                  Total                                                          140,748                136,272                132,954                 127,276                113,728

        Allstate Health and Benefits                                                4,522                  3,950                  4,092                  4,410                   4,309

            Total policies in force                                              182,912                173,871                 170,787                165,463                151,622

      (1) Policy counts are based on items rather than customers.
        • A multi-car customer would generate multiple item (policy) counts, even if all cars were insured under one policy.
        • PIF does not reflect banking relationships for our lender-placed insurance products to customers including fire, home and flood products, as well as collateral protection
          insurance and guaranteed asset protection products for automobiles.
        • Commercial lines PIF for shared economy agreements reflect contracts that cover multiple drivers as opposed to individual drivers.
        • Allstate Roadside reflects memberships in force and do not include their wholesale partners as the customer relationship is managed by the wholesale partner.
        • Allstate Dealer Services reflects service contracts and other products sold in conjunction with auto lending and vehicle sales transactions and do not include their third party
          administrators ("TPAs") as the customer relationship is managed by the TPAs.
        • Allstate Protection Plans represents active consumer product protection plans.
        • Allstate Identity Protection reflects individual customer counts for identity protection products.
        • Allstate Health and Benefits reflects certificate counts as opposed to group counts.
      (2) Encompass brand has been combined into National General in the first quarter of 2021 and results prior to 2021 reflect Encompass brand results only.

The Allstate Corporation 1Q21 Supplement                                                                                                                                                     5
The Allstate Corporation
                                                                                                                    Property-Liability Results

                                      ($ in millions, except ratios)                                                                                                Three months ended

                                                                                                                           March 31,             Dec. 31,                Sept. 30,               June 30,               March 31,
                                                                                                                             2021                 2020                    2020                     2020                   2020

                                      Premiums written                                                                $         9,768       $        8,609           $        9,395          $       9,172          $        8,592
                                      Decrease (increase) in unearned premiums                                                   (280)                 244                     (470)                  (349)                    370
                                      Other                                                                                       408                   31                       27                     40                     (81)
                                      Premiums earned                                                                           9,896                 8,884                   8,952                   8,863                  8,881
                                      Other revenue                                                                               385                   218                     220                     206                    213
                                      Claims and claims expense                                                                (5,945)               (5,268)                 (5,968)                 (5,139)                (5,251)
                                      Shelter-in-Place Payback expense                                                              -                     -                       -                    (738)                  (210)
                                      Amortization of deferred policy acquisition costs                                        (1,303)               (1,168)                 (1,158)                 (1,149)                (1,167)
                                      Operating costs and expenses                                                             (1,344)               (1,207)                 (1,107)                 (1,133)                (1,114)
                                      Restructuring and related charges                                                           (32)                  (36)                   (187)                     (8)                    (4)
                                      Underwriting income (1)                                                          $        1,657        $        1,423          $          752          $          902         $        1,348

                                      Catastrophe losses                                                              $          590        $          424           $          990          $       1,186          $         211

                                      Amortization of purchased intangibles                                           $            19       $                   5    $                   3   $                  3   $               1

                                      Operating ratios and reconciliations to underlying ratios

                                      Loss ratio                                                                                 60.1                  59.3                    66.7                    58.0                   59.1
                                      Effect of catastrophe losses                                                               (6.0)                 (4.8)                  (11.1)                  (13.4)                  (2.4)
                                      Effect of prior year non-catastrophe reserve reestimates                                   (0.1)                   -                     (0.8)                    0.4                   (0.3)
                                         Underlying loss ratio *                                                                 54.0                  54.5                    54.8                    45.0                   56.4

                                      Expense ratio ^                                                                            23.2                  24.7                    24.9                   31.8                    25.7
                                      Effect of amortization of purchased intangibles                                            (0.1)                 (0.1)                     -                      -                       -
                                         Underlying expense ratio *                                                              23.1                  24.6                    24.9                   31.8                    25.7

                                      Combined ratio                                                                             83.3                  84.0                    91.6                    89.8                   84.8
                                      Effect of catastrophe losses                                                               (6.0)                 (4.8)                  (11.1)                  (13.4)                  (2.4)
                                      Effect of prior year non-catastrophe reserve reestimates                                   (0.1)                   -                     (0.8)                    0.4                   (0.3)
                                      Effect of amortization of purchased intangibles                                            (0.1)                 (0.1)                     -                       -                      -
                                         Underlying combined ratio *                                                             77.1                  79.1                    79.7                    76.8                   82.1

                                      Effect of restructuring and related charges on combined ratio                               0.3                   0.4                     2.1                     0.1                     -

                                      Effect of Run-off Property-Liability on combined ratio                                      0.1                   0.1                     1.5                         -                   -

                                      Effect of Shelter-in-Place Payback expense on combined and expense
                                      ratios                                                                                       -                        -                        -                  8.3                    2.4

                                      (1)
                                            Underwriting income (loss)
                                               Allstate brand                                                         $         1,515       $        1,414           $          842          $         899          $        1,336
                                               National General (2)                                                               138                   12                       43                      6                      14
                                               Answer Financial                                                                     7                    -                        2                      -                       1
                                               Total underwriting income for Allstate Protection                                1,660                1,426                      887                    905                   1,351

                                               Run-off Property-Liability                                                          (3)                      (3)                (135)                        (3)                 (3)

                                               Total underwriting income for Property Liability                       $         1,657       $        1,423           $          752          $         902          $        1,348

                                      Investment results and taxes
                                         Net investment income                                                         $          673        $         619           $          422          $         178          $          202
                                         Realized capital gains (losses), after-tax                                               314                  327                      230                    299                     (82)
                                         Income tax expense on operations                                                        (471)                (414)                    (240)                  (209)                   (303)

                                      (2)
                                              Encompass brand has been combined into National General in the first quarter of 2021 and results prior to 2021 reflect Encompass brand results only.

The Allstate Corporation 1Q21 Supplement                                                                                                                                                                                                6
The Allstate Corporation
                                                                 Allstate Protection Profitability Measures

 ($ in millions, except ratios)                                                                                 Three months ended

                                                                               March 31,         Dec. 31,            Sept. 30,           June 30,          March 31,
                                                                                 2021             2020                2020                 2020              2020

 Net premiums earned
  Auto                                                                     $        6,809    $       6,103       $        6,210      $       6,172     $        6,155
  Homeowners                                                                        2,392            2,090                2,073              2,054              2,037
  Other personal lines                                                                505              484                  486                478                471
  Commercial lines                                                                    190              207                  183                159                218
       Total                                                               $        9,896    $       8,884       $        8,952      $       8,863     $        8,881

 Underwriting income (loss)
  Auto                                                                     $        1,327    $         883       $          906      $         998     $          657
  Homeowners                                                                          268              449                  (67)              (139)               581
  Other personal lines                                                                 33               89                   42                 43                 90
  Commercial lines                                                                     (2)             (16)                 (14)               (11)                 5
  Other business lines ^                                                               27               21                   18                 14                 17
  Answer Financial                                                                      7                -                    2                  -                  1
      Total                                                                $        1,660    $       1,426       $          887      $         905     $        1,351

 Operating ratios and reconciliations to underlying ratios

 Loss ratio                                                                          60.0              59.3                65.2                58.0              59.1
 Effect of catastrophe losses                                                        (6.0)             (4.8)              (11.1)              (13.4)             (2.4)
 Effect of prior year non-catastrophe reserve reestimates                              -                 -                  0.7                 0.4              (0.3)
   Underlying loss ratio *                                                           54.0              54.5                54.8                45.0              56.4

 Expense ratio                                                                       23.2              24.6                24.9                31.8              25.7
 Effect of amortization of purchased intangibles                                     (0.1)               -                   -                   -                 -
   Underlying expense ratio *                                                        23.1              24.6                24.9                31.8              25.7

 Combined ratio                                                                      83.2              83.9                90.1                89.8              84.8
 Underlying combined ratio *                                                         77.1              79.1                79.7                76.8              82.1

 Effect of advertising expenses on combined ratio                                     3.2               3.7                 2.3                 2.4               2.3

 Effect of restructuring and related charges on combined ratio                        0.3               0.4                 2.1                 0.1                -

 Effect of Shelter-in-Place Payback expense on combined and expense
 ratios                                                                                -                    -                    -              8.3               2.4

The Allstate Corporation 1Q21 Supplement                                                                                                                                 7
The Allstate Corporation
                                                                                                       Auto Profitability Measures

                              ($ in millions, except ratios)                                                                                           Three months ended

                                                                                                                    March 31,            Dec. 31,             Sept. 30,           June 30,         March 31,
                                                                                                                      2021                2020                 2020                 2020             2020

                              Allstate Protection
                                 Net premiums earned                                                            $       6,809       $        6,103       $        6,210      $        6,172    $       6,155
                                 Underwriting income                                                            $       1,327       $          883       $          906      $          998    $         657

                              Operating ratios and reconciliations to underlying ratios

                                    Loss ratio                                                                           57.2                 60.2                 59.7                47.9             62.2
                                    Effect of catastrophe losses                                                         (0.4)                (0.6)                (1.6)               (2.2)            (0.2)
                                    Effect of prior year non-catastrophe reserve reestimates                              0.2                   -                   0.5                 0.8             (0.4)
                                       Underlying loss ratio *                                                           57.0                 59.6                 58.6                46.5             61.6

                                    Expense ratio                                                                        23.3                 25.3                 25.7                35.9             27.1
                                    Effect of amortization of purchased intangibles                                      (0.2)                  -                    -                   -                -
                                       Underlying expense ratio *                                                        23.1                 25.3                 25.7                35.9             27.1

                                    Combined ratio                                                                       80.5                 85.5                 85.4                83.8             89.3
                                    Effect of catastrophe losses                                                         (0.4)                (0.6)                (1.6)               (2.2)            (0.2)
                                    Effect of prior year non-catastrophe reserve reestimates                              0.2                   -                   0.5                 0.8             (0.4)
                                    Effect of amortization of purchased intangibles                                      (0.2)                  -                    -                   -                -
                                       Underlying combined ratio *                                                       80.1                 84.9                 84.3                82.4             88.7

                                    Effect of Shelter-in-Place Payback expense on combined and expense
                                    ratios                                                                                 -                    -                     -                11.9              3.4

                                    New issued applications (in thousands) ^                                            1,471                 846                   902                882               897

                              Allstate brand
                                 Net premiums earned                                                             $      6,014        $       5,977        $       6,081       $       6,037    $       6,020
                                 Underwriting income                                                             $      1,203        $         882        $         897       $         966    $         659

                                    Combined ratio                                                                       80.0                 85.2                 85.2                84.0             89.1
                                    Underlying combined ratio *                                                          79.6                 84.7                 84.2                82.6             88.5

                                    New issued applications (in thousands)
                                      Agency channel                                                                      651                 603                   682                664               672
                                      Direct channel                                                                      278                 227                   206                204               209

                                    Average premium - gross written ^ ($)                                                607                  621                   621                612              616
                                    Renewal ratio ^ (%)                                                                  86.7                 87.2                  87.9               87.6             87.4
                                    Property damage gross claim frequency ^ (%)                                         (18.8)               (28.7)                (28.6)             (46.4)           (12.2)
                                    Property damage paid claim severity ^ (%)                                             5.5                   5.1                   7.9               20.4              8.1

                              National General (1)
                                Net premiums earned                                                             $         795       $         126        $          129      $         135     $         135
                                Underwriting income (loss)                                                      $         124       $           1        $            9      $          32     $          (2)

                                    Combined ratio                                                                       84.4                 99.2                 93.0                76.3            101.5
                                    Underlying combined ratio *                                                          83.8                 96.0                 89.1                74.1            100.0

                                    New issued application (in thousands)                                                 542                   16                   14                 14                16

                              (1)
                                     Encompass brand has been combined into National General in the first quarter of 2021 and results prior to 2021 reflect Encompass brand results only.

The Allstate Corporation 1Q21 Supplement                                                                                                                                                                        8
The Allstate Corporation
                                                                                              Homeowners Profitability Measures

                        ($ in millions, except ratios)                                                                                               Three months ended

                                                                                                                 March 31,            Dec. 31,             Sept. 30,           June 30,           March 31,
                                                                                                                   2021                2020                 2020                 2020               2020

                         Allstate Protection
                            Net premiums earned                                                              $       2,392       $        2,090       $        2,073       $       2,054      $       2,037
                            Underwriting income (loss)                                                       $         268       $          449       $          (67)      $        (139)     $         581

                         Operating ratios and reconciliations to underlying ratios

                            Loss ratio                                                                                 64.9                55.1                  80.4               84.8               48.9
                            Effect of catastrophe losses                                                              (20.7)              (16.8)                (39.1)             (46.4)              (9.0)
                            Effect of prior year non-catastrophe reserve reestimates                                   (0.2)               (0.1)                  0.7                0.2               (0.1)
                               Underlying loss ratio *                                                                 44.0                38.2                  42.0               38.6               39.8

                            Expense ratio                                                                             23.9                 23.4                 22.8                22.0               22.6
                            Effect of amortization of purchased intangibles                                           (0.2)                (0.1)                  -                   -                  -
                               Underlying expense ratio *                                                             23.7                 23.3                 22.8                22.0               22.6

                            Combined ratio                                                                             88.8                78.5                103.2               106.8               71.5
                            Effect of catastrophe losses                                                              (20.7)              (16.8)               (39.1)              (46.4)              (9.0)
                            Effect of prior year non-catastrophe reserve reestimates                                   (0.2)               (0.1)                 0.7                 0.2               (0.1)
                            Effect of amortization of purchased intangibles                                            (0.2)               (0.1)                  -                   -                  -
                               Underlying combined ratio *                                                             67.7                61.5                 64.8                60.6               62.4

                            New issued applications (in thousands)                                                     242                 227                   256                 238                212

                         Allstate brand
                            Net premiums earned                                                              $       2,008        $       1,993        $       1,974       $       1,955      $       1,936
                            Underwriting income                                                              $         262        $         442        $         (93)      $        (118)     $         567

                            Combined ratio                                                                            87.0                 77.8                104.7               106.0               70.7
                            Underlying combined ratio *                                                               63.3                 60.8                 64.6                60.2               61.8

                            New issued applications (in thousands)
                              Agency channel                                                                           204                 201                   231                 214                191
                              Direct channel                                                                            16                  17                    16                  16                 13

                            Average premium - gross written ($)                                                      1,360                1,342                1,334               1,324              1,310
                            Renewal ratio (%)                                                                         87.0                 87.4                 87.8                87.3               87.6
                            Gross claim frequency (%)                                                                 19.3                  3.6                  3.5                 (8.6)            (13.2)
                            Paid claim severity (%)                                                                    1.4                  0.7                  3.3                  9.5              15.9

                         National General (1)
                           Net premiums earned                                                               $         384       $           97       $           99       $          99      $         101
                           Underwriting income (loss)                                                        $           6       $            7       $           26       $         (21)     $          14

                            Combined ratio                                                                            98.4                 92.8                 73.7               121.2               86.1
                            Underlying combined ratio *                                                               90.6                 76.3                 68.7                68.7               75.2

                            New issued application (in thousands)                                                       22                       9                     9                  8               8

                           (1)   Encompass brand has been combined into National General in the first quarter of 2021 and results prior to 2021 reflect Encompass brand results only.

The Allstate Corporation 1Q21 Supplement                                                                                                                                                                       9
The Allstate Corporation
                                                                                  Protection Services Segment Results

             ($ in millions)                                                                                                  Three months ended

                                                                                               March 31,         Dec. 31,          Sept. 30,           June 30,         March 31,
                                                                                                 2021             2020              2020                 2020             2020
             Protection Services
               Net premiums written                                                        $          583    $         559     $          485      $         467    $          379
                   Net premiums earned                                                     $          411    $         395     $          384      $         360    $          354
                   Other revenue                                                                       90               53                 52                 51                52
                   Intersegment insurance premiums and service fees                                    41               38                 36                 35                38
                   Net investment income                                                               10               11                 12                 11                10
                   Claims and claims expense                                                         (103)            (102)              (107)               (85)              (92)
                   Amortization of deferred policy acquisition costs                                 (181)            (176)              (169)              (160)             (153)
                   Operating costs and expenses                                                      (198)            (167)              (160)              (163)             (161)
                   Restructuring and related charges                                                   (9)              (2)                 2                 (3)                -
                   Income tax expense on operations                                                   (12)             (12)               (10)                (8)              (11)
                     Adjusted net income (1)                                               $           49    $          38     $           40      $          38    $           37
                       Depreciation                                                                     8                8                  7                  6                 7
                       Restructuring and related charges                                                9                2                 (2)                 3                 -
                       Income tax expense on operations                                                12               12                 10                  8                11
                     Adjusted earnings before taxes, depreciation and restructuring *      $           78    $          60     $           55      $          55    $           55

             Allstate Protection Plans
                Net premiums written                                                       $          388    $         385     $          300      $         310    $          221
                   Net premiums earned                                                     $          260    $         248     $          236      $         219    $          206
                   Revenue ^                                                                          275              263                251                232               219
                   Claims and claims expense                                                          (66)             (69)               (70)               (56)              (55)
                   Amortization of deferred policy acquisition costs                                  (91)             (87)               (83)               (75)              (70)
                   Other costs and expenses ^                                                         (61)             (61)               (56)               (57)              (50)
                   Restructuring and related charges                                                    -                -                  3                  -                 -
                   Income tax expense on operations                                                   (12)             (14)                (9)                (9)              (10)
                      Adjusted net income                                                  $           45    $          32     $           36      $          35    $           34

             Allstate Dealer Services
                Revenue                                                                    $          123    $         121     $          121      $         118    $          117
                Adjusted net income                                                                     8                7                  7                  8                 7

             Allstate Roadside
                Revenue                                                                    $           59    $          58     $           59      $          53    $           60
                Adjusted net income                                                                     4                4                  4                  2                 2

             Arity
               Revenue                                                                     $           64    $          26     $           25      $          26    $           30
               Adjusted net income (loss)                                                               2               (2)                (3)                (3)               (3)

             Allstate Identity Protection
                Revenue                                                                    $           31    $          29     $           28      $          28    $           28
                Adjusted net loss                                                                     (10)              (3)                (4)                (4)               (3)

             (1)
                   Adjusted net income is the GAAP segment measure.

The Allstate Corporation 1Q21 Supplement                                                                                                                                              10
The Allstate Corporation
                                                   Allstate Health and Benefits Segment Results and Other Statistics

   ($ in millions)                                                                                                           Three months ended

                                                                                       March 31,             Dec. 31,             Sept. 30,           June 30,               March 31,
                                                                                         2021                 2020                 2020                 2020                   2020

   Allstate Health and Benefits
     Premiums                                                                      $          428        $            235     $          247      $         237          $          253
     Contract charges                                                                          27                      27                 40                 26                      29
     Other revenue                                                                             80                       -                  -                  -                       -
     Net investment income                                                                     19                      20                 18                 20                      20
     Accident and health insurance policy benefits                                           (233)                   (124)              (128)              (123)                   (141)
     Interest credited to contractholder funds                                                 (9)                     (7)                (8)                (9)                     (9)
     Amortization of deferred policy acquisition costs                                        (39)                    (38)               (59)               (35)                    (45)
                                                                                                                                                                   (1)
     Operating costs and expenses                                                            (190)                    (69)               (68)              (110)                    (75)
     Restructuring and related charges                                                          -                       -                  -                 (1)                      -
     Income tax expense on operations                                                         (18)                    (10)                (9)                 -                      (8)
       Adjusted net income ^                                                       $           65        $             34     $           33      $           5          $           24

   Benefit ratio ^                                                                         51.2 %                   47.3 %            44.6 %              46.8 %                 50.0 %

   Premiums and contract charges
     Employer voluntary benefits ^                                                 $          263        $            262     $          287      $         263          $          282
     Group health ^                                                                            83                       -                  -                  -                       -
     Individual accident and health ^                                                         109                       -                  -                  -                       -
       Total                                                                       $          455        $            262     $          287      $         263          $          282

   (1)   Includes $41 million, pre-tax, write-off of capitalized software costs associated with a billing system.

The Allstate Corporation 1Q21 Supplement                                                                                                                                                   11
The Allstate Corporation
                                                Corporate and Other Segment Results

     ($ in millions)                                                          Three months ended

                                               March 31,         Dec. 31,         Sept. 30,            June 30,          March 31,
                                                 2021             2020             2020                  2020              2020

     Net investment income                 $            6    $          10    $           12       $           11    $           14
     Operating costs and expenses                     (32)             (37)              (23)                 (25)              (25)
     Restructuring and related charges                (10)              (1)              (11)                   -                 -
     Interest expense                                 (86)             (80)              (78)                 (79)              (81)
     Income tax benefit on operations                  26               23                16                   20                21
     Preferred stock dividends                        (27)             (26)              (27)                 (26)              (36)
         Adjusted net loss ^               $         (123)   $        (111)   $         (111)      $          (99)   $         (107)

The Allstate Corporation 1Q21 Supplement                                                                                               12
The Allstate Corporation
                                                                 Investment Position and Results

       ($ in millions)                                                                               As of or for the three months ended

                                                                      March 31,           Dec. 31,               Sept. 30,             June 30,            March 31,
                                                                        2021               2020                   2020                   2020                2020
       Investment position
           Fixed income securities, at fair value                 $       40,594      $      42,565          $       43,683        $       42,034      $       38,447
           Equity securities ^                                             3,154              3,168                   2,977                 2,638               2,331
           Mortgage loans, net                                               902                746                     788                   805                 766
           Limited partnership interests ^                                 6,367              4,563                   4,284                 4,093               4,154
           Short-term, at fair value                                       6,017              6,807                   3,145                 4,140               4,580
           Other investments, net                                          3,042              1,691                   1,860                 1,949               1,841
               Total                                              $       60,076      $      59,540          $       56,737        $       55,659      $       52,119

       Net investment income
           Fixed income securities                                $          301      $         314          $          314        $          306      $          298
           Equity securities                                                  14                 29                      18                    21                  10
           Mortgage loans                                                     10                  9                       8                     8                   9
           Limited partnership interests                                     378                309                     123                  (117)                (77)
           Short-term                                                          1                  2                       2                     2                  11
           Other                                                              41                 33                      29                    31                  31
               Investment income, before expense                             745                696                     494                   251                 282
               Less: Investment expense                                      (37)               (36)                    (30)                  (31)                (36)
                  Net investment income                           $          708      $         660          $          464        $          220      $          246

       Pre-tax yields on fixed income securities ^                            3.1 %              3.1 %                   3.1 %                 3.1 %               3.2 %

       Realized capital gains (losses), pre-tax by transaction
       type
           Sales                                                  $          246      $         212          $          214        $         160       $          388
           Credit losses                                                       2                 (3)                      7                    1                  (37)
           Valuation of equity investments                                   167                294                     128                  265                 (591)
           Valuation and settlements of derivative instruments                11                (13)                    (30)                  14                   78
             Total                                                $          426      $         490          $          319        $         440       $         (162)

       Total return on investment portfolio ^
           Net investment income                                             1.2 %               1.1 %                  0.8 %                 0.4 %               0.5 %
           Valuation-interest bearing                                       (1.8)                1.0                    0.8                   3.9                (1.5)
           Valuation-equity investments                                      0.4                 0.6                    0.2                   0.5                (1.1)
              Total                                                         (0.2) %              2.7 %                  1.8 %                 4.8 %              (2.1) %

       Fixed income securities portfolio duration ^ (in years)              4.81                5.17                   5.14                  5.15                5.10

The Allstate Corporation 1Q21 Supplement                                                                                                                                   13
The Allstate Corporation
                                                                           Investment Position and Results by Strategy

            ($ in millions)                                                                                             As of or for the three months ended

                                                                                        March 31,            Dec. 31,               Sept. 30,             June 30,            March 31,
                                                                                         2021                 2020                   2020                   2020               2020
            Investment Position
              Market-based ^
                Interest-bearing investments ^                                      $       49,422       $      50,975          $       48,581        $       48,062      $       44,762
                Equity securities ^                                                          2,787               2,884                   2,732                 2,395               2,095
                LP and other alternative investments ^                                         298                 257                     215                   180                 162
                     Total                                                          $       52,507       $      54,116          $       51,528        $       50,637      $       47,019

                   Performance-based ^
                     Private equity                                                 $        5,702       $        3,965         $        3,689        $        3,491      $        3,608
                     Real estate                                                             1,867                1,459                  1,520                 1,531               1,492
                          Total                                                     $        7,569       $        5,424         $        5,209        $        5,022      $        5,100

            Investment income
              Market-based
                Interest-bearing investments                                        $          331       $         339          $          339        $         331       $          336
                Equity securities                                                               15                  28                      19                   20                   24
                LP and other alternative investments                                             9                   4                       1                    2                    1
                   Investment income, before expense                                           355                 371                     359                  353                  361
                   Investee level expenses                                                      (1)                 (1)                     (1)                  (1)                  (1)
                     Income for yield calculation                                   $          354       $         370          $          358        $         352       $          360

                   Pre-tax yield                                                               2.8 %                2.9 %                   2.9 %                2.9 %               3.1 %

                   Performance-based
                     Private equity                                                 $          330       $         277          $          134        $         (110)     $          (95)
                     Real estate                                                                60                  48                       1                     8                  16
                       Investment income, before expense                                       390                 325                     135                  (102)                (79)
                       Investee level expenses                                                 (12)                (11)                     (6)                   (8)                 (7)
                          Income for yield calculation                              $          378       $         314          $          129        $         (110)     $          (86)

                   Pre-tax yield                                                              20.7 %               23.7 %                 10.0 %                (8.7) %              (6.7) %

            Total return on investments portfolio
                Market-based                                                                   (1.1) %              2.3 %                   1.8 %                5.5 %               (2.2) %
                Performance-based                                                               6.3                 6.8                     2.3                 (2.3)                (1.2)

                                       (1)
            Internal rate of return          ^
               Performance-based
                 10 year                                                                      11.7 %               11.5 %                 11.5 %                11.3 %              12.1 %
                 5 year                                                                       10.8                  9.6                    8.5                   8.6                10.2
                 3 year                                                                        8.5                  8.0                    7.2                   7.5                10.4
                 1 year                                                                       11.1                  4.4                   (1.1)                 (2.2)                6.5

             (1)   Calculations are based on consolidated results including held for sale investments.

The Allstate Corporation 1Q21 Supplement                                                                                                                                                       14
Definitions of Non-GAAP Measures

We believe that investors’ understanding of Allstate’s performance is enhanced by our disclosure of the following non-GAAP measures. Our methods for calculating these measures may differ from those used by other companies and therefore
comparability may be limited.

Adjusted net income is net income (loss) applicable to common shareholders, excluding:
• realized capital gains and losses except for periodic settlements and accruals on non-hedge derivative instruments, which are reported with realized capital gains and losses but included in adjusted net income,
• pension and other postretirement remeasurement gains and losses,
• business combination expenses and the amortization or impairment of purchased intangibles,
• income or loss from discontinued operations,
• adjustments for other significant non-recurring, infrequent or unusual items when (a) the nature of the charge or gain is such that it is reasonably unlikely to recur within two years, or (b) there has been no similar charge or gain within the prior
  two years, and
• related income tax expense or benefit of these items.

Net income (loss) applicable to common shareholders is the GAAP measure that is most directly comparable to adjusted net income. We use adjusted net income as an important measure to evaluate our results of operations. We believe
that the measure provides investors with a valuable measure of the Company's ongoing performance because it reveals trends in our insurance and financial service business that may be obscured by the net effect of realized capital gains and
losses, pension and other postretirement remeasurement gains and losses, valuation changes on embedded derivatives that are not hedged, business combination expenses, and the amortization or impairment of purchased intangibles, income
or loss from discontinued operations and adjustments for other significant non-recurring, infrequent or unusual items and the related tax expense or benefit of these items. Realized capital gains and losses, pension and other postretirement
remeasurement gains and losses, and valuation changes on embedded derivatives that are not hedged may vary significantly between periods and are generally driven by business decisions and external economic developments such as capital
market conditions, the timing of which is unrelated to the insurance underwriting process. Business combination expenses and income or loss from discontinued operations are excluded because they are non-recurring in nature and the
amortization or impairment of purchased intangibles is excluded because it relates to the acquisition purchase price and is not indicative of our underlying business results or trends. Non-recurring items are excluded because, by their nature, they
are not indicative of our business or economic trends. Accordingly, adjusted net income excludes the effect of items that tend to be highly variable from period to period and highlights the results from ongoing operations and the underlying
profitability of our business. A byproduct of excluding these items to determine adjusted net income is the transparency and understanding of their significance to net income variability and profitability while recognizing these or similar items may
recur in subsequent periods. Adjusted net income is used by management along with the other components of net income (loss) applicable to common shareholders to assess our performance. We use adjusted measures of adjusted net income
in incentive compensation. Therefore, we believe it is useful for investors to evaluate net income (loss) applicable to common shareholders, adjusted net income and their components separately and in the aggregate when reviewing and
evaluating our performance. We note that investors, financial analysts, financial and business media organizations and rating agencies utilize adjusted net income results in their evaluation of our and our industry's financial performance and in
their investment decisions, recommendations and communications as it represents a reliable, representative and consistent measurement of the industry and the Company and management's performance. We note that the price to earnings
multiple commonly used by insurance investors as a forward-looking valuation technique uses adjusted net income as the denominator. Adjusted net income should not be considered a substitute for net income (loss) applicable to common
shareholders and does not reflect the overall profitability of our business. A reconciliation of adjusted net income to net income (loss) applicable to common shareholders is provided in the schedule, "Contribution to Income".

Underlying loss ratio is a non-GAAP ratio, which is computed as the difference between three GAAP operating ratios: the loss ratio, the effect of catastrophes on the combined ratio, and the effect of prior year non-catastrophe reserve
reestimates on the combined ratio. We believe that this ratio is useful to investors and it is used by management to reveal the trends that may be obscured by catastrophe losses and prior year reserve reestimates. Catastrophe losses cause our
loss trends to vary significantly between periods as a result of their incidence of occurrence and magnitude, and can have a significant impact on the combined ratio. Prior year reserve reestimates are caused by unexpected loss development on
historical reserves. We believe it is useful for investors to evaluate these components separately and in the aggregate when reviewing our underwriting performance. The most directly comparable GAAP measure is the loss ratio. The underlying
loss ratio should not be considered a substitute for the loss ratio and does not reflect the overall loss ratio of our business. A reconciliation of underlying loss ratio is provided in the schedules "Property-Liability Results", "Allstate Protection
Profitability Measures", "Auto Profitability Measures" and "Homeowners Profitability Measures".

Underlying expense ratio is a non-GAAP ratio, which is computed as the difference between the expense ratio and the effect of amortization or impairment of purchased intangibles on the expense ratio. We believe that the measure provides
investors with a valuable measure of ongoing performance because it reveals trends that may be obscured by the amortization or impairment of purchased intangible assets. Amortization or Impairment of purchased intangible assets is excluded
because it relates to the acquisition purchase price and is not indicative of our business results or trends. We believe it is useful for investors to evaluate these components separately and in the aggregate when reviewing our underwriting
performance. The most directly comparable GAAP measure is the expense ratio. The underlying expense ratio should not be considered a substitute for the expense ratio and does not reflect the overall expense ratio of our business. A
reconciliation of underlying expense ratio is provided in the schedules "Property-Liability Results", "Allstate Protection Profitability Measures", "Auto Profitability Measures" and "Homeowners Profitability Measures".

Underlying combined ratio is a non-GAAP ratio, which is the sum of underlying loss and underlying expense ratios. We believe that this ratio is useful to investors and it is used by management to reveal the trends in our Property-Liability
business that may be obscured by catastrophe losses, prior year reserve reestimates and amortization or impairment of purchased intangibles. We believe it is useful for investors to evaluate these components separately and in the aggregate
when reviewing our underwriting performance. The most directly comparable GAAP measure is the combined ratio. The underlying combined ratio should not be considered a substitute for the combined ratio and does not reflect the overall
underwriting profitability of our business. A reconciliation of the underlying combined ratio to combined ratio is provided in the schedule "Property-Liability Results", "Auto Profitability Measures" and "Homeowners Profitability Measures".

The Allstate Corporation 1Q21 Supplement                                                                                                                                                                                                                      15
Definitions of Non-GAAP Measures (continued)

 Protection Services adjusted earnings before taxes, depreciation and restructuring, is a non-GAAP measure, which is computed as adjusted net income (loss), excluding taxes, depreciation and restructuring. Adjusted net income
 (loss) is the GAAP measure that is most directly comparable to adjusted earnings before taxes, depreciation and restructuring. We use adjusted earnings before taxes, depreciation and restructuring, as an important measure to evaluate
 Protection Services' results of operations. We believe that the measure provides investors with a valuable measure of Protection Services' ongoing performance because it reveals trends that may be obscured by the taxes,depreciation
 and restructuring expenses. Taxes, depreciation and restructuring are excluded because these are not directly attributable to the underlying operating performance of Protection Services' segment. Adjusted earnings before taxes,
 depreciation and restructuring highlights the results from ongoing operations and the underlying profitability of our business and is used by management along with the other components of adjusted net income (loss) to assess our
 performance. We believe it is useful for investors to evaluate adjusted net income (loss), adjusted earnings before taxes, depreciation and restructuring, and their components separately and in the aggregate when reviewing and
 evaluating Protection Services segment’s performance. Adjusted earnings before taxes, depreciation and restructuring should not be considered a substitute for adjusted net income (loss) and does not reflect the overall profitability of our
 business. A reconciliation of adjusted net income (loss) to adjusted earnings before taxes, depreciation and restructuring, is provided in the schedule, "Protection Services Segment Results".
 Adjusted net income return on Allstate common shareholders' equity is a ratio that uses a non-GAAP measure. It is calculated by dividing the rolling 12-month adjusted net income by the average of Allstate common shareholders’
 equity at the beginning and at the end of the 12-months, after excluding the effect of unrealized net capital gains and losses. Return on Allstate common shareholders' equity is the most directly comparable GAAP measure. We use
 adjusted net income as the numerator for the same reasons we use adjusted net income, as discussed previously. We use average Allstate common shareholders' equity excluding the effect of unrealized net capital gains and losses for
 the denominator as a representation of common shareholders’ equity primarily applicable to Allstate's earned and realized business operations because it eliminates the effect of items that are unrealized and vary significantly between
 periods due to external economic developments such as capital market conditions like changes in equity prices and interest rates, the amount and timing of which are unrelated to the insurance underwriting process. We use it to
 supplement our evaluation of net income (loss) applicable to common shareholders and return on Allstate common shareholders' equity because it excludes the effect of items that tend to be highly variable from period to period. We
 believe that this measure is useful to investors and that it provides a valuable tool for investors when considered along with return on Allstate common shareholders' equity because it eliminates the after-tax effects of realized and
 unrealized net capital gains and losses that can fluctuate significantly from period to period and that are driven by economic developments, the magnitude and timing of which are generally not influenced by management. In addition, it
 eliminates non-recurring items that are not indicative of our ongoing business or economic trends. A byproduct of excluding the items noted above to determine adjusted net income return on Allstate common shareholders' equity from
 return on Allstate common shareholders' equity is the transparency and understanding of their significance to return on common shareholders' equity variability and profitability while recognizing these or similar items may recur in
 subsequent periods. We use adjusted measures of adjusted net income return on common shareholders' equity in incentive compensation. Therefore, we believe it is useful for investors to have adjusted net income return on Allstate
 common shareholders' equity and return on Allstate common shareholders' equity when evaluating our performance. We note that investors, financial analysts, financial and business media organizations and rating agencies utilize
 adjusted net income return on common shareholders' equity results in their evaluation of our and our industry’s financial performance and in their investment decisions, recommendations and communications as it represents a reliable,
 representative and consistent measurement of the industry and the company and management’s utilization of capital. Adjusted net income return on Allstate common shareholders' equity should not be considered a substitute for return
 on Allstate common shareholders' equity and does not reflect the overall profitability of our business. A reconciliation of return on Allstate common shareholders' equity and adjusted net income return on Allstate common shareholders'
 equity can be found in the schedule, "Return on Allstate Common Shareholders' Equity".

 Book value per common share, excluding the impact of unrealized net capital gains and losses on fixed income securities, is a ratio that uses a non-GAAP measure. It is calculated by dividing Allstate common shareholders’ equity after
 excluding the impact of unrealized net capital gains and losses on fixed income securities and related DAC, DSI and life insurance reserves by total common shares outstanding plus dilutive potential common shares outstanding. We
 use the trend in book value per common share, excluding the impact of unrealized net capital gains and losses on fixed income securities, in conjunction with book value per common share to identify and analyze the change in net worth
 applicable to management efforts between periods. We believe the non-GAAP ratio is useful to investors because it eliminates the effect of items that can fluctuate significantly from period to period and are generally driven by economic
 developments, primarily capital market conditions, the magnitude and timing of which are generally not influenced by management, and we believe it enhances understanding and comparability of performance by highlighting underlying
 business activity and profitability drivers. We note that book value per common share, excluding the impact of unrealized net capital gains and losses on fixed income securities, is a measure commonly used by insurance investors as a
 valuation technique. Book value per common share is the most directly comparable GAAP measure. Book value per common share, excluding the impact of unrealized net capital gains and losses on fixed income securities, should not
 be considered a substitute for book value per common share, and does not reflect the recorded net worth of our business. A reconciliation of book value per common share, excluding the impact of unrealized net capital gains on fixed
 income securities, and book value per common share can be found in the schedule, "Book Value per Common Share and Debt to Capital".

The Allstate Corporation 1Q21 Supplement                                                                                                                                                                                                           16
Glossary

              Consolidated Operations
                 Accident and health insurance premiums and contract charges are reported in the Allstate Health and Benefits segment and include employer voluntary benefits, group health and individual accident and health products.
                 Adjusted net income is the GAAP segment measure used for the Protection Services, Allstate Health and Benefits, and Corporate and Other segments.
                 Average Allstate common shareholders' equity and average adjusted Allstate common shareholders' equity are determined using a two-point average, with the beginning and ending Allstate common shareholders' equity and Allstate
                 adjusted common shareholders' equity, respectively, for the twelve-month period as data points.
                 Other revenue primarily represents fees collected from policyholders relating to premium installment payments, commissions on sales of non-proprietary products, sales of identity protection services, fee-based services and other revenue
                 transactions.
                 Property and casualty insurance premiums are reported in the Allstate Protection and Protection Services segments and include auto, homeowners, other personal lines and commercial lines insurance products, as well as consumer
                 product proteion plans, roadside assistance and finance and insurance products.

              Property-Liability
                 Average premium - gross written: Gross premiums written divided by issued item count. Gross premiums written include the impacts from discounts, surcharges and ceded reinsurance premiums and exclude the impacts from mid-term
                 premium adjustments and premium refund accruals. Average premiums represent the appropriate policy term for each line, which is 6 months for auto and 12 months for homeowners.

                 Gross claim frequency is calculated as annualized notice counts received in the period divided by the average of policies in force with the applicable coverage during the period. It includes all actual notice counts, regardless of their current
                 status (open or closed) or their ultimate disposition (closed with a payment or closed without payment). Frequency statistics exclude counts associated with catastrophe events. The percent change in gross claim frequency is calculated as
                 the amount of increase or decrease in the gross claim frequency in the current period compared to the same period in the prior year; divided by the prior year gross claim frequency.

                 New issued applications: Item counts of automobiles or homeowners insurance applications for insurance policies that were issued during the period, regardless of whether the customer was previously insured by another Allstate
                 Protection brand. Allstate brand includes automobiles added by existing customers when they exceed the number allowed (currently 10) on a policy.
                 Other business lines primarily represent commissions earned and other costs and expenses for Ivantage and non-proprietary life and annuity products.
                 Expense ratio: Other revenue is deducted from other costs and expenses in the expense ratio calculation.
                 Paid claim severity is calculated by dividing the sum of paid losses and loss expenses by claims closed with a payment during the period. The percent change in paid claim severity is calculated as the amount of increase or decrease in
                 paid claim severity in the current period compared to the same period in the prior year; divided by the prior year paid claims severity.

              Protection Services
                 Other costs and expenses may include amortization of deferred policy acquisition costs, operating costs and expenses, and restructuring and related charges.
                 Revenue may include net premiums earned, intersegment insurance premiums and service fees, other revenue, revenue earned from external customers and net investment income.

              Allstate Health and Benefits
                 Benefit ratio is contract benefits divided by premiums and contract charges.
                 Employer voluntary benefits include supplemental life and health products offered through workplace enrollment.
                 Group health includes health products sold to employers for use by their employees.
                 Individual accident and health includes short-term medical and supplemental products sold directly to individuals.

              Investments
                 Duration measures the price sensitivity of assets and liabilities to changes in interest rates.
                 Equity securities include investments in exchange traded and mutual funds whose underlying investments are fixed income securities.
                 Interest-bearing investments comprise fixed income securities, mortgage loans, short-term investments, and other investments including bank and agent loans and derivatives.
                 Internal rate of return is one of the measures we use to evaluate the performance of these investments. The IRR represents the rate of return on the investments considering the cash flows paid and received and, until the investment is
                 fully liquidated, the estimated value of investment holdings at the end of the measurement period. The calculated IRR for any measurement period is highly influenced by the values of the portfolio at the beginning and end of the period,
                 which reflect the estimated fair values of the investments as of such dates. As a result, the IRR can vary significantly for different measurement periods based on macroeconomic or other events that impact the estimated beginning or
                 ending portfolio value, such as the global financial crisis. Our IRR calculation method may differ from those used by other investors. The timing of the recognition of income in the financial statements may differ significantly from the cash
                 distributions and changes in the value of these investments.
                 Limited partnership interests: Income from equity method of accounting LP is generally recognized on a three-month delay due to the availability of the related financial statements from investees.
                 LP and other investments comprise limited partnership interests and other alternative investments, including real estate investments classified as other investments. Market-based investments include publicly traded equity securities
                 classified as limited partnerships.
                 Market-based strategy seeks to deliver predictable earnings aligned to business needs and take advantage of short-term opportunities primarily through public and private fixed income investments and public equity securities.
                 Performance-based strategy seeks to deliver attractive risk-adjusted returns and supplement market risk with idiosyncratic risk primarily through investments in private equity and real estate.
                 Pre-tax yields: Quarterly pre-tax yield is calculated as annualized quarterly investment income, before investment expense divided by the average of the ending investment balances of the current and prior quarter. Year-to-date pre-tax
                 yield is calculated as annualized year-to-date investment income, before investment expense divided by the average of investment balances at the beginning of the year and the end of each quarter during the year. For the purposes of the
                 pre-tax yield calculation, income for directly held real estate and other investments is net of investee level expenses (asset level operating expenses reported in investment expense). Fixed income securities investment balances exclude
                 unrealized capital gains and losses. Equity securities investment balances use cost in the calculation.
                 Total return on investment portfolio is calculated from GAAP results, including the total of net investment income, realized capital gains and losses, the change in unrealized net capital gains and losses, and the change in the difference
                 between fair value and carrying value of mortgage loans, bank loans and agent loans divided by the average fair value balances.

The Allstate Corporation 1Q21 Supplement                                                                                                                                                                                                                                17
You can also read