H1 2018 results innogy SE 10 August 2018 Bernhard Günther CFO
←
→
Page content transcription
If your browser does not render page correctly, please read the page content below
H1 2018 results
innogy SE · 10 August 2018
Bernhard Günther · CFO
Notice

This document contains forward-looking statements. These statements are based on the current views,
expectations, assumptions and information of the management, and are based on information currently
available to the management. Forward-looking statements shall not be construed as a promise for the
materialization of future results and developments and involve known and unknown risks and uncertainties.
Actual results, performance or events may differ materially from those described in such statements due to,
among other things, changes in the general economic and competitive environment, risks associated with
capital markets, currency exchange rate fluctuations, changes in international and national laws and
regulations, in particular with respect to tax laws and regulations, affecting the Company, and other factors.
Neither the Company nor any of its affiliates assumes any obligations to update any forward-looking
statements.

                                                                                                                 2
H1 2018
business update
innogy · H1 2018 results

Key messages

Financial          >   Adjusted EBIT down 10 % year on year to €1,553 million and adjusted net income down by
deliverables           23 % to €662 million as expected and reflected in our guidance
                   >   Outlook 2018 confirmed: adjusted net income of more than €1,100 million expected
                   >   Successful placement of two senior bonds with a volume of €500 million each and
                       maturities of 4.5 and 8 years plus tapping

 Business update   >   npower/SSE merger: SSE shareholders back retail merger with innogy’s subsidiary npower
                       by approving the transaction at the Annual General Meeting
                   >   innogy successfully closes onshore wind transaction exceeding a project pipeline of >2 GW
                       by acquiring EverPower Wind Holdings’ US onshore wind development business
                   >   Extension of innogy’s global solar business while securing exclusive rights for solar
                       development projects in the US of ~440 MW

                                                                                                                   4
innogy · H1 2018 results

Key events 2018
                              Q1                                            Q2                                               Q3                                                   Q4

                                                                                  US Solar                     US Onshore              UK Offshore
Renewables

               AUS Solar           NL Offshore          GER Offshore           secures rights               Closing EverPower           Triton Knoll
              Purchase of          Wind auction         Successful bid        for solar projects                acquisition           Financial Close                        NL Offshore
             solar projects          results               Kaskasi                  [Jun]                          [Jun]                                                Wind new auction round
             Overland [Feb]           [Mar]                 [Apr]                UK Offshore                              AUS Solar
                                                                            Triton Knoll FID [May]               Closing Overland acquisition

                                                                                                                                                                     GER
                  GER               GER                                                                                                                                                Eastern Europe
                                                                          GER                                                                                  Determination
G&I

             Determination     Court decision                                                                                                                                          Determination of
                                                                Final revenue caps gas1                                                                            of Xgen
               Xgen gas        RoE calculation                                                                                                                                      allowed revenues for
                                                                 [starting end of May]                                                                            electricity
                 [Feb]             [Mar]                                                                                                                                                t+1 [end Q4]
                                                                                                                                                                [end of Nov]

                                                                                                             GB npower &                                                         GB npower & SEE merger
                                                             GB npower & SSE merger                                                   UK price cap            UK price cap
                 GB npower & SSE merger                                                                       SSE merger                                                               End of phase 2
Retail

                                                                 End of phase 1                                                      Publication of          Publication of
                      submission of                                                                            SSE AGM                                                             investigation by CMA
                                                              investigation by CMA                                                   policy decision         final cap level
                  merger notice to CMA                                                                         approved                                                           [22 Oct] and completion
                                                                      [May]                                                            by OFGEM                by OFGEM
                          [Feb]                                                                               transaction                                                              of transaction
                                                                                                                                        [23 Aug]              [end of Oct]
                                                                                                                  [Jul]                                                          [exp. end of Q4/Q1 2019]

1 Can vary from DSO to DSO.
Remark: all dates preliminary. Next CfD auctions in UK for wind are scheduled for spring 2019; mentioning of auctions does not imply innogy participation.                                       5
H1 2018
financial update
innogy · H1 2018 results

Adjusted EBIT and adjusted net income down vs H1 2017
but in line with expectations
Adjusted EBIT                                                    Adjusted net income
€ million                                                        € million

    1,725
                                                                    857
                     (12)

                              (34)                                                                          4
                                                                                                 67                    662
                                                                            (172)
                                                                                       (94)

                                                       1,553
                                     (120)     (6)

  H1 2017            RES      G&I    Retail   Corp./   H1 2018    H1 2017   Adj.       Adj.      Adj.
                                                                                                                 1
                                                                                                        Minorities   H1 2018
                                               NB                           EBIT    financial   taxes
                                                                                      result
1 Non-controlling interest.                                                                                                  7
innogy · H1 2018 results
In detail: Retail earnings decline mainly driven by
largely anticipated one-off effects
Adjusted EBIT Retail
€ million
Germany (see p. 21)
595 (89) Lower earnings year on year primarily due to non-
recurrence of positive one-off effects in 2017
Higher expenses for overarching projects, that have
been completed in the first six months impacting H1
2018 disproportionately high
(6) Competitive market environment resulted in expected
(31) net customer losses in H1
6 475
Netherlands / Belgium (see p. 23)
Σ Retail (120) Drop in adjusted EBIT caused in particular by
unexpected commodity price increases driven by cold
weather and related higher gas demand in Q1 2018
Challenging market environment
H1 2017 DE UK NL/BE EE H1 2018
8innogy · H1 2018 results
Adjusted net income down 23% y-o-y to €662m
driven by lower adjusted EBIT and financial result
Reconciliation of adjusted net income Key drivers
H1 2018 adjust- H1 2018 H1 2017 • Non-operating result improved versus prior year due to valuation
€ million
reported ment adjusted adjusted effects of commodity derivatives
Adjusted EBITDA 2,254 - 2,254 2,439 • Costs associated with announced transaction between E.ON and
RWE recognised in non-operating result
Operating D&A (701) - (701) (714)
• Effective tax rate below prior year due to positive effects from
Adjusted EBIT 1,553 - 1,553 1,725 revaluation of deferred tax assets on loss carry forward in the
Non-operating result 90 (90) - - Netherlands
Financial result (278) (114) (392) (298)
Income before taxes 1,365 (204) 1,161 1,427
Taxes on income (306) 16 (290) (357)
Tax rate 22% - 25% 25%
Income 1,059 (188) 871 1,070
Non-controlling
(209) - (209) (213)
interests
Net income 850 (188) 662 857
9innogy · H1 2018 results
Free cash flow lower than in H1 2017
Cash flow statement (extract) Net debt composition (extract)
€ million H1 2018 H1 2017 +/- € billion 30 Jun 2018 31 Dec 2017 +/-
Funds from operations (FFO) 1,972 2,116 (144) Financial assets 4,183 4,086 97
Changes in working capital (1,955) (1,877) (78) Financial liabilities2 18,478 16,378 2,100
Cash flow from operating t/o senior bonds 13,985 12,007 1,978
17 239 (222)
activities (CFOA)
t/o loans from RWE 1,656 1,656 -
Capex1 (900) (660) (240)
t/o loans from EIB 1,040 1,039 1
Proceeds from disposals of
186 152 34 Net financial debt 14,295 12,292 2,003
assets/divestitures
Provisions for pensions and
Free cash flow (697) (269) (428) 3,327 2,986 341
similar obligations3
Dividend payments (1,226) (1,305) 79
Provisions for wind farm
Budget surplus/deficit 358 359 (1)
(1,923) (1,574) (349) decommissioning
Total net debt 17,980 15,637 2,343
Note: rounding differences may occur.
1 Capital expenditure on property, plant and equipment and on intangible assets and on financial assets. This item solely includes capital expenditure with an effect on cash.
2 Adjusted for ‚step-up‘ effect of €763m as of 30 June 2018 and €877 million as of 31 December 2017.
3 Including ‘Surplus of plan assets over benefit obligations‘ of €(340)m as of 30 June 2018 and €(103)m as of 31 December 2017. 10innogy · H1 2018 results
Outlook 2018 confirmed
€ million FY 2018 FY 2017
unless stated otherwise guidance1 reported
Renewables ~350 355
Grid & Infrastructure ~1,850 1,944
Retail2 ~750 827
Adjusted EBIT3 ~2,700 2,816
Adjusted financial result ~(750) (689)
Tax rate for adjusted net income 25-30% 25%
Adjusted net income >1,100 1,224
Dividend 70-80% of ANI €1.60
Net capex4 ~€2.5 bn 1,921
target of
Leverage factor 3.6x
around 4.0x
1 Excluding Retail UK. Any earlier forward-looking statements on Retail UK should be disregarded.
2 Retail no longer includes eMobility. 3 Including Corporate/New Businesses
4 Capital expenditure on property, plant and equipment and on intangible assets, financial assets ./. proceeds from disposal of assets/divestitures and net changes in equity Outlook5 confirmed
(including non-controlling interests). In H1 2018 we changed our capex definition: the figure now includes solely items with an effect on cash (see H1 2018 report p. 10).
Prior-year figures have been adjusted accordingly. 5 As per 14 May 2018. 11Backup
innogy · H1 2018 results · Backup

Renewables

€ million                                           H1 2018            H1 2017                +/-          H1 2018 development
External revenue                                       456                455                  1           •   Lower earnings from photovoltaic EPC contracts in the
                                                       322                338                (16)
                                                                                                               first half of the year, where already contracted margins
Adjusted EBITDA
                                                                                                               will be realized in the second half
Operating depreciation, amortisation                  (155)              (159)                 4           •   Weather-related influences led to lower utilisation of
and impairment losses
                                                                                                               existing plants – especially in the second quarter – but the
Adjusted EBIT                                          167                179                (12)              effect was overcompensated by the commissioning of
                                                                                                               new assets
Capital expenditure1                                   178                162                 16           •   Positive price effects (among others incl. Green
Proceeds from disposal of                                                                                      Certificates and Renewable Obligation Certificates (ROC))
                                                         9                 11                 (2)
assets/divestitures                                                                                            in all strategic business units
Power generation (TWh)                                  4.8                4.7                0.1          •   Full commissioning of onshore wind farm Brechfa Forest
                                                  30 Jun 2018        31 Dec 2017                           •   (57 MW) in Q2 2018

Employees2                                            1,832              1,669                163          Outlook FY 2018
Total capacity (MW)                                   3,571              3,487                84           •   New capacities (additional >200 MW3 expected)
                                                                                                           •   Higher power prices4
                                                                                                           •   Absence of Triton Knoll revaluation gain from 2017
1 Capital expenditure on property, plant and equipment and on intangible assets and on financial assets.   •   Development costs for new projects
2 Converted to full-time positions.
3 Pro-rata view
4 For part of the generation which is not subject to subsidy schemes.                                                                                                         13
innogy · H1 2018 results · Backup
Renewables – we continue to develop value-accretive
growth options to support dividend capacity
Capacity in operation, under construction and under development1
GW, pro-rata 2.7 9.3
Onshore Offshore Hydro Solar/other
3.0
5.5
2.7
1.1 3.6
3.5 0.2
thereof depending on successful auction results:
0.3 1.6 1.9 3.8
30 June 2018 COD 2018-2019 2018-2019 2020-23 Post 2023 Total pipeline
in operation currently under currently under development2
construction
1 As of 30 June 2018. Ramp-up only includes Renewables division. 2 Based on planned commissioning dates, excluding M&A activities and project-specific auctions.
14innogy · H1 2018 results · Backup
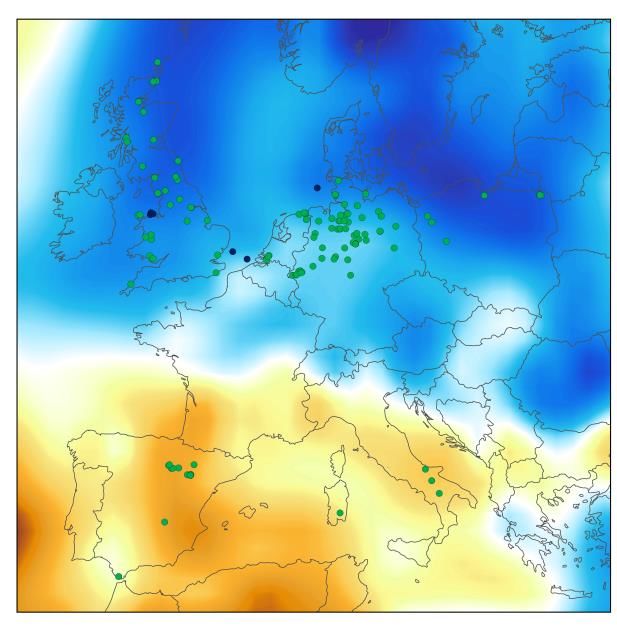
Kaskasi Offshore Wind – FID planned for Q1 2020
Country Germany Amrumbank
West
Technology Offshore Wind
Location Area of c. 17.4 km2, 33 km off the coast of Helgoland
Kaskasi
Planned capacity ~325 MW (turbine type not defined yet)
Ownership 100% innogy1
Mean wind speed 10.1 m/s (at 103 m LAT) Nordsee Ost
Water depths 18 to 25 m (avg. 22 m)
Status/consents Allocated grid connection; converter station existing; BSH Operation Base
application fully submitted, updated in Q1 2019 North Helgoland
FID/construction onshore manufacturing works to begin in 2020, offshore Sea
works from 2021
Commissioning Start of commissioning scheduled for 2022
Support scheme Guaranteed minimum tariff for 20 years after first feed in
(successful bid price provides a floor)
Next steps FID/FC planned for Q1 2020
Netherlands Germany
1 innogy to review all options regarding the future ownership structure.
15innogy · H1 2018 results · Backup Renewables – capacity overview (accounting view) As of 30 June 2018 Megawatt (MW) Onshore Offshore Hydro Biomass Biogas Solar PV Total Germany 634 295 380 5 1 1 1,316 United Kingdom 397 630 83 - - - 1,110 Spain 447 - 12 - - - 459 Netherlands 289 - - - - - 289 Poland 242 - - - - - 242 Italy 90 - - - - - 90 France - - 50 - - - 50 Portugal - - 16 - - - 16 Belgium - - - - - - - Total 2,098 925 541 5 1 1 3,571 Note: Rounding differences may occur. 16
innogy · H1 2018 results · Backup

Renewables – capacity overview (pro-rata view)
As of 30 June 2018
Megawatt (MW)                             Onshore                 Offshore                  Hydro      Biomass   Biogas   Solar PV   Total

Germany                                       550                     340                     355        5         1         1       1,252

United Kingdom                                332                    5851                      83         -        -         -       1,000

Spain                                         443                       -                      10         -        -         6       459

Netherlands                                   289                       -                       -         -        -         -       289

Poland                                        226                       -                       -         -        -         -       226

Italy                                          57                       -                       -         -        -         -        57

France                                          -                       -                      50         -        -         -        50

Portugal                                        3                       -                      15         -        -         -        18

Belgium                                         -                      87                       -         -        -         -        87

Total                                       1,900                   1,012                     513        5         1         7       3,438

1 Does not include 88.2 MW capacity of Galloper as COD of full capacity is expected for August 2018.
Note: Rounding differences may occur.                                                                                                        17
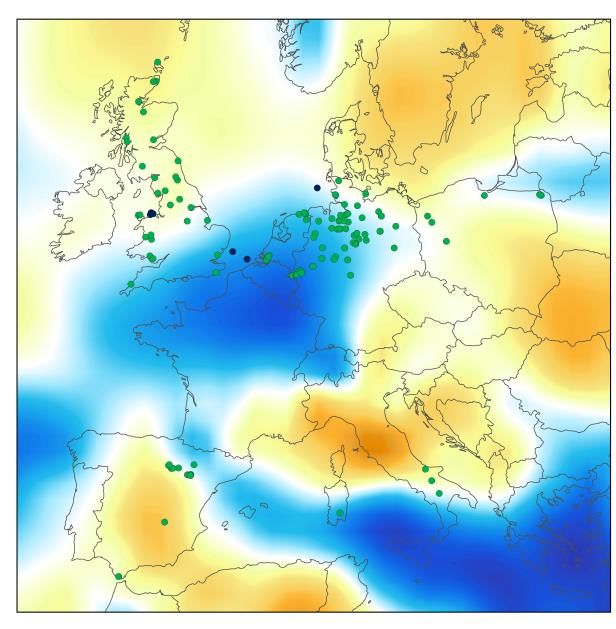
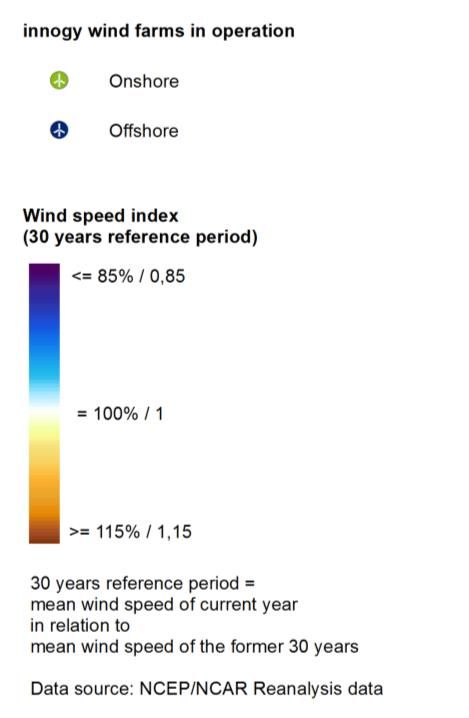
innogy · H1 2018 results · Backup

European wind speed index H1 2018 vs H1 2017
H1 2018                             H1 2017

                                               18
innogy · H1 2018 results · Backup
Grid & Infrastructure – Germany
€ million H1 2018 H1 2017 +/- H1 2018 development
External revenue 3,976 4,958 (982) • Decline in revenue mainly due to new revenue
recognition standard (IFRS 15) concerning the direct
Adjusted EBITDA 1,084 1,098 (14)
marketing of electricity generated from renewable
Operating depreciation, amortisation (321) (315) (6) sources to be applied from 2018 onwards
and impairment losses • Lower adjusted EBIT in German Grid business in particular
Adjusted EBIT 763 783 (20) due to new regulatory period in gas and a lower result
from peakload consumption in the first half of the year
Capital expenditure1 400 251 149 • Earnings from grid sales and provision releases slightly
Proceeds from disposal of higher than in H1 2017
166 101 65
assets/divestitures • Efficiency improvements achieved in H1 2018
30 Jun 2018 31 Dec 2017 •
● Higher headcount mainly due to full consolidation of new
grid co-operation (Regionetz) from 1 January 2018
Employees2 14,598 14,164 434
Outlook FY 2018
• New regulatory period for gas
• Efficiency improvements
1 Capital expenditure on property, plant and equipment and on intangible assets and on financial assets.
2 Converted to full-time positions. 19innogy · H1 2018 results · Backup
Grid & Infrastructure – Eastern Europe
€ million H1 2018 H1 2017 +/- H1 2018 development
External revenue 548 508 40 • Czech Republic: Adjusted EBIT benefited from positive
423 440 (17) price effect stemming mainly from the compensation
Adjusted EBITDA
mechanism for the difference between actual and allowed
Operating depreciation, amortisation (126) (129) 3 revenues, e.g. due to the weather impact in previous
and impairment losses
years. In addition, positive foreign exchange effect
Adjusted EBIT 297 311 (14)
• Hungary: Adjusted EBIT is down due to several smaller
effects, among others impact of cable tax and foreign ex-
Capital expenditure1 127 114 13 change rates
Proceeds from disposal of
assets/divestitures
1 1 - •
● Lower workforce due to reassignment of innogy Česká
republika a.s. to Corporate/New Businesses
30 Jun 2018 31 Dec 2017
Employees2 6,927 7,394 (467)
Outlook FY 2018
• Lower income from Czech gas storage business
1 Capital expenditure on property, plant and equipment and on intangible assets and on financial assets.
2 Converted to full-time positions. 20innogy · H1 2018 results · Backup
Retail – Germany
€ million H1 2018 H1 2017 +/- H1 2018 development
External revenue 8,207 8,623 (416) • Lower earnings year on year primarily due to non-recurrence of
274 361 (87) positive one-off effects in 2017
Adjusted EBITDA
• Higher expenses for overarching projects, that have been
Operating depreciation, amortisation (16) (14) (2)
and impairment losses completed in the first six months impacting H1 2018
258 347 (89) disproportionately high, e.g. for customer retention measures and
Adjusted EBIT
digitalization of our retail business
• Competitive market environment resulted in expected net
Capital expenditure1 24 17 7
customer losses in H1
Proceeds from disposal of
- 17 (17)
assets/divestitures
30 Jun 2018 31 Dec 2017 Outlook FY 2018
Employees2 4,119 4,159 (40) • Lower impact from non-operational effects
• Margin pressure from customer losses and higher
competition
• Efficiency improvements
Note: Retail no longer includes eMobility.
1 Capital expenditure on property, plant and equipment and on intangible assets and on financial assets.
2 Converted to full-time positions. 21innogy · H1 2018 results · Backup
Retail – United Kingdom
€ million H1 2018 H1 2017 +/- H1 2018 development
External revenue 3,666 3,636 30 • The impact on earnings of net customer losses and
7 33 (26) regulation driven costs was widely offset by gains in
Adjusted EBITDA
customers with higher consumption and delivery of the
Operating depreciation, amortisation (25) (45) 20 recovery plan
and impairment losses
(18) (12) (6) •
● Note: as of Q3 2018 our UK retail business will be shown
Adjusted EBIT
as discontinued operations due to the positive vote of
SEE’s shareholders in favor of the merger
Capital expenditure1 29 25 4
Proceeds from disposal of
- - -
assets/divestitures
30 Jun 2018 31 Dec 2017 Outlook FY 2018
Employees2 6,200 6,382 (182) •
● Retail UK no longer included in the outlook for adjusted
EBIT and adjusted net income and to be accounted for as
‘discontinued operations’ as of Q3
1 Capital expenditure on property, plant and equipment and on intangible assets and on financial assets.
2 Converted to full-time positions. 22innogy · H1 2018 results · Backup
Retail – Netherlands/Belgium
€ million H1 2018 H1 2017 +/- H1 2018 development
External revenue 1,956 1,653 303 • Drop in adjusted EBIT caused in particular by unexpected
114 143 (29) commodity price increases driven by cold weather and
Adjusted EBITDA
related higher gas demand in Q1 2018
Operating depreciation, amortisation (24) (22) (2)
and impairment losses • Challenging market environment remains due to strong
90 121 (31) competitive pressure
Adjusted EBIT
Capital expenditure1 42 20 22
Proceeds from disposal of
1 13 (12)
assets/divestitures
30 Jun 2018 31 Dec 2017 Outlook FY 2018
Employees2 2,514 2,346 168 • Adverse cold weather impact in Q1 2018
• Intensified competition
• Efficiency improvements
1 Capital expenditure on property, plant and equipment and on intangible assets and on financial assets.
2 Converted to full-time positions. 23innogy · H1 2018 results · Backup
Retail – Eastern Europe
€ million H1 2018 H1 2017 +/- H1 2018 development
External revenue 1,770 1,774 (4) • Stable development across all markets
Adjusted EBITDA 154 149 5
Operating depreciation, amortisation (9) (10) 1
and impairment losses
Adjusted EBIT 145 139 6
Capital expenditure1 16 6 10
Proceeds from disposal of
- - -
assets/divestitures
30 Jun 2018 31 Dec 2017 Outlook FY 2018
Employees2 2,578 2,534 44 • Normalised weather conditions
1 Capital expenditure on property, plant and equipment and on intangible assets and on financial assets.
2 Converted to full-time positions. 24innogy · H1 2018 results · Backup
Retail – B2C customer number development
Total B2C customers (‘000) thereof: electricity customers (‘000)
Germany Eastern Europe NL/BE UK (1.0)% (0.9)%
15,789 15,631 15,496
2,799 2,737 2,605
(1.1)% (1.4)%
22,387 22,155 2,336 2,297 2,269
21,850
4,091 4,105 4,128
4,727 4,612 4,376
6,563 6,492 6,493
4,349 4,277 4,221 31 Dec 17 31 Mar 18 30 Jun 18
thereof: gas customers (‘000)
5,502 5,522 5,516
6,608 (1.3)% 6,525 (2.6)% 6,354
1,929 1,876 1,770
2,012 1,980 1,952
7,819 7,744 7,736
1,411 1,418 1,388
1,256 1,251 1,243
31 Dec 17 31 Mar 18 30 Jun 18 31 Dec 17 31 Mar 18 30 Jun 18
25innogy · H1 2018 results · Backup
Retail – External electricity sales volume H1 2018
Residential and commercial Industrial and corporate
Distributors Total
customers customers
TWh 2018 2017 2018 2017 2018 2017 2018 2017
Renewables - - - - 4.5 4.4 4.5 4.4
G&I Germany 0.2 0.2 0.2 0.2 6.3 6.6 6.7 7.0
G&I Eastern Europe - - - - - - - -
Retail Germany 10.0 10.5 11.9 13.7 63.2 54.5 85.1 78.7
Retail UK 5.8 5.6 13.1 13.6 1.1 1.1 20.0 20.3
Retail NL/BE 4.2 4.4 2.6 2.7 - - 6.8 7.1
Retail Eastern Europe 5.3 5.3 6.4 6.1 0.8 0.9 12.5 12.3
Total 25.5 26.0 34.2 36.3 75.9 67.5 135.6 129.8
26innogy · H1 2018 results · Backup
Retail – External gas sales volume H1 2018
Residential and commercial Industrial and corporate
Distributors Total
customers customers
TWh 2018 2017 2018 2017 2018 2017 2018 2017
G&I Germany 0.1 0.1 0.1 0.1 0.7 1.1 0.9 1.3
G&I Eastern Europe - - - - - - - -
Retail Germany 13.8 15.1 8.4 9.5 22.9 26.8 45.1 51.4
Retail UK 18.4 16.0 1.9 1.8 4.1 3.7 24.4 21.5
Retail NL/BE 18.4 18.3 12.1 13.2 - - 30.5 31.5
Retail Eastern Europe 8.6 9.5 12.3 12.3 1.4 0.5 22.3 22.3
Total 59.3 59.0 34.8 36.9 29.1 32.1 123.2 128.0
27innogy · H1 2018 results · Backup
Corporate/New Businesses – Corporate/other
€ million H1 2018 H1 2017 +/- H1 2018 development
Adjusted EBITDA (104) (100) (4) •
● Higher headcount due to reassignment of innogy Česká
republika a.s. from Grid & Infrastructure Eastern Europe
Operating depreciation, amortisation (23) (19) (4)
and impairment losses
Adjusted EBIT (127) (119) (8)
Capital expenditure1 26 59 (33)
Proceeds from disposal of
9 9 -
assets/divestitures
30 Jun 2018 31 Dec 2017
Employees2 4,120 3,592 528
1 Capital expenditure on property, plant and equipment and on intangible assets and on financial assets.
2 Converted to full-time positions. 28innogy · H1 2018 results · Backup
Corporate/New Businesses – eMobility
€ million H1 2018 H1 2017 +/- H1 2018 development
Adjusted EBITDA (14) (6) (8) • Higher operating expenditures to ramp up our national
and international eMobility activities
Operating depreciation, amortisation (2) (1) (1)
and impairment losses • Steady increase of staff reflects our growth ambitions
Adjusted EBIT (16) (7) (9)
Capital expenditure1 28 1 27
Proceeds from disposal of
- - -
assets/divestitures
30 Jun 2018 31 Dec 2017
Employees2 110 92 18
1 Capital expenditure on property, plant and equipment and on intangible assets and on financial assets.
2 Converted to full-time positions. 29innogy · H1 2018 results · Backup
Corporate/New Businesses – Innovation Hub
€ million H1 2018 H1 2017 +/- H1 2018 development
Adjusted EBITDA (6) (17) 11 • Adjusted EBIT reflects an increase in the value of financial
investments
Operating depreciation, amortisation - - -
and impairment losses • Operational expenditures have been significantly reduced
Adjusted EBIT (6) (17) 11 by focusing on acceleration investments with higher
maturity levels, i.e. from late seed stage to series C and D
in 2018 and growth of portfolio companies
Capital expenditure1 30 5 25
Proceeds from disposal of
- - -
assets/divestitures
30 Jun 2018 31 Dec 2017
Employees2 42 61 (19)
1 Capital expenditure on property, plant and equipment and on intangible assets and on financial assets.
2 Converted to full-time positions. 30innogy · H1 2018 results · Backup
Refinancing needs between €1bn and €2bn per annum
in the coming years
Maturity profile of bonds and loans as of 30 June 2018 (€ billion) Total bonds and loans of ~€17bn:
• t/o senior bonds of innogy SE/ Finance B.V. of
7 Maturities of loans from RWE AG (lhs) 18
~€14bn
Maturities of loans from EIB (lhs) 16
6 • t/o loans from RWE AG of ~€2bn
Maturities of senior bonds (lhs) 14
5 Total outstanding bonds and loans (rhs) 12
• t/o EIB loans of ~€1bn
4 10
3 8 innogy’s issuances since the IPO:
6 • First senior bond in April 2017
2
4 (€750m, 1%, maturity 2025)
1 2 • First green bond in October 2017
0 0 (€850m, 1.25%, maturity 2027)
2018 2019 2020 2021 2022 2023 2024 2025 2026 2027+
• Senior bond in January 2018
Cumulative maturities (€1,000m, 1.50%, maturity 2029)
As of 30 June 2018 2018-2020 2021-2023 2024-2026 2027+ • Senior bond in May 2018 - tapped in July 2018 -
(€750m, 0.75%, maturity 2022)
Senior bonds and RWE + EIB loans (€bn) 5.0 3.7 2.1 6.0 • Senior bond in May 2018
% of total debt 30% 22% 12% 36% (€500m, 1.625%, maturity 2026)
31innogy · H1 2018 results · Backup
Overview of senior bonds and loans
As of 30 June 2018, by maturity
Senior bonds Loans from RWE5
Notional Carrying amount Notional
Carrying amount
Issuer amount (in EUR million) Coupon Maturity Instrument amount Coupon Maturity
(in EUR million)
(LCY1, million) (LCY1, million)
innogy Finance B.V. EUR 980 984 5.13% Jul 18 Intercompany loan6 EUR 956 956 0.56% Mar 19
innogy Finance B.V. EUR 1,000 1,033 6.63% Jan 19 EUR 700 700 0.86% Oct 20
Intercompany loan6
innogy Finance B.V. EUR 750 759 1.88% Jan 20
Total 1,656 0.69%4
innogy Finance B.V. GBP 570 694 6.50% Apr 21
innogy Finance B.V. EUR 1,000 1,149 6.50% Aug 21
innogy Finance B.V. GBP 500 601 5.50% Jul 22
innogy Finance B.V. EUR 500 498 0.75% Nov 22
innogy Finance B.V. GBP 488 590 5.63% Dec 23
innogy Finance B.V. EUR 800 837 3.00% Jan 24 Loans from EIB
innogy Finance B.V. EUR 750 745 1.00% Apr 25 Notional
Carrying amount
innogy Finance B.V. EUR 500 498 1.63% May 26 Instrument amount Coupon Maturity
(in EUR million)
innogy Finance B.V. EUR 850 840 1.25% Oct 27 (LCY1, million)
innogy Finance B.V. EUR 1,000 985 1.50% Jul 29 EIB loan EUR 645 690 3.23% Oct 20
innogy Finance B.V. GBP 760 941 6.25% Jun 30 GBP 350 405 2.14% Feb 23
EIB loan
innogy Finance B.V. EUR 600 724 5.75% Feb 33
Total 1,095 2.82%4
innogy SE USD 28 24 3.80% Apr 33
innogy Finance B.V. GBP 600 635 4.75% Jan 34 thereof: step-up effect 55
innogy SE EUR 468 511 3.50% Oct 37
innogy Finance B.V. GBP 1,000 1,213 6.13% Jul 39
innogy SE JPY 20,0002 182 4.76%3 Feb 40
innogy SE EUR 100 100 3.50% Dec 42
innogy SE EUR 150 150 3.55% Feb 43
Total 14,693 4.21%4
thereof: step-up effect 708
Note: Rounding differences may occur. 1 Local currency. 2 Swapped in Euro: JPY20,000m in €159m. 3 Interest rate after swap in Euro. 4 Notional-weighted average coupon.
5 One additional loan of €18m not included. 6 Related to hybrids issued by RWE. 32innogy · H1 2018 results · Backup
IR contacts
Verena Nicolaus-Kronenberg
T +49 152 0933 1400 Holger Perlwitz
Tobias Harburg
verena.nicolaus-kronenberg@innogy.com Fixed Income
T +49 162 2969 560
T +49 162 2843 044
tobias.harburg@innogy.com
holger.perlwitz@innogy.com
Britta Wöhner Martin Jäger
T +49 152 5460 7527 T +49 162 2754 355
britta.woehner@innogy.com martin.jaeger@innogy.com
Sandra Schuck
T +49 172 2982 483 33
sandra.schuck@innogy.cominnogy · H1 2018 results · Backup
Financial calendar
13/11/2018 9M results 2018
13/03/2019 Annual report 2018
30/04/2019 Annual General Meeting 2019
14/05/2019 Q1 results 2019
09/08/2019 H1 results 2019
34You can also read