Full Year Results Presentation 2018 - Paul Fineman, CEO and Giles Willits, CFO - IG Design Group Plc
←
→
Page content transcription
If your browser does not render page correctly, please read the page content below

Full Year Results Presentation 2018
                    Presented by
     Paul Fineman, CEO and Giles Willits, CFO
CONTENTS

1.                    2.                                    3.

 Highlights            Review of                            Future
 2018                  Financial                            Growth
                       Performance                          Drivers

IG Design Group plc   FULL YEAR RESULTS PRESENTATION 2018
                                                                      2
[HEADING]

Highlights
2018

IG Design Group plc   FULL YEAR RESULTS PRESENTATION 2018
                                                            3
ANOTHER YEAR OF SIGNIFICANT PROGRESS
Success delivered through:

 Growth                 Investment                            Innovation
 across all regions     at record levels                      in product
                        driving efficiency                     development and in
                        and streamlining                      delivering excellent
                        processes                             customer service

 Acquisition            Financial
 of Biscay in January   another year of
 2018 and successful    delivering promises
 initial phase of       to shareholders
 integration

IG Design Group plc            FULL YEAR RESULTS PRESENTATION 2018
                                                                                     4
OUR PROMISES DELIVERED

 Underlying EPS(a)                                                       Average leverage(b)                                                    Dividend
 (pence)                                                                                                                                        (pence)

 Target double digit three year                                          Sustain average leverage                                               Trend to 2.5x covered
 CAGR in underlying EPS                                                  between 1.5x and 2.5x

                                                  21.8                         4.6                                                                                                           6.0
                                                                                          4.1
                                       18.2
                                                                                                                                                                                      4.5
                                                                                                     3.2
                            13.2
                  11.5
                                                                                                               2.3
        8.4                                                                                                                                                                 2.5
                                                                                                                          1.5

                                                                                                                                                                 1.0
                                                                                                                                                       —

       2014       2015       2016       2017      2018                         2014      2015       2016       2017       2018                        2014       2015      2016       2017   2018

      +20% on 2017                                                           Improved by 35%                                                         +33% on 2017
(a) Underlying fully diluted earnings per share before exceptional items and LTIP charges. Fully diluted earnings per share stated after exceptional gain of 1.4p (2017: 0.4p cost)
    and LTIP charges of 2.7p (2017: 2.8p) is 20.5p (2017: 15.0p).
(b) Average leverage is calculated as average monthly net debt divided by EBITDA before exceptional items and LTIP charges.

IG Design Group plc                                                   FULL YEAR RESULTS PRESENTATION 2018
                                                                                                                                                                                                    5
GROUP REVENUE THROUGH DIVERSITY

 By customer destination                                                      By category

                                                                             74%                                           13%           10%            3%
                                                                             Celebrations                                  Giftware     Stationery(a)   NFR(b)

                                  ROW
                      Australia   £6.4m                                       By season
                                  2%
                      £36.9m                                                 51%                                          45%                       4%
                      11%                                                                                                                           Minor
                                                                             Christmas                                    Everyday                  Seasons

           Europe
                                        USA
           £58.1m                       £136.8m
                                                                              By brand
           18%                          42%                                  51%                                          49%
                                                                             Designed for you/Customer bespoke            Design Group/Licensed brands
                          UK
                          £89.3m                                              By activity
                          27%
                                                                             38%                                62%
                                                                             Manufactured                       Sourced
                                                                            (a) Stationery and Creative Play.
                                                                            (b) “Not-for-resale” bags.

IG Design Group plc                           FULL YEAR RESULTS PRESENTATION 2018
                                                                                                                                                            6
WHO WE SELL TO
Our large customer base includes the following retailers:

                           15                           19                          11              28
                           years                        years                       years           years

                           21                           30                          4               15
                           years                        years                       years           years

                           20                           11                          31              35
                           years                        years                       years           years

                           15                           15                          13              29
                           years                        years                       years           years

                           25                           11                          7               16
                           years                        years                       years           years

                      UK           Europe                     USA           Australia       World

IG Design Group plc                   FULL YEAR RESULTS PRESENTATION 2018
                                                                                                         7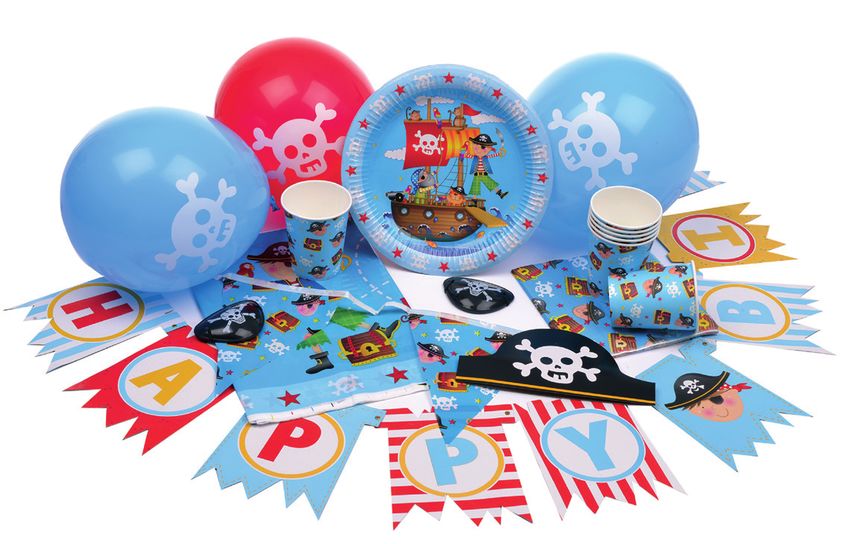
SOME KEY FACTS

 100 million cards, 100 million                  No. 3 in the global gift             Balanced business with
 gift bags and over 1 billion                    packaging and greetings              27% of sales by destination
 metres of gift wrap sold in                     market worth an estimated            in UK and with 73% in
 2017/18                                         £15 billion(a) at retail value       other markets

 Trading with over 10,000                        Present in over 200,000              Over 650 million units sold
 customers worldwide                             retail outlets in more than
                                                 80 countries

(a) All source: Global Industry Analysis Inc.

IG Design Group plc                             FULL YEAR RESULTS PRESENTATION 2018
                                                                                                                    8
[HEADING]

Review of
Financial
Performance

IG Design Group plc   FULL YEAR RESULTS PRESENTATION 2018
                                                            9
FINANCIAL HIGHLIGHTS

 Revenue                                                                   Underlying profit                                                         Net cash/(debt)
 (£m)                                                                      (£m)    (a)                                                               (£m)

                                                   327.5                                                                      21.4                                                            4.4
                                                                                                                                                                                       3.0
                                        311.0

                                                                                                                   16.3
                  229.0      237.0                                                                                                                                            (17.5)
       224.5

                                                                                                                                                                     (29.4)
                                                                                                       10.8
                                                                                             9.2
                                                                                  7.6

                                                                                                                                                          (36.9)

       2014       2015        2016       2017       2018                         2014       2015       2016       2017       2018                         2014       2015     2016     2017   2018

      +5% on 2017                                                               +32% on 2017                                                             +£1.4m on 2017
(a) Underlying profit is stated before tax, exceptional items and LTIP charges. Profit before tax stated after exceptional profit of £0.5 million (2017: £1.1 million loss)
    and LTIP charges of £2.2 million (2017: £2.2 million) is £19.7 million (2017: £13.0 million).

IG Design Group plc                                                     FULL YEAR RESULTS PRESENTATION 2018
                                                                                                                                                                                                     10
SUMMARY OF FULL YEAR RESULTS
Year ended Year ended
31 March 31 March
2018 2017 Growth
£m £m %
Sales 327.5 311.0 5
Gross profit 70.0 63.9 9
Overheads (47.6) (46.6) 2
Other income 0.4 0.2
EBITDA (pre‑exceptional items and LTIP) 28.0 22.4 25
Operating profit 22.8 17.5 30
Finance costs (1.4) (1.2) 13
Profit before tax, exceptional items and LTIP 21.4 16.3 32
LTIP (2.2) (2.2)
Exceptional items 0.5 (1.1)
Profit before tax 19.7 13.0 51
Sales/profit before tax Overhead costs Underlying effective tax rates(a)
28.3%
Sales % PBT, EI % Sales Overheads % of 22.5% 24.2% 23.9%
£m change & LTIP change £m £m sales 20.0%
2016/17 311.0 16.3 2016/17 311.0 46.6 15.0
Underlying growth 18.1 5.8 5.5 34.5 Underlying increase 18.1 1.1 6.3
FX translation (1.6) (0.5) (0.4) (2.8) FX impact (1.6) (0.1)
2017/18 327.5 5.3 21.4 31.7 2017/18 327.5 47.6 14.5 2015 2016 2017 2018 2019(b)
(a) Underlying effective tax rate is stated before the effect
of exceptional items and LTIP charges.
(b) Forecast.
IG Design Group plc FULL YEAR RESULTS PRESENTATION 2018
11ON TRACK TO DELIVER GROUP MARGIN TARGETS
Sales Profit Margin
Group revenue 2018 2017 Growth 2018 2017 Growth 2018 2017
38% UK & Asia £m 123.3 117.0 5.4% 7.9 7.5 5.6% 6.4% 6.4%
37% Americas $m 158.8 151.6 4.8% 12.3 9.1 34.6% 7.8% 6.0%
16% Europe €m 58.5 53.1 10.1% 7.5 5.8 29.0% 12.9% 11.0%
11% Australia AU$m 63.1 57.4 10.0% 4.9 2.9 68.4% 7.8% 5.1%
(2%) Elims/Central costs £m (4.8) (3.1) — (4.0) (4.1) — — —
100% Total 327.5 311.0 5.3% 22.8 17.5 30.4% 7.0% 5.6%
(a) Segmental profit is calculated as operating profit before exceptional items, LTIP charges and management recharges.
• Segmental profit(a) increased 30.4% to £22.8 million • Europe increased margin to 12.9% with strong
driven by progress across all regions revenue growth and well executed efficiency
• Margin up 1.4 percentage points reflecting product • Australia benefited from a major new contract
mix toward higher margin product categories and increased activity
• Americas profit up 34.6% with significant progress • UK increased profit in higher margin product
from creative play product category category resulting in profit growth of 5.6%
supported by increased revenue reflecting new
leadership team focus
IG Design Group plc FULL YEAR RESULTS PRESENTATION 2018
12STRONG CASH CONVERSION FUNDING GROWTH INVESTMENT
Year ended Year ended
31 March 31 March
2018 2017
£m £m
EBITDA(a) 28.0 22.4
Change in trade and other receivables (9.1) (0.8)
Change in inventory 0.4 2.7
Change in creditors, provisions and accruals 3.3 8.2
Exceptional items (0.5) (0.7)
LTIP charges (0.4) (0.3)
Cash generated from operations 21.7 31.5
Proceeds from sale of property, plant and equipment (exceptional) 2.6 0.1
Net capital expenditure (9.4) (5.1)
Business acquired (5.1) (2.7)
Tax paid (3.1) (2.0)
Interest paid (1.5) (1.9)
Dividends paid to non-controlling interests (0.6) (0.9)
Equity dividends paid (3.0) (2.1)
Proceeds from issue of share capital 0.1 5.1
Other (0.3) (1.5)
Movement in net cash 1.4 20.5
Opening net cash/(debt) 3.0 (17.5)
Closing net cash 4.4 3.0
(a) Before exceptional items and LTIP charges
Net cash reconciliation 2017/18
EBITDA Working capital
Capex
(£5.4m)
Acquisitions
Tax, interest,
(£9.4m) NCI Net cash
Net cash Equity 31 March 2018
31 March 2017 dividend paid Exceptionals
(£5.1m)
and LTIP
Other reasons
(£5.2m)
£3.0m £28.0m (£3.0m) (£0.2m) £1.7m £4.4m
IG Design Group plc FULL YEAR RESULTS PRESENTATION 2018
13BALANCE SHEET
As at As at
31 March 31 March Freehold property
2018 2017
£m £m Sale of excess warehousing at Hirwaun site
Intangibles 36.5 33.7 delivers exceptional gain of £1.1 million,
comprising sale proceeds net of related costs
Fixed assets 35.5 32.6
for the rationalisation of operations to suit the
Stock 49.3 49.5 revised footprint
Trade and other receivables 37.5 29.9
Net cash 4.4 3.0
Return on capital employed(a)
Trade and other payables (59.2) (57.8)
22.2%
Deferred income and provisions (2.4) (2.5)
Taxation (1.1) 1.7
Net assets 100.5 90.1
16.9%
Attributable to shareholders 96.9 86.2
15.0%
12.8%
2015 2016 2017 2018
(a) Return on capital employed is calculated as PBIT divided
by monthly average net capital employed (excludes cash
and intangibles).
IG Design Group plc FULL YEAR RESULTS PRESENTATION 2018
14FLEXIBLE FACILITIES IMPROVE INTEREST COVER AND LEVERAGE
As at
31 March
Lender Renewal 2018 Margin Covenant
HSBC Corporate revolving credit facility and overdraft 2021 £18m 0.95% Leverage
Working capital revolving credit facility Annual £40m 0.80% Stock and unfunded debtors
UK/Europe receivables financing 2019 £50m 1.10% Receivables
USA receivables financing 2019 $75m 1.10% Receivables
Asia receivables financing 2019 $18m 1.30% Receivables
Westpac Biscay Loan 2023 AU$9m 1.80% Capital ratio
Overdraft Annual AU$10m 1.95% Capital ratio
Interest cover Average net debt EBITDA
(£m) (£m)
16.4 28.0
(69.3) (66.3) (55.1) (51.1) (41.9)
14.2
22.4
17.4
16.3
15.2
4.9
4.4
3.4
2014 2015 2016 2017 2018 2014 2015 2016 2017 2018 2014 2015 2016 2017 2018
IG Design Group plc FULL YEAR RESULTS PRESENTATION 2018
15MANAGING OUR CHALLENGES
Be
Have a Have a Sustain
resilient Combatting
Challenge robust reliable De-risk FX and nurture
to macro cost
supply customer movements capable
economic headwinds
chain base leadership
factors
• Use our global • Low customer • Continue to • A portfolio of • Operating in local • Give our people
scale when we concentration offer great responses: currencies the knowledge
buy across multiple value through • Leverage • Natural $ hedging and tools they
• Optimal geographies innovation and overall scale • Active hedging need
allocation of • Appropriate design • Innovation policy • Add strength and
purchasing controls on • Resilient product • Re-engineering depth to what
across supplier customer credit categories products we do
base lines • Balance of • Good teams
• Product mix
• Focus on freight, • New channels business make us stronger
Response tariffs and FX as and customer across multiple
• Negotiation
(suppliers and
well as price relationships categories
customers)
• Increasing being developed • Products tailored
• Selling
awareness of to circumstances
category
costs of failing
solutions
to deliver on
time, and • Channel
non‑compliance diversity
• Manage locally, • Selective price
with people on increases
the ground albeit on a
phased basis
Current status
– our view
IG Design Group plc FULL YEAR RESULTS PRESENTATION 2018
16OUR FUTURE PROMISES
Growth: Returns: Risk:
Underlying EPS growth Dividend policy Average leverage
OUR OBJECTIVES
Target double digit three year Trend to 2.5x covered Sustain long term between
CAGR in underlying EPS (40% pay-out) 1.5x and 2.5x
Through organic growth with Out-performance supports Provides capacity to invest
acquisitions adding incremental
accelerated distributions opportunistically
opportunity
Return on capital
Gross margin PBIT employed
OUR LEVERS
Sustain at 20% 8% of sales or Target 20%
of sales or higher higher in each business overall or better
Invest to Efficiencies, scale and Focus on improving working capital
sustain progress higher margin categories ratios in each of our businesses
IG Design Group plc FULL YEAR RESULTS PRESENTATION 2018
17[HEADING]
Future
Growth
Drivers
IG Design Group plc FULL YEAR RESULTS PRESENTATION 2018
18GROUP DEVELOPMENT – TIME FOR GROWTH
Underlying EPS(a)
Growth
Transformation
EPS
Recovery
2008 2014 2018
8.4p 21.8p
(13.9p)
(a) Underlying fully diluted earnings per share before exceptional items and LTIP charges.
IG Design Group plc FULL YEAR RESULTS PRESENTATION 2018
19BUILDING ON OUR STRENGTHS
Our capabilities Product categories
A broad
portfolio
Stationery and creative play
Low Geographic
cost diversity
‘Not-for-resale’ bags
Strong Award
offering winning
service
Celebrations
Giftware
Audited Design & Customer
compliance innovation relationships
IG Design Group plc FULL YEAR RESULTS PRESENTATION 2018
20LEVERAGING MARKET OPPORTUNITIES
TRENDS OPPORTUNITIES
MARKET • Consumers expect innovation and value
in core categories
• Increasing number of occasions to celebrate
• Working with the winners
throughout the year • Design and innovation
• Efficiency and scale
CUSTOMER • Mass, discounter and specialist experiential retailers
outpacing competition
• Customers consolidating their supplier relationships
TECHNOLOGY • Online shopping changing consumers’ purchase habits
• Access to consumer insight driving improved retail
execution
INDUSTRY • The pressure of raw material inflation and increased
environmental compliance creating opportunities
within fragmented supplier base
IG Design Group plc FULL YEAR RESULTS PRESENTATION 2018
21DELIVERING GROWTH
WORKING WITH THE WINNERS DESIGN AND INNOVATION EFFICIENCY AND SCALE
• Organic growth with existing and new • Developing in new channels and • Driving margins through investment in
customers, suppliers and product adjacent product categories process and people
categories • Expanding in the growing number of • Accretive M&A opportunities to unlock
events celebrated throughout the year synergies and strengthening our
‘one-stop-shop’ position with customers
Progress in the year Progress in the year Progress in the year
• Sales to our top ten customers grew an • Introduced new category in • Investment in a state-of-the-art
average of 13% year on year ‘not‑for‑resale’ paper bags for the printing press in Holland
• Volumes of gift wrap grew by 9%, fashion and beauty industry • Acquisition of Biscay Greetings Pty Ltd
gift bags sold grew by 18% and single • Launched Anker Play Products in
greetings cards sold grew by 25% the US
IG Design Group plc FULL YEAR RESULTS PRESENTATION 2018
22M&A OPPORTUNITIES
KEY AREAS OF OPPORTUNITY
CATEGORY
CONSOLIDATION
RELATED/ADJACENT
PRODUCT CATEGORIES
FOCUSED EARNINGS PER
SHARE ACCRETION FOR
SHAREHOLDERS THROUGH
NEW CHANNELS • Synergies through
economies of scale
• One-stop-shop for
our customers
NEW REGIONS
IG Design Group plc FULL YEAR RESULTS PRESENTATION 2018
23WHY INVEST?
We will continue to drive organic growth, through our diversified business
operating across regions, categories, channels, seasons and brands
We will enhance net margins through investment – driving efficiency,
streamlining processes and attracting best talent
We will continue to drive innovation, deliver excellent service and remain
our customers’ ‘Partner of Choice’
We will discerningly pursue M&A opportunities supported by our
strong balance sheet to deliver incremental growth
We will continue to convert profit into cash and deliver
dividend growth through earnings progression
IG Design Group plc FULL YEAR RESULTS PRESENTATION 2018
24[HEADING]
Appendix
IG Design Group plc FULL YEAR RESULTS PRESENTATION 2018
25‘NOT-FOR-RESALE’ BAGS
Produced in the UK as from September 2017
New channel development drives organic growth • Design Group commenced supply of bags
• Bags with handles represent 48% of a retailers produced in our China factory in FY16
‘not‑for‑sale’ consumables spend and has now commenced UK production
in September 2017
• In the UK £130 million (700 million) bags are given
• Deploying expertise in:
away annually by retailers (a further 1.4 billion
• design
plastic bags are also given away)
• printing and assembling
• Legislation is rapidly ‘converting’ demand from • compliance
plastic to paper bags • quality
• logistics
• To develop an exciting new growth opportunity
IG Design Group plc FULL YEAR RESULTS PRESENTATION 2018
26MAJOR INVESTMENTS
July 2016
Acquisition of Lang
June 2016
Anker Play Products September 2017
established, USA Investment bag
machine, UK
April 2015
Paper conversion
machine, USA
July 2014
January 2018
Acquisition
Acquisition of Biscay
of Enper
March 2014
Major investment in Wales completed
March 2012
Netherland printer operational
2012 2013 2014 2015 2016 2017 2018
EPS (a)
6.7p 7.8p 8.4p 11.5p 13.2p 18.2p 21.8p
(a) Underlying fully diluted earnings per share before exceptional items and LTIP charges.
IG Design Group plc FULL YEAR RESULTS PRESENTATION 2018
27OUR ENVIRONMENTAL & CORPORATE RESPONSIBILITY
Across all territories, we comply with the highest standards
in the market to ensure we can prove our commitment to
looking after our customers, our staff and our planet.
Accreditations include: Employee engagement
Our team was recognised with a
‘Highly Commended’ award in the
Employee Engagement Awards
2017, in the Company of the
Year category.
This presentation cover is printed on GF Smith Extract. Each printers’ sheet contains at least five upcycled coffee cups
and is produced using a zero waste process meaning the more Extract paper used, the fewer cups go to landfill or incineration.
Design Group is proud to utilise this unique collaboration between consumer, recycler and papermaker in the 2018 presentation.
IG Design Group plc FULL YEAR RESULTS PRESENTATION 2018
28OUR REGIONAL BUSINESS LEADERS
Paul Fineman Giles Willits
Group CEO Group CFO
Lance Burn
MD – UK & China
Joost Bogers Ron Vroegindeweij
MD – Europe – MD – Europe –
Celebrations Gifting
Gideon Schlessinger
CEO – Americas
Frank Pynakker
CEO – Australia
IG Design Group plc FULL YEAR RESULTS PRESENTATION 2018
29LARGEST SHAREHOLDERS(c)
Hedlund Family(a) Miton Group Paul E Fineman(b) Schroders Plc
35.08% 7.97% 7.24% 5.81%
Octopus Close Brothers AM Mr N Fisher & Family Hargreave Hale Ltd
4.49% 4.33% 3.94% 3.01%
(a) In addition to the Hedlund Family’s beneficial interest set out above the Hedlund family is also interested in a further 1,150,790 ordinary shares, representing a further 1.80% of the current
issued share capital of the Company. These ordinary shares are held by West Coast Trust, a trust for the benefit of Anders Hedlund’s adult children, which holds 900,790 ordinary shares and Claes
Hedlund, Anders Hedlund’s brother, who owns 250,000 ordinary shares. In total the Hedlund family is interested in 23,568,994 ordinary shares, representing 36.89% of the current issued share
capital of the Company.
(b) This includes a non-beneficial interest in 174,608 ordinary shares at 5p each.
(c) Shareholdings as at 31 March 2018.
IG Design Group plc FULL YEAR RESULTS PRESENTATION 2018
30You can also read