Florida: An Economic Overview - August 31, 2021
←
→
Page content transcription
If your browser does not render page correctly, please read the page content below
Florida:
An Economic Overview
            August 31, 2021   Presented by:

                              The Florida Legislature
                              Office of Economic and
                                   Demographic Research
                              850.487.1402
                              http://edr.state.fl.us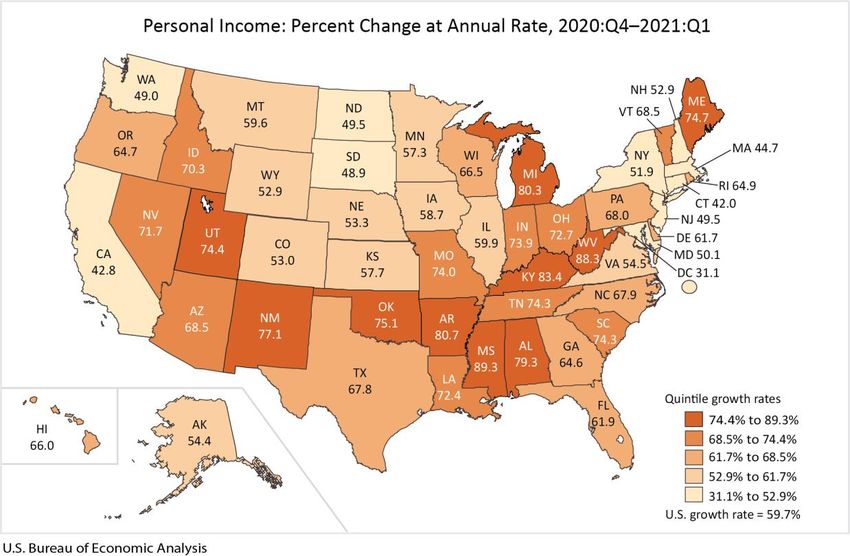
Coronavirus Impact on Florida GDP...
For the 2018 calendar year,
Florida had 3.8 percent growth
in Real Gross Domestic Product
(GDP). For 2019, Florida’s
growth slowed from the prior
year, but remained above the
national average (2.8 percent
in Florida versus 2.2 percent in
the US). Translating the data
into the state’s fiscal year,
Florida grew 3.3 percent in
Fiscal Year 2018-19 and was
expected to grow 2.5 percent in
Fiscal Year 2019-20 at the
Conference held immediately
before the pandemic. Through
the first half of the 2019-20
fiscal year, the data showed
that the state was on track to
match that Conference
projection.
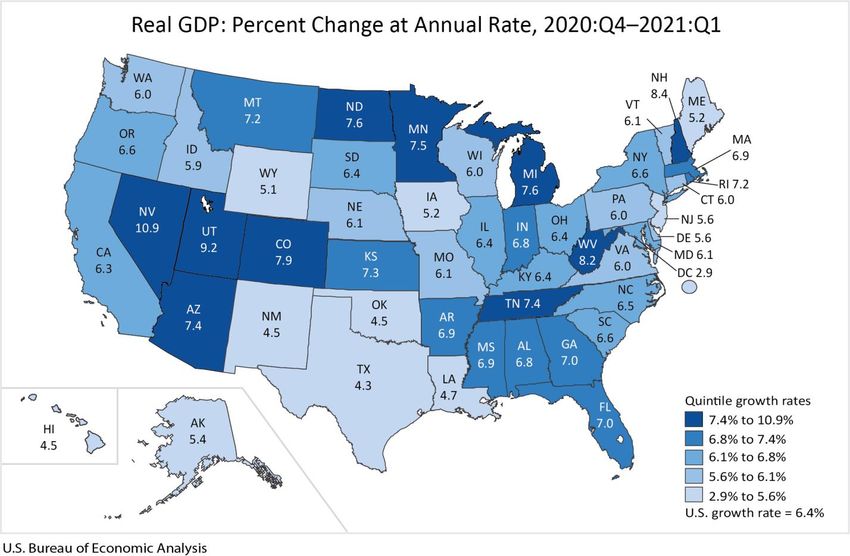
After falling -4.3 percent in the first quarter of 2020 and -30.1 percent in the second quarter, Florida’s real GDP
rebounded by 33.4 percent in the third quarter and finished the calendar year with 3.1 percent growth in the fourth
quarter. The entire 2020 year ended with a loss of -2.9 percent over the prior year. For the first quarter of 2021,
Florida came in at 7.0 percent, topping the rate for the US as a whole and ranking 15th in the country. The latest
Estimating Conference projections show an increase of 2.0 percent for Fiscal Year 2020-21 and 4.5 percent for Fiscal
Year 2021-22. For the 2022-23, 2023-24 and 2024-25 fiscal years, annual growth will average a more characteristic
2.5 percent. 1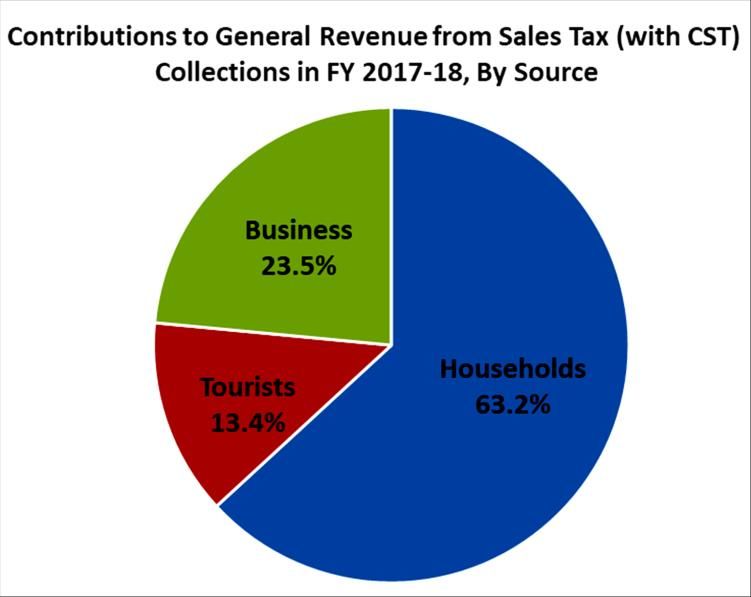
State’s GDP by County…

Pre-pandemic, South Florida
represented one-third of the
State’s GDP with Miami-Dade
clocking in at 15.74%. The
post-pandemic impact by
county is still unknown as is its
duration, but Miami-Dade was
the state’s hardest hit county
by most metrics. At the end of
December 2020, it was ranked
fourth in the country for its
total number of cases, and          Five counties represent over 50% of the
Broward was ranked                  state’s GDP:
thirteenth. In 2020, these                 • Miami-Dade       15.74%
                                           • Broward          10.37%
counties ranked eighth and                 • Orange            9.37%
seventeenth nationally in                  • Hillsborough      8.81%
population, respectively.                  • Palm Beach        7.85%
                                                                              2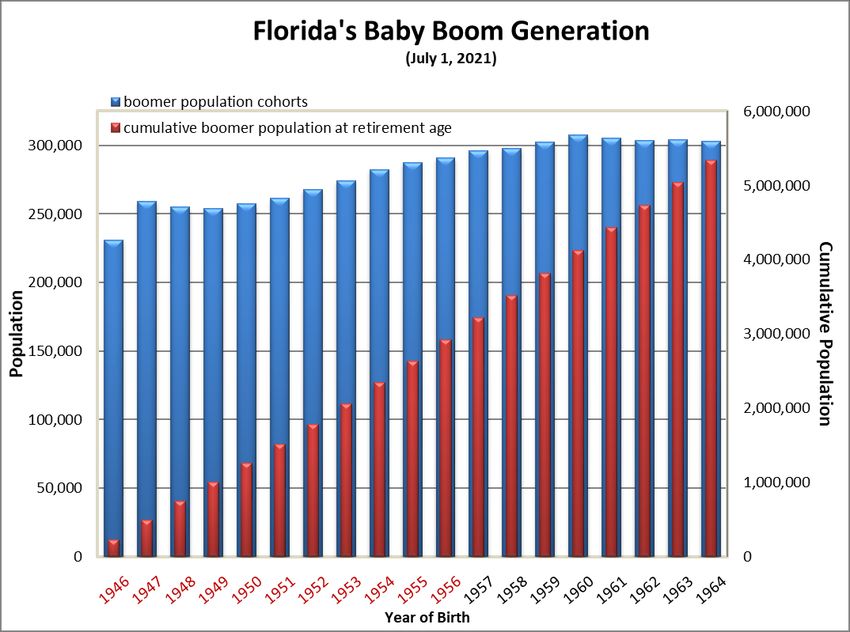
Coronavirus Impact on FL Personal Income...
                                                                                   For the 2018 calendar year, Florida had
                                                                                   6.5 percent growth in personal income
                                                                                   and 5.1 percent growth in per capita
                                                                                   personal income. For 2019, Florida’s
                                                                                   personal income growth slowed slightly
                                                                                   from the prior year, but remained above
                                                                                   the national average (4.0 percent growth
                                                                                   in Florida versus 3.9 percent in the US),
                                                                                   while per capita personal income growth
                                                                                   fell below the national growth rate (2.9
                                                                                   percent in Florida versus 3.5 percent in the
                                                                                   US). Translating the data into the state’s
                                                                                   fiscal year, Florida grew 5.3 percent in
                                                                                   personal income during Fiscal Year 2018-
                                                                                   19 and was expected to grow 5.1 percent
                                                                                   in Fiscal Year 2019-20 at the Conference
                                                                                   held immediately before the pandemic.
                                                                                   Through the first half of the 2019-20 fiscal
                                                                                   year, the data showed that the state was
                                                                                   on track to match that Conference
                                                                                   projection.

Normally, personal income growth is another important gauge of the state’s economic health; however, its changes
have been in stark contrast to GDP as federal dollars have flooded into many Florida households. For example, in the
first quarter of 2021, Florida’s personal income growth shot up 61.9 percent, largely due to the two most recent federal
stimulus and relief programs converging in the quarter. Once the federal support measures expire, the state’s personal
income will recede at an annualized 24.7 percent in the second quarter of the 2021 calendar year to produce a final
growth rate for the 2020-21 fiscal year of 8.5 percent. The Economic Estimating Conference expects personal income to
increase by 1.5 percent in the current year based on the hope that, as furloughed and laid off workers return to their
jobs or find new opportunities, wage growth will offset much of the loss of the massive government relief measures.
Thereafter, the annual growth rates are expected to remain solidly above 4.0 percent.                                    3
Atypical Wage Gap Stubbornly Persisted in 2020…
Florida’s average annual wage has typically been below the US average. The most recent data for the 2020 calendar
year showed that Florida’s average wage, relative to the US average, continued to fall from 2016 when it was 87.7% to
87.2% in 2020. Matching the ratio in 2014, this was Florida’s lowest percentage since 2001 when it was 87.1%.
In part, the lower than average wage gains has to do with the mix of jobs that have been growing the fastest in Florida
and their average wages. For example, the Accommodation & Food Services employment sector is large, has the
lowest average annual wage, and had—until the pandemic—been growing faster than overall employment in the
state. This sector is closely related to the health of Florida’s tourism industry which has been bearing the brunt of the
Covid-related economic impacts. With its massive disruption in the fourth quarter of the state’s fiscal year, FY 2019-
20 saw a decline of 19.1% over the peak of 129+ million visitors in FY 2018-19. Visitors in FY 2020-21 had a further
decline of 10.6% from the already suppressed level for the prior year.
4Current Employment Conditions…
July 2021 Nonfarm Jobs (YOY)
US: 5.2%
FL: 4.2%
Employment dropped by over 1.2 million jobs
from February 2020 to April 2020, a decline
of -14.0 percent. As of July, Florida has
regained 953,400 jobs out of the 1,269,200
million lost, or about 75%.
July 2021 Unemployment Rate
US: 5.4%
FL: 5.1% (529,900 jobless persons)
The Revenue Estimating Conference assumes
the “full employment” unemployment rate is
about 4 percent.
Florida’s unemployment rate had been hovering
around 3.3 percent from April 2019 through
February 2020. With the onset of the
pandemic, the unemployment rate spiked to
14.2 percent in May 2020, handily surpassing
the prior peak rate of 10.9 percent experienced
in the first four months of 2010 during the
Great Recession. Given the short period over
which the change from ultra low to ultra high
occurred, it was stunning.
5Florida’s Participation Rate Subpar…
Florida’s labor force participation rate
most recently peaked during the
Housing Boom at 63.7% from
February 2007 to March 2007. Pre-
pandemic, Florida’s participation rate
had been above 59%; however, once
the pandemic took hold, Florida’s
participation rate fell to 55.5% in
April 2020. Since then, Florida’s
participation rate has partially
recovered, posting 58.7% in July
2021.
Florida’s participation rate is still
lower than the US even though the
US participation rate also fell
substantially in April to 60.2%. The
US participation rate has been rising
more modestly, posting 61.7% in July
2021.
As a result of the pandemic’s economic impact, there was a surge in the number of unemployed in both Florida and the US. The
duration of unemployment initially reflected the shift of a large number of workers into unemployment with an increased number and
percentage of those unemployed for less than 5 weeks. As time progressed, these unemployed workers increased the percentage of
unemployed in the longer-duration unemployment categories – 5 to 14 weeks (starting in May 2020), 15 to 26 weeks (starting in July
2020), and 27 to 51 weeks (starting in September 2020).
Prior to the pandemic’s impact on the labor force, Florida was still experiencing a significant percentage of long-term unemployed
(24.7%). The relative share of this group fell during the early months of the pandemic when the ranks of newly unemployed swelled,
but now is up to 35.7% as people laid off during the pandemic continue to be unemployed.
6Employment Below Pre-Pandemic Peak…
Area February 2020 to
February 2021
Gadsden 11.2% Greatest
County Percentage
Increase
Florida -4.1%
Orange -12.5% Greatest
County Percentage
Decline
• Florida’s employment peaked in February 2020, just prior to the onset of the pandemic.
• Based on preliminary February 2021 data, only 11 Florida counties had gained
employment relative to the levels they had a year ago. An additional seven counties
were fewer than 50 jobs shy of reaching their prior year’s level.
7Population Growth to Slow…
Population growth is typically the state’s primary engine of economic growth, fueling both
employment and income growth.
Florida’s population exhibited strong growth in recent years. Between April 1, 2018 and
2019, population grew by 368,021 residents (1.77%), while between April 1, 2019 and
2020, the state added 387,479 residents (1.83%). As a result of the pandemic, population
growth is expected to slow to 329,717 new residents (1.53%) in 2021, reflecting negative
natural increase (more deaths than births). Between 2021 and 2025, growth is forecast to
average 1.36%.
All of Florida’s population growth through 2030 will be from net migration.
Nationally, average annual growth was forecast to be about 0.66% between 2020 and 2030.
This number has not been updated since the release of the new Census numbers.
The future will be different than the past; Florida’s long-term growth rate between 1970
and 1995 was over 3%.
Florida is currently the third most populous state, behind California and Texas.
Note: Florida’s April 1, 2020 population is an estimate prior to the release of the 2020 Census data. 8Florida’s Population Growth…
Florida’s population growth has
mostly been from net migration.
The pandemic’s cumulative effect is
expected to be a slowing in net
migration as well as a shift in net
natural increase to negative
numbers sooner than originally
expected.
Florida’s population growth of
387,479 between April 1, 2019 and
April 1, 2020 was the strongest
annual increase since 2005,
immediately prior to the collapse of
the housing market and the
beginning of the Great Recession.
Note: April 1, 2020 population is an estimate prior to the release of the 2020 Census data. 9Baby Boomers in Context...
The first cohort of Baby
Boomers became eligible for
retirement (turned age 65) in
2011. Eleven cohorts have
now entered the retirement
phase: 2011 through 2021.
This represents over half of all
Baby Boomers.
Population aged 65 and over is
forecast to represent 24.4% of
the total population in 2030,
compared with 20.5% in 2020
and 17.3% in 2010.
In 2000, Florida’s prime working age population (ages 25-54) represented 41.5% of the total
population. With the aging Baby Boom generation, this population now represents 36.9% of
Florida’s total population and is expected to represent only 35.9% by 2030.
The youngest population, 0-17, represented 22.8% of the total population in 2000. In 2020,
only 20.2% of the total population was in this age group, and this share is projected to continue
declining to 19.9% by 2030. 10Population Growth by Age Group…
Distribution of Growth by Age Group
between April 1, 2010 to April 1, 2030
53.7%
As a result of both net migration and natural increase, Florida is forecast to grow by 5.6 million
persons between 2010 and 2030.
Growth by age group depends upon this overall growth and the aging of resident population,
resulting in 53.7 percent of those gains in the older population (age 60 and older).
Florida’s younger population (age 0-17) will account for 15.4 percent of the gains, while the
younger working age group (25-39) will account for 18.4 percent of the growth.
11Florida Housing Market Soared During Pandemic...
Documentary Stamp Tax collections in FY 2020-21 topped the FY 2005-06 peak reached at the height of
Florida’s housing boom. This milestone was particularly remarkable considering the prior year (FY 2019-20)
registered only 70.8 percent of that level after steadily increasing for ten years from a low of 26.6 percent.
The market environment supporting this result primarily resulted from the record low interest rates resulting
from the Federal Reserve’s actions to stem the severity of the pandemic’s economic disruption in the second
12
quarter of 2020.Homeownership Rate Is High...
From 2013 to 2019, Florida was below its long-run average homeownership rate, although the 2019
calendar year very nearly matched it at 66.0 percent. During the 2020 calendar year, the state finally
moved above the long-run average, posting 68.7 percent for the year. So far in 2021, the state is
dropping slightly below this level: Q1—68.1 percent and Q2—67.0 percent.
13Permits Are Still Well Below Historic Norms…
Single-Family building permit activity, an indicator of new construction, remains in positive territory, beginning
with strong back-to-back growth in both the 2012 and 2013 calendar years (over 30% in each year). The final
data for the 2014 calendar year revealed significant slowing—posting only 1.6% growth over the prior year.
Nevertheless, annual activity for the four subsequent calendar years again ran well above their individual
periods a year prior, posting double-digit growth in each year: 20.3% in 2015, 11.1% in 2016, 13.5% in 2017,
and 13.8% in 2018. In 2019, activity temporarily slowed again; this time to 2.9%—but spurred in part by
record low interest rates, single-family building permit activity in 2020 was 15.4% higher than the 2019 level.
Even with the strong percentage growth rates seen in seven of the last nine calendar years, the level is still
lower than historic standards would suggest. However, with the robust growth seen in 2020, the state has
moved to 72.4% of that level.
14Existing Home Market
All metrics point to an existing home
market that has fully recovered.
Existing home sales volume in each of
the calendar years from 2014 to 2020
exceeded the 2005 peak year. The
story is similar for sales price.
Florida’s existing home price gains
roughly tracked national gains over
the past six years, including the mid-
year acceleration in single family
home prices during calendar year
2020.
With only one exception, national
median price increases have outpaced
Florida; the state’s median price in July
2021 was 96.7 percent of the national
median price after passing it briefly in
February 2018. Florida’s median price
surpassed its own prior peak
($256,200 in June 2006) in June
2018—and at $355,000 in July 2021,
broke its record high set only the
month before. Data through July 2021
15Florida and U.S. Median Gross Rent
(in Current Dollars)
Median Gross Rent Average Gross Rent
Year
Florida Florida
United relative to United relative to
Florida Florida
States United States United
States States
2005 728 809 111% 803 863 107%
2006 763 872 114% 844 932 110%
2007 789 925 117% 878 991 113%
Florida Quarterly Vacancy Rate:
2008 824 947 115% 919 1,015 110%
2009 842 952 113% 938 1,024 109%
2021:Q2 7.5
2010 855 947 111% 954 1,017 107%
2011 871 949 109% 973 1,027 106%
2012 884 954 108% 990 1,037 105%
2013 905 972 107% 1,016 1,050 103%
2014 934 1,003 107% 1,047 1,087 104%
2015 959 1,046 109% 1,077 1,129 105%
2016 981 1,086 111% 1,105 1,161 105%
2017 1,012 1,128 111% 1,138 1,203 106%
2018 1,058 1,182 112% 1,182 1,251 106%
Florida Renter Fraction
2019 1,097 1,238 113% 1,223 1,301 106% Date US Florida
2019 35.89% 33.75%
Source: U.S. Census Bureau, American Community Survey, 1-Year, 2005-2019.
2018 36.05% 34.08%
2017 36.13% 34.85%
2016 36.88% 35.87%
Challenging housing costs and shifting preferences among 2015 36.97% 36.22%
Millennials caused residential rental vacancies to tighten 2014 36.90% 35.95%
strongly over the five-year period running from 2015 2013 36.50% 35.21%
2012 36.09% 34.36%
through 2019, with price pressure building over the same
2011 35.42% 33.28%
period. However, the overall share of Florida’s population 2010 34.65% 31.85%
living in rentals is dropping as homeownership rises. 2009 34.13% 31.52%
1650
60
70
90
80
100
110
1978-01-01 120
1978-09-01
1979-05-01
1980-01-01
1980-09-01
1981-05-01
1982-01-01
1982-09-01
1983-05-01
1984-01-01
1984-09-01
1985-05-01
1986-01-01
1986-09-01
1987-05-01
1988-01-01
1988-09-01
1989-05-01
1990-01-01
1990-09-01
1991-05-01
1992-01-01
1992-09-01
1993-05-01
1994-01-01
1994-09-01
1995-05-01
1996-01-01
1996-09-01
1997-05-01
1998-01-01
1998-09-01
1999-05-01
2000-01-01
2000-09-01
2001-05-01
2002-01-01
2002-09-01
2003-05-01
2004-01-01
2004-09-01
2005-05-01
2006-01-01
2006-09-01
2007-05-01
2008-01-01
2008-09-01
2009-05-01
2010-01-01
2010-09-01
2011-05-01
2012-01-01
2012-09-01
2013-05-01
University of Michigan: Consumer Sentiment (UMSCENT)
2014-01-01
2014-09-01
2015-05-01
2016-01-01
2016-09-01
2017-05-01
2018-01-01
2018-09-01
2019-05-01
2020-01-01
2020-09-01
2021-05-01
2021 was also the only month to move above the index average during the pandemic.
across all of the pandemic-affected months is 70.3 (August 2021) to 88.3 (April 2021). April
inception (86.1), but markedly above the Great Recession depths. The range from low to high
Nationally, the sentiment reading for August 2021 (70.3) is well below the index average since
Consumer Perceptions Surprisingly Resilient
17Florida-Based Downside Risk
While all Florida industries were impacted by the pandemic-induced economic contraction, Florida’s leisure
and hospitality industry bore the brunt of the longer-term consequences. Previous economic studies of
disease outbreaks have shown that it can take as long as 12 to 15 months after the outbreak ends for
tourism to return to pre-disease levels. The magnitude of this event is greater, and the timing is less clear
due to the surging Delta variant of COVID-19. The total number of tourists declined 69 percent from the
prior year in the second quarter of 2020. After that dramatic drop, tourism managed to recover to 68 percent
of the last full pre-COVID quarter by the first quarter of 2021, buttressed by the increased number of
domestic visitors travelling to Florida by car. Several industry groups have already predicted that it will take
at least two years to reach full recovery from this pandemic. Current expectations are that leisure driving
vacations will recover first, and then—in order—business travel, domestic air travel, and international travel.
The timing will be influenced by the actual course of the disease over the next few months, as well as the
widespread distribution of vaccines globally. Even so, the Conference expects robust growth during Fiscal
Year 2021-22, with a projected overall increase of 38.4 percent from the extremely suppressed level in
Fiscal Year 2020-21. The growth rate moderates thereafter. While the new forecast levels never exceed the
pre-pandemic forecast levels, they come close in the latter part of the 10-year forecast horizon
The Legislative Office of Economic and Demographic
Research has updated and refined an empirical analysis
of the various sources of the state’s sales tax collections.
In FY 2017-18, sales tax collections provided over $24.1
billion dollars or 76.4% of Florida’s total General Revenue
collections. Of this amount, an estimated 13.4% (over
$3.2 billion) was directly attributable to purchases made
by tourists. Preliminary data for FY 2018-19 indicates
that the visitor share rose to 14.5% for nearly $3.7 billion
dollars. 18Florida Taxable Sales…
Looking at the year-over-year change 100.0%
in taxable sales, Florida’s volatility
over the prior year has been
80.0%
dramatic since the onset of the
pandemic, flattening out all other
data points since 2010. Recent gains 60.0%
are related to taxable sales activity
has been bolstered by federal 40.0%
stimulus checks to households,
redirected spending from the hard-
20.0%
hit service sector, and some
consumers’ ability to draw down
atypically large savings that built up 0.0%
0 20 40 60 80 100 120 140
during the pandemic. After
increasing to a historic peak rate of -20.0%
33.7 percent in April 2020 from the
7.9 percent rate for the entire 2018-
-40.0%
19 fiscal year, just released personal FL Taxable Sales Tax Growth Over the Same Month, Prior Year
income data indicated that the Poly. (FL Taxable Sales Tax Growth Over the Same Month, Prior Year)
personal saving rate dropped to 9.6 Data through June 2021
percent in July 2021. However, how
people spend has also changed—perhaps permanently. On August 19, 2021, the Census Bureau of the US
Department of Commerce released its quarterly retail e-commerce sales report. E-commerce sales for the second
quarter of 2021 accounted for 13.3 percent of total sales, as compared to the second quarter of 2019 when the
share was 10.5 percent.
19General Revenue Forecast Comparison…
Post Session August 2021 Incremental After Florida’s economy shrank 0.5 percent in
Fiscal Year Forecast Forecast Difference Growth Growth FY 2019-20, it appears to have grown 2.0
2005-06 27074.8 27074.8 0 8.4% percent in FY 2020- 21. The turnaround was
2006-07 26404.1 26404.1 0 -670.7 -2.5% led by a stronger than anticipated response to
2007-08 24112.1 24112.1 0 -2292.0 -8.7% the back-to-back federal stimulus packages in
2008-09 21025.6 21025.6 0.0 -3086.5 -12.8%
December 2020 and March 2021, coupled with
2009-10 21523.1 21523.1 0.0 497.5 2.4%
a faster than expected reopening of the
2010-11 22551.6 22551.6 0.0 1028.5 4.8%
2011-12 23618.8 23618.8 0.0 1067.2 4.7% economy in the last quarter of the fiscal year.
2012-13 25314.6 25314.6 0.0 1695.8 7.2%
2013-14 26198.0 26198.0 0.0 883.4 3.5% Through June 2021, revenue collections had
2014-15 27681.1 27485.9 (195.2) 1287.9 5.7% gained $2.3 billion to the Conference
2015-16 28325.4 28325.4 0.0 644.3 2.3% expectations in April, with July 2021 expected
2016-17 29594.5 29,594.5 0.0 1269.1 4.5% to add to the overage. Because the economy
2017-18 31218.2 31,218.2 0.0 1623.7 5.5%
is largely returning to normal, the Revenue
2018-19 33413.8 33,413.8 - 7.0%
Estimating Conference has gained confidence
2019-20 31366.2 31,366.2 - (2,047.6) -6.1%
2020-21 36280.9 36,280.9 4,914.7 15.7% in adding to the prior forecast for FY 2021-22
2021-22 35,491.6 36,901.0 1,409.4 620.1 1.7% and FY 2022-23, even though some areas will
2022-23 37,136.4 38,336.8 1,200.4 1,435.8 3.9% be backing down from heightened activity
2023-24 38,634.8 39,889.5 1,254.7 1,552.7 4.1% levels associated with the federal response to
2024-25 40,382.1 41,471.8 1,089.7 1,582.3 4.0% the pandemic. As a result, the Conference
2025-26 41,518.1 42,504.2 986.1 1,032.4 2.5% made sizeable adjustments to the forecast
2026-27 - 44,091.2 - 1,587.0 3.7%
adopted in April. Anticipated revenues were
revised upward by $1.4 billion in FY 2021-22
Coincidentally, the state’s overall General Revenue collections also and by $1.2 billion in FY 2022-23, for a two-
move notably above the pre-pandemic forecasted levels for FY 2021-22 year combined increase of $2.6 billion. These
and FY 2022-23 by approximately $1.2 billion each year; however, about changes reflect increases over the previous
one-half of the annual difference is attributable to the addition of Indian estimates of 4.0 percent in FY 2021-22 and 3.2
Gaming Revenues and retained online sales tax dollars which were percent in FY 2022-23.
previously not included.
20You can also read