Real time geospatial analysis identifies gaps in COVID 19 vaccination in a minority population
←
→
Page content transcription
If your browser does not render page correctly, please read the page content below
www.nature.com/scientificreports
OPEN Real‑time geospatial analysis
identifies gaps in COVID‑19
vaccination in a minority
population
Cici Bauer1*, Kehe Zhang1, Miryoung Lee2, Michelle Jones3, Arturo Rodriguez3,
Isela de la Cerda2, Belinda Reininger4, Susan P. Fisher‑Hoch2 & Joseph B. McCormick2
COVID-19 vaccination is being rapidly rolled out in the US and many other countries, and it is crucial to
provide fast and accurate assessment of vaccination coverage and vaccination gaps to make strategic
adjustments promoting vaccine coverage. We reported the effective use of real-time geospatial
analysis to identify barriers and gaps in COVID-19 vaccination in a minority population living in South
Texas on the US-Mexico Border, to inform vaccination campaign strategies. We developed 4 rank-
based approaches to evaluate the vaccination gap at the census tract level, which considered both
population vulnerability and vaccination priority and eligibility. We identified areas with the highest
vaccination gaps using different assessment approaches. Real-time geospatial analysis to identify
vaccination gaps is critical to rapidly increase vaccination uptake, and to reach herd immunity in the
vulnerable and the vaccine hesitant groups. Our results assisted the City of Brownsville Public Health
Department in adjusting real-time targeting of vaccination, gathering coverage assessment, and
deploying services to areas identified as high vaccination gap. The analyses and responses can be
adopted in other locations.
COVID-19 vaccination is being rapidly rolled out in the US and many other countries, but barriers in disad-
vantaged and highly vulnerable communities are significant. In this analysis, we reported the effective use of
real-time geospatial analysis to identify barriers and gaps in COVID-19 vaccination in a minority population to
inform rollout strategies and vaccination campaigns. The study region was the City of Brownsville (COB, popula-
tion 182,781), the largest city within Cameron County (population 421,750) in South Texas on the US-Mexico
Border1. Over 90% of the population is Mexican–American, with high prevalence of Type 2 diabetes and obesity
(27% and 50%), respectively leading risk factors to nearly twice the national mortality from COVID-192–4. The
population is historically underserved and socioeconomically disadvantaged with limited healthcare access 2.
Despite the disproportionally high impact of COVID-19 on minorities and underserved populations, a recent
study reported lower COVID-19 vaccination coverage in socially vulnerable populations 5. It is therefore crucial
to provide fast and accurate assessment of vaccination coverage to identify and remedy local gaps. Since the
COVID-19 vaccine first became available in COB in early February 2021, researchers from the University of Texas
School of Public Health at Brownsville have been working closely with the COB Public Health Department, to
provide real-time geospatial analysis to assess vaccination gaps. We developed a real-time evaluation to quantify
vaccination needs, as well as identify and locate gaps at census tract level. Our assessment has provided the COB
Public Health Department with the needed information to reach vulnerable groups, improve overall vaccination
uptake, and decide where to deploy their ‘boots-on-the-ground’ vaccination campaigns.
1
Department of Biostatistics and Data Science, School of Public Health, The University of Texas Health Science
Center at Houston, 1200 Pressler St, Houston, TX, USA. 2Department of Epidemiology, Human Genetics and
Environmental Science, School of Public Health, The University of Texas Health Science Center at Houston,
Brownsville, TX, USA. 3City of Brownsville Public Health and Wellness, Brownsville, TX, USA. 4Department of
Health Promotion and Behavior Sciences, School of Public Health, The University of Texas Health Science Center at
Houston, Brownsville, TX, USA. *email: cici.x.bauer@uth.tmc.edu
Scientific Reports | (2021) 11:18117 | https://doi.org/10.1038/s41598-021-97416-y 1
Vol.:(0123456789)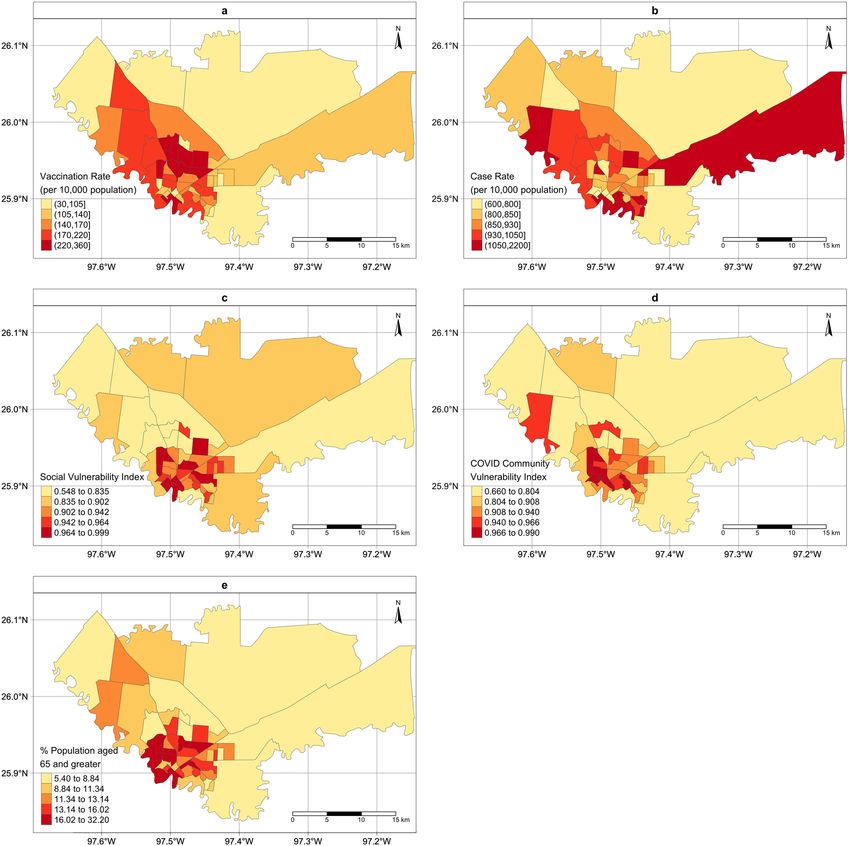
www.nature.com/scientificreports/
Data and materials
Study region and population. The minority population in the COB has been disproportionally affected
by COVID-19, with cumulative COVID-19 case rate of 9.13%, case fatality rate (COVID-19 death among
COVID-19 cases) of 3.42% and mortality rate (COVID-19 death among total population) of 0.31%, between
March 19th, 2020 (first case reported from COB) and March 13th, 2021, reported from Cameron County at
the time of this analysis 6. All three rates were much higher than the national cumulative case rate of 8.9%, case
fatality rate of 1.82% and overall mortality rate of 0.16% 7. This population is also among the most vulnerable
populations, with the social vulnerability index (SVI) for Cameron County ranked among the lowest 5% in the
US (i.e., SVI rank 96.7%) 8. Our analysis included all 48 census tracts that COB encompasses.
COVID‑19 vaccination rollouts. COB Public Health Department functioned as a local COVID-19 vac-
cination hub provider held four mass vaccinations clinics, with first dose clinics conducted on February 5th,
February 13th, February 26th, 2021, and a second dose clinic on March 5th, 2021. The Moderna mRNA-1273
COVID-19 vaccine (Moderna TX, Inc, Cambridge, MA) was administered during these mass vaccination clin-
ics. COB also held a small clinic the week of March 9th, 2021 with the Janssen (Ad.26.COV2.S) vaccine (Janssen
Biotech, Inc, a Janssen Pharmaceutical company, Johnson & Johnson; New Brunswick, NJ), at the Fire Station
for home-bound individuals and transportation-restricted individuals. The initial rollout of the COVID-19 vac-
cination eligibility was based on Texas Department of State Health Services vaccine rollout plan for front-line
health workers (Phase 1A), those aged 65 years and older, and/or those aged 16 years and older with at least one
medical condition with increased COVID-19 risk (Phase 1B). COVID-19 vaccination data in this report were
obtained from the Texas Immunization Registry database (ImmTrac2) and encompass all those vaccinated in the
city clinics since February 5th through March 13th, 2021. These data were used to assess vaccination coverage
up to March 13th during the initial phase. We calculated the COVID-19 vaccination coverage as the population
that has received at least one dose of vaccination per 10,000 population, for each census tract within the study
region and during this initial rollout phase.
COVID‑19 vaccination gap. We followed the COVID-19 Vaccination Planning to assess local COVID-19
vaccination gaps 9. We first ranked the census tracts by their vaccination priority from the lowest to the highest,
and then ranked the census tracts by their actual vaccinations coverage rates also from the lowest to the highest.
The difference between the two ranks was then used to quantify the vaccination gap.
To assess the COVID-19 vaccination priority, different metrics can be used, and each may focus on a differ-
ent aspect of COVID-19, such as the impact, social vulnerability, or priority population eligible for COVID-19
vaccination. Here we considered and compared the following four priority assessments. In Approach 1, we used
census tract cumulative COVID-19 case rate reported above, and areas with high rate were considered priority.
Approach 2 used SVI, and so areas with higher SVI were ranked as higher priority. Approach 3 used the census
tract percentage of population aged 65 and older, so that areas with higher percentage of elderly were designated
as higher priority. This approach accounted for the vaccination eligibility in the initial rollout phase, as the higher
priority was given to the elderly. Finally in Approach 4, we used the COVID-19 community vulnerability index
(CCVI) created by Surgo Ventures 10. CCVI covered seven themes of COVID-19 risk factors including socio-
economic status, work environment, ethnicity and healthcare system. We averaged the theme-specific scores
to obtain an overall CCVI composite score, which ranged from 0 to 1 with 0 the lowest vulnerability and 1 the
highest. The overall composite score was used to rank the census tracts for vaccine priority.
The COVID-19 vaccination gap was assessed by each of the four approaches. Census tracts were identified as
having vaccination gap if the rank of vaccination coverage rates was lower than the rank of priory; otherwise, they
were identified as no gap. Among the census tracts with vaccination gaps, we further classified them into high,
medium and low gap group by dividing the rank difference to 3 equal size groups. All analyses were performed in
R Studio 11. To create the maps presented in this analysis, we first obtained the GIS shapefiles from 2019 TIGER/
Line shapefiles from the U.S. Census B ureau12, and used R package “tmap” to create the choropleth m aps13.
Results
Table 1 presents the summary statistics for all COVID-19 vaccines administrated in COB, stratified by age, gen-
der, ethnicity and dosage. From February 5th to March 13th, 2021, a total of 3743 (1.6% of the total population;
2.2% of the population aged 16 years and older) people have been vaccinated (i.e., received at least one dosage),
with 2176 fully vaccinated. Of those vaccinated, 1,711 (45.7%) were aged 65 and older. We summarized the vac-
cinated individuals by their age group (under 20, 20–39, 40–64 and 65 and greater), sex and ethnicity.
Figure 1 presents the census tract level of vaccination coverage rate between February 5th and March 13th,
2021 (a), cumulative COVID-19 case rate between March 18th, 2020 and March 13th, 2021 (b), CDC SVI for
Scientific Reports | (2021) 11:18117 | https://doi.org/10.1038/s41598-021-97416-y 2
Vol:.(1234567890)www.nature.com/scientificreports/
Variable At least one dose (n = 3743) Complete dose (n = 2176)
Age Group
Under 20 59 (1.6%) 11 (0.5%)
Between 20 to 39 681 (18.2%) 218 (10.0%)
Between 40 to 64 1292 (34.5%) 537 (24.7%)
65 and greater 1711 (45.7%) 1410 (64.8%)
Gender
Female 2240 (59.8%) 1289 (59.2%)
Male 1495 (39.9%) 869 (39.9%)
Missing 8 (0.3%) 18 (0.9%)
Ethnicity
Hispanic or Latino 2722 (72.7%) 1790 (82.3%)
Not Hispanic or Latino 169 (4.5%) 154 (7.1%)
Missing 852 (22.8%) 232 (10.7%)
Table 1. Summary of COVID-19 vaccination in City of Brownsville between February 5th, 2021 (COVID-
19 vaccination first became available to the region) and March 13th, 2021. At least one dose refers to either
completing one or two doses of Moderna mRNA-1273 COVID-19 vaccine, or one dose of Janssen (Ad.26.
COV2.S) vaccine. Complete dose refers to either completing two doses of Moderna mRNA-1273 COVID-19
vaccine, or one dose of Janssen (Ad.26.COV2.S) vaccine.
year 2018 (c), percentage of population 65 years old and above (d) and CCVI composite score (e). These maps
present somewhat different spatial patterns and identify different sets of census tracts as the priority areas.
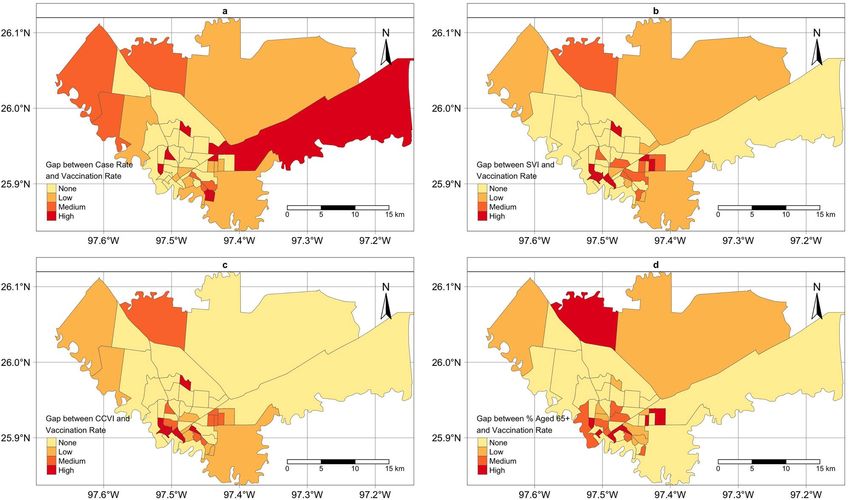
Figure 2 presents the maps of census tracts identified as no-gap/low/median/high gap. Each panel corresponds
to one of the four approaches described above for assessing the gap. Some areas were identified as high gap areas
by all four approaches, while some difference was also noticed. We noted some rural areas on the outskirts of
the city were identified as high gap area only when using the cumulative case rate to assess the gap. Areas in the
city downtown were consistently identified as high gap areas.
The analysis has allowed COB Public Health Department to strategically target areas with high vaccination
gaps through their “boots on the ground” campaign, while considering the population characteristics in these
areas (e.g., age or primary language spoken at home). For example, COB Public Health Department has devel-
oped and implemented a vaccination messaging approach utilizing door-to-door outreach in both English and
Spanish languages in identified high gap areas with older populations, with additional messaging via the city’s
social media platforms and the weekly COVID update targeting high gap areas with higher young p opulations14.
Discussion
In this analysis, we reported the first phase of COVID-19 vaccination rollout in the COB between February 5th,
2021 and March 13th, 2021. We developed four rank-based approaches to evaluate the vaccination gap, which
considered COVID-19 impact, population vulnerability and vaccination eligibility. The rank-based approach,
despite being simple, can accommodate the fast-changing dynamics of COVID-19 vaccination. For example,
starting March 29th, 2021, vaccination eligibility for COVID-19 vaccination in Texas will include all population
aged 16 years and older. Eligibility criteria should be accounted for when assessing vaccination gaps. As COVID-
19 vaccine distribution plans evolve, together with COVID-19 herd immunity accumulating, we need a flexible
approach such as the ones developed in this analysis to enable rapid vaccine strategy adaptations.
Real-time geospatial analysis to identify vaccination gaps is critical to increase vaccination uptake in the
vulnerable and vaccine hesitant groups15. Our analyses have assisted the COB Public Health Department in
adjusting real-time targeting of vaccination, gathering coverage assessment, and the deployment of services to
areas with the largest gaps. Along with low education and low income levels, Hispanics showed higher COVID-
19 vaccine hesitancy compared with their c ounterparts15. Our real-time geospatial analysis incorporating SVI,
for example, would provide the information on vaccine hesitant groups overlapping with high SVI. The effective
use of real-time geospatial analysis can assist local public health departments, particularly those with limited
resources, to develop effective, as well as cultural and language appropriate strategies to reach communities and
increase vaccination uptake.
Scientific Reports | (2021) 11:18117 | https://doi.org/10.1038/s41598-021-97416-y 3
Vol.:(0123456789)www.nature.com/scientificreports/
Figure 1. Maps of the census-tract level vaccination rate and vaccination priority in City of Brownsville,
TX. (a): Vaccination rate per 10,000 population (February 5th–March 13th, 2021); (b): Case rate per 10,000
population (March 18th, 2020–March 13th, 2021). (c): social vulnerability index (SVI) ranked from 0 to 1; (d):
COVID community vulnerability index (CCVI) ranked from 0 to 1; (e): percentage of population with 65 years
old and over. The choropleth maps were created by the authors using R Studio (version 1.2.1335). URL http://
www.rstudio.com/, and R package tmap.
Scientific Reports | (2021) 11:18117 | https://doi.org/10.1038/s41598-021-97416-y 4
Vol:.(1234567890)www.nature.com/scientificreports/
Figure 2. Maps of census tracts identified with no-gap/low/median/high vaccination gap in City of Brownsville,
TX. Each panel corresponds to a different approach when assessing the gap proposed in this analysis. The
choropleth maps were created by the authors using R studio (version 1.2.1335). URL http://www.rstudio.com/,
and R package tmap.
Received: 28 April 2021; Accepted: 25 August 2021
References
1. U.S. Census Bureau QuickFacts: Cameron County, Texas, https://w ww.c ensus.g ov/q
uickf acts/f act/t able/b
rowns ville cityt exas, camer
oncountytexas/PST045219.
2. Fisher-Hoch, S. P., Rentfro, A. R., Gaines Wilson, J., Salinas, J. J., Reininger, B. M., Restrepo, B. I., McCormick, J. B., Pérez, A.,
Brown, H. S., Hossain, M. M., Rahbar, M. H. & Hanis, C. M. Socioeconomic status and prevalence of obesity and diabetes in a
Mexican American Community, Cameron County, Texas, 2004–2007. Prev. Chronic. Dis. 7 (2010).
3. Fisher-Hoch, S. P., Vatcheva, K. P., Rahbar, M. H. & McCormick, J. B. Undiagnosed diabetes and pre-diabetes in health disparities.
PloS One 10, e0133135 (2015).
4. Watt, G. P. et al. Mexican American and South Asian population-based cohorts reveal high prevalence of type 2 diabetes and
crucial differences in metabolic phenotypes. BMJ Open Diabetes Res. Care 6, e000436 (2018).
5. Hughes, M. M. County-Level COVID-19 Vaccination Coverage and Social Vulnerability—United States, December 14, 2020–March
1, 2021. MMWR Morb. Mortal. Wkly. Rep. 70(12), 431–436 (2021).
6. Bauer, C. et al. Census tract patterns and contextual social determinants of health associated with COVID-19 in a hispanic popula-
tion from South Texas: A spatiotemporal perspective. JMIR Public Health Surveill. 7, 29205 (2021).
7. CDC, COVID Data Tracker, https://covid.cdc.gov/covid-data-tracker.
8. CDC’s Social Vulnerability Index (SVI), https://www.atsdr.cdc.gov/placeandhealth/svi/index.html.
9. COVID-19 Vaccine Information, https://www.dshs.texas.gov/coronavirus/immunize/vaccine.aspx.
10. Bringing Greater Precision to the COVID-19 Response, https://precisionforcovid.org/ccvi.
11. RStudio Team, RStudio: Integrated Development Environment for R, manual, RStudio, PBC. (2020).
12. Census Mapping Files, https://www.census.gov/geographies/mapping-files.html.
13. M. Tennekes. Tmap: Thematic Maps in R. J. Stat. Softw. 84, 1 (2018).
14. Brownsville Vaccine Community Update - Brownsville Cares, https://btxcares.com/brownsville-vaccinecommunity-update/.
15. J. Khubchandani, S. Sharma, J. H. Price, M. J. Wiblishauser, M. Sharma, & F. J. Webb. COVID-19vaccination hesitancy in the
United States: A rapid national assessment. J. Community Health. 46, 270 (2021).
Author contributions
C.B. conceived and designed the analysis. S.F.H., J.M., B.R., M.J. and A.R. contributed to the acquisition of vac-
cination data. K.Z., M.L. and I.C. contributed to data processing and data curation. C.B. and K.Z. conducted the
data analysis and drafted the initial manuscript. S.F.H., M.J., A.R., B.R. and J.M. contributed to critical revision
of the article. All authors contributed to the interpretation of the findings.
Competing interests
The authors declare no competing interests.
Scientific Reports | (2021) 11:18117 | https://doi.org/10.1038/s41598-021-97416-y 5
Vol.:(0123456789)www.nature.com/scientificreports/
Additional information
Correspondence and requests for materials should be addressed to C.B.
Reprints and permissions information is available at www.nature.com/reprints.
Publisher’s note Springer Nature remains neutral with regard to jurisdictional claims in published maps and
institutional affiliations.
Open Access This article is licensed under a Creative Commons Attribution 4.0 International
License, which permits use, sharing, adaptation, distribution and reproduction in any medium or
format, as long as you give appropriate credit to the original author(s) and the source, provide a link to the
Creative Commons licence, and indicate if changes were made. The images or other third party material in this
article are included in the article’s Creative Commons licence, unless indicated otherwise in a credit line to the
material. If material is not included in the article’s Creative Commons licence and your intended use is not
permitted by statutory regulation or exceeds the permitted use, you will need to obtain permission directly from
the copyright holder. To view a copy of this licence, visit http://creativecommons.org/licenses/by/4.0/.
© The Author(s) 2021
Scientific Reports | (2021) 11:18117 | https://doi.org/10.1038/s41598-021-97416-y 6
Vol:.(1234567890)You can also read