COVID-19 vaccine surveillance report - Week 27 - GOV.UK
←
→
Page content transcription
If your browser does not render page correctly, please read the page content below

COVID-19 vaccine surveillance report
Week 27

1
COVID-19 vaccine surveillance report – week 27

Contents
COVID-19 vaccine surveillance report ......................................................................................... 1
   Week 27 ................................................................................................................................... 1
Contents....................................................................................................................................... 2
Summary...................................................................................................................................... 3
   Vaccine effectiveness ............................................................................................................... 3
   Population impact ..................................................................................................................... 3
Vaccine effectiveness .................................................................................................................. 5
   Effectiveness against symptomatic disease ............................................................................. 5
   Effectiveness against hospitalisation ........................................................................................ 6
   Effectiveness against mortality ................................................................................................. 6
   Effectiveness against infection ................................................................................................. 6
   Effectiveness against transmission .......................................................................................... 6
   Vaccine effectiveness against the Delta variant ....................................................................... 8
Population impact ........................................................................................................................ 9
   Vaccine coverage ..................................................................................................................... 9
   Vaccine impact on proportion of population with antibodies to COVID-19.............................. 12
   Direct impact on hospitalisations ............................................................................................ 17
   Direct and indirect impact on infection and mortality .............................................................. 19
References................................................................................................................................. 23

                                                                 2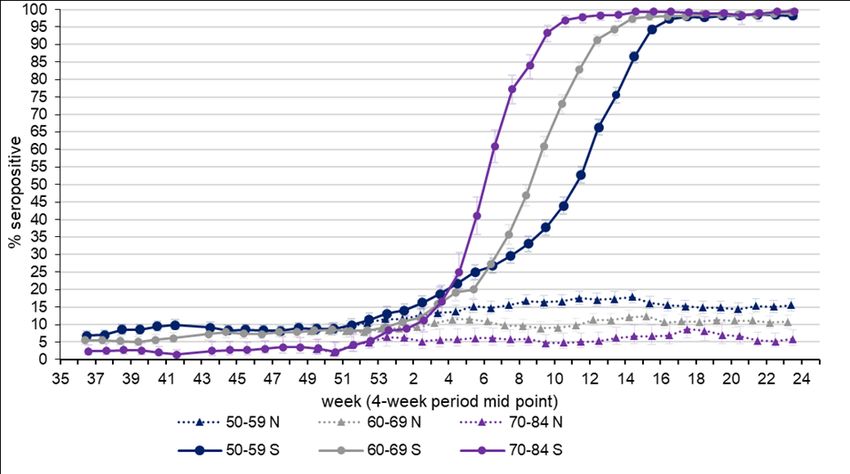
COVID-19 vaccine surveillance report – week 27

Summary
Four coronavirus (COVID-19) vaccines have now been approved for use in the UK.
Rigorous clinical trials have been undertaken to understand the immune response,
safety profile and efficacy of these vaccines as part of the regulatory process. Ongoing
monitoring of the vaccines as they are rolled out in the population is important to
continually ensure that clinical and public health guidance on the vaccination programme
is built upon the best available evidence.

Public Health England (PHE) works closely with the Medicines and Healthcare
Regulatory Agency (MHRA), NHS England, and other government, devolved
administration and academic partners to monitor the COVID-19 vaccination programme.
Details of the vaccine surveillance strategy are set on the Public Health England page
COVID-19: vaccine surveillance strategy (1). As with all vaccines, the safety of COVID-
19 vaccines is continuously being monitored by the MHRA. They conclude that overall,
the benefits of COVID-19 vaccines outweigh any potential risks (2).

Vaccine effectiveness
Several studies of vaccine effectiveness have been conducted in the UK which indicate
that a single dose of either vaccine is between 55 and 70% effective against
symptomatic disease, with higher levels of protection against severe disease including
hospitalisation and death. Additional protection is seen after a second dose. There is
now also evidence from a number of studies that the vaccines are effective at protecting
against infection and transmission.

Population impact
The impact of the vaccination programme on the population is assessed by taking into
account vaccine coverage, evidence on vaccine effectiveness and the latest COVID-19
disease surveillance indicators. Vaccine coverage tells us about the proportion of the
population that have received 1 and 2 doses of COVID-19 vaccines. By 4 July 2021, the
overall vaccine uptake in England for dose 1 was 61.1% and 45.5% for dose 2. In line
with the programme rollout, coverage is highest in the oldest age groups.

Based on antibody testing of blood donors, 88.1% of the adult population now have
antibodies to COVID-19 from either infection or vaccination compared to 16.1% that
have antibodies from infection alone. Over 95% of adults aged 40 or older have
antibodies from either infection or vaccination. Seropositivity among those aged 30 to 39
has begun to rise over the last few weeks. The latest estimates indicate that the
vaccination programme has directly averted over 46,300 hospitalisations. Analysis on
the direct and indirect impact of the vaccination programme on infections and mortality,

                                            3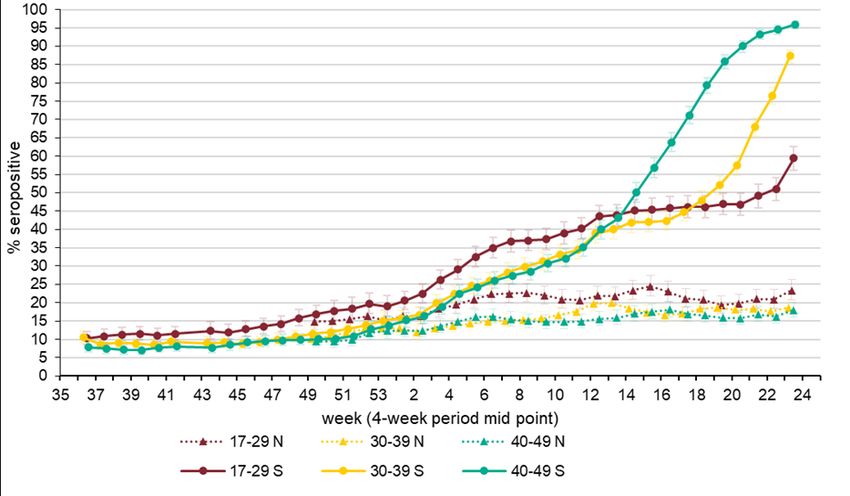
COVID-19 vaccine surveillance report – week 27

suggests the vaccination programme has prevented between 7.5 and 8.9 million
infections and between 29,000 and 31,800 deaths.

                                            4
COVID-19 vaccine surveillance report – week 27
Vaccine effectiveness
Large clinical trials have been undertaken for each of the COVID-19 vaccines approved
in the UK which found that they are highly efficacious at preventing symptomatic disease
in the populations that were studied. It is important to continue to evaluate the
effectiveness of vaccines in the 'real world', as this may differ to clinical trial efficacy. The
clinical trials are also performed in order to be able to assess the efficacy of the vaccine
against laboratory confirmed symptomatic disease with a relatively short follow up period
so that effective vaccines can be introduced as rapidly as possible. Nevertheless,
understanding the effectiveness against different outcomes (such as severe disease and
onwards transmission), effectiveness in different subgroups of the population and
understanding the duration of protection are equally important in decision making around
which vaccines should be implemented as the programme evolves, who they should be
offered to and whether booster doses are required.
Vaccine effectiveness is estimated by comparing rates of disease in vaccinated
individuals to rates in unvaccinated individuals. Below we outline the latest real-world
evidence on vaccine effectiveness from studies in UK populations. The majority of this
data relates to a period when the main circulating virus was the Alpha variant, emerging
data on effectiveness against symptomatic disease with the Delta variant is also
summarised below. The findings are also summarised in Tables 1 to 3.
Effectiveness against symptomatic disease
Vaccine effectiveness against symptomatic COVID-19 has been assessed in England
based on community testing data linked to vaccination data from the NIMS and from the
COVID Infection Survey. Current evidence is primarily from older adults, who were
among the earliest group vaccinated. Estimates of vaccine effectiveness range from
around 55 to 70% after 1 dose, with little evidence of variation by vaccine or age group
(3, 4, 5). Data on 2 doses is indicates effectiveness of around 65 to 90% (3, 6).
Offer of the Pfizer and Moderna mRNA vaccines to adults aged under 40 years began
on 10 May 2021. Early estimates of effectiveness of a single dose of either vaccine
indicate a vaccine effectiveness of around 60% after 1 dose of the Pfizer vaccine and
around 70% (95% CI: 46 to 86%) after 1 dose of the Moderna vaccine (week 26 Vaccine
Surveillance Report).
New data this week suggest that in most clinical risk groups, immune response to
vaccination is maintained and high levels of VE are seen with both the Pfizer and
AstraZeneca vaccines. Reduced antibody response and vaccine effectiveness were
seen after 1 dose of vaccine among the immunosuppressed group, however, after a
5COVID-19 vaccine surveillance report – week 27
second dose there is only a small and non-significant reduction in vaccine effectiveness
(7).
Effectiveness against hospitalisation
Several studies have estimated the effectiveness against hospitalisation in older adults,
all of which indicate higher levels of protection against hospitalisation after a single dose
than that seen against symptomatic disease, around 75 to 85% after 1 dose of the
Pfizer-BioNTech or Oxford-AstraZeneca vaccine (3, 8, 9, 10). Data on VE against
hospitalisation with 2 doses for all ages with the Alpha variant is shown in the week 26
Vaccine Surveillance Report.
Effectiveness against mortality
Data is also emerging which suggests high levels of protection against mortality. Studies
linking community COVID-19 testing data, vaccination data and mortality data indicate
that both the Pfizer-BioNTech and Oxford-AstraZeneca vaccines are around 70 to 85%
effective at preventing death with COVID-19 after a single dose (3, 11). Vaccine
effectiveness against mortality with 2 doses of the Pfizer vaccine is around 95 to 99%
and with 2 doses of the AstraZeneca vaccine around 75 to 99% (week 26 Vaccine
Surveillance Report).
Effectiveness against infection
Although individuals may not develop symptoms of COVID-19 after vaccination, it is
possible that they could still be infected with the virus and could transmit to others.
Understanding how effective vaccines are at preventing infection is therefore important
to predict the likely impact of the vaccination programme on the wider population. In
order to estimate vaccine effectiveness against infection, repeat asymptomatic testing of
a defined cohort of individuals is required. Studies have now reported on vaccine
effectiveness against infection in healthcare workers, care home residents and the
general population. With the Pfizer-BioNTech, estimates of effectiveness against
infection range from around 55 to 70%, with the Oxford-AstraZeneca vaccine they range
from around 60 to 70% (5, 12, 13, 14). With 2 of 2 doses of either vaccine effectiveness
against infection is estimated at around 65 to 90% (5,12).
Effectiveness against transmission
As described above, several studies have provided evidence that vaccines are effective
at preventing infection. Uninfected individuals cannot transmit; therefore, the vaccines
are also effective at preventing transmission. Data from Scotland has also shown that
household contacts of vaccinated healthcare workers are at reduced risk of becoming a
6COVID-19 vaccine surveillance report – week 27
case, which is in line with the studies on infection (15). There may be additional benefit,
beyond that due to prevention of infection, if some of those individuals who become
infected despite vaccination are also at a reduced risk of transmitting (for example,
because of reduced duration or level of viral shedding). A household transmission study
in England found that household contacts of cases vaccinated with a single dose had
approximately 35 to 50% reduced risk of becoming a confirmed case of COVID-19. This
study used routine testing data so would only include household contacts that developed
symptoms and went on to request a test via pillar 2. It cannot exclude asymptomatic
secondary cases or mildly symptomatic cases who chose not to request a COVID-19
test (16).
Table 1. Summary of evidence on vaccine effectiveness against different
outcomes (data relate to period when the Alpha variant dominated)
Vaccine effectiveness
Outcome Pfizer-BioNTech Oxford-AstraZeneca
1 dose 2 doses 1 dose 2 doses
Symptomatic disease 55-70% 85-95% 55-70% 70-85%
Hospitalisation 75-85% 90-99% 75-85% 80-99%
Mortality 70-85% 95-99% 75-85% 75-99%
Infection 55-70% 70-90% 55-70% 65-90%
Transmission
45-50% No data 35-50%
(secondary cases)* No data
High Evidence from multiple studies which is consistent
Confidence and comprehensive
Medium Evidence is emerging from a limited number of
Confidence studies or with a moderately level of uncertainty
Low Little evidence is available at present and results
Confidence are inconclusive
* effectiveness in reducing symptomatic secondary cases in households of a
symptomatic index case
7COVID-19 vaccine surveillance report – week 27
Vaccine effectiveness against the Delta variant
Analysis of routine testing data up to 13 June 2021, linked to sequencing and S-gene target
status has been used to estimate vaccine effectiveness against symptomatic disease using a
test negative case control design. Methods and detailed results are available in Effectiveness of
COVID-19 vaccines against the Delta variant. After a single dose there was an 14% absolute
reduction in vaccine effectiveness against symptomatic disease with Delta compared to
Alpha, and a smaller 10% reduction in effectiveness after 2 doses (Table 2).
Table 2. Vaccine effectiveness against symptomatic disease for Alpha and Delta variants
Vaccine Status Vaccine Effectiveness
Alpha Delta
Dose 1 49 (46 to 52) 35 (32 to 38)
Dose 2 89 (87 to 90) 79 (78 to 80)
Vaccine effectiveness against hospitalisation was estimated by evaluating hospitalisation
rates via emergency care among symptomatic confirmed cases using survival analysis. This
analysis used available data from linkage of symptomatic cases, 12 April to the 10 June 2021
(updated from the previous analysis to 4 June 2021). Hazard ratios for hospitalisation are
combined with odds ratios against symptomatic disease from the test negative case control
analysis described above to estimate vaccine effectiveness against hospitalisation. Methods
and detailed results are available here (17). Similar vaccine effectiveness against hospitalisation
was seen with the Alpha and Delta variants (Table 3).
Table 3. Vaccine effectiveness against hospitalisation for Alpha and Delta variants
Vaccine Status Vaccine Effectiveness
Alpha Delta
Dose 1 78 (64 to 87) 80 (69 to 88)
Dose 2 93 (80 to 97) 96 (91 to 98)
8COVID-19 vaccine surveillance report – week 27
Population impact
Vaccines typically have both direct effects on those who are vaccinated and indirect
effects on the wider population due to a reduced probability that people will come
into contact with an infected individual. The overall impact of the vaccination programme
may therefore extend beyond that estimated through vaccine effectiveness analysis.
Estimating the impact of a vaccination programme is challenging as there is no
completely unaffected control group. Furthermore, the effects of the vaccination
programme need to be differentiated from that of other interventions (for example,
lockdowns or outbreak control measures), changes in behaviour and any seasonal
variation in COVID-19 activity.
PHE and other government and academic partners monitor the impact of the of the
vaccination programme on levels of COVID-19 antibodies in the population and different
disease indicators, including hospitalisations and mortality. This is done through
population-based testing and through modelling which combines vaccine coverage rates
in different populations, estimates of vaccine effectiveness and disease surveillance
indicators.
Vaccine coverage
The data in this week’s report covers the period from 8 December 2020 to 4 July 2021
(week 26) (Figure 1). It shows the provisional number and percentage of people in
England who have had received 1 dose or 2 doses of a COVID-19 vaccination by age
group and week since the start of the programme.
9COVID-19 vaccine surveillance report – week 27
Figure 1. Cumulative weekly vaccine uptake by age
a) Dose 1
100
90
80
80 and over
70
75 to under 80
% Vaccine Uptake
60 70 to under 75
65 to under 70
50
60 to under 65
40 55 to under 60
50 to under 55
30
45 to under 50
20 40 to under 45
10 Under 40
0
50 51 52 53 1 2 3 4 5 6 7 8 9 10 11 12 13 14 15 16 17 18 19 20 21 22 23 24 25 26
Week Number
10COVID-19 vaccine surveillance report – week 27
b) Dose 2
100
90
80
80 and over
70
75 to under 80
% Vaccine Uptake
60 70 to under 75
65 to under 70
50
60 to under 65
40 55 to under 60
50 to under 55
30
45 to under 50
20
40 to under 45
10 Under 40
0
50 51 52 53 1 2 3 4 5 6 7 8 9 10 11 12 13 14 15 16 17 18 19 20 21 22 23 24 25 26
Week Number
11COVID-19 vaccine surveillance report – week 27
Vaccine impact on proportion of population with
antibodies to COVID-19
PHE monitors the proportion of the population with antibodies to COVID-19 by testing
samples provided by healthy adult blood donors aged 17 years and older, supplied by
the NHS Blood and Transplant (NHS BT collection). This is important in helping to
understand the extent of spread of COVID-19 infection (including asymptomatic
infection) in the population and the impact of the vaccine programme. 250 samples from
every geographic region in England are tested each week using 2 different laboratory
tests, the Roche nucleoprotein (N) and Roche spike (S) antibody assays. This dual
testing helps to distinguish between antibodies that are produced following natural
COVID-19 infection and those that develop after vaccination. Nucleoprotein (Roche N)
assays only detect post-infection antibodies, whereas spike (Roche S) assays will detect
both post-infection antibodies and vaccine-induced antibodies. Thus, changes in the
proportion of samples testing positive on the Roche N assay will reflect the effect of
natural infection and spread of COVID-19 in the population. Increases in the proportion
positive as measured by S antibody will reflect both infection and vaccination. Antibody
responses reflect infection or vaccination occurring at least 2 to 3 weeks previously
given the time taken to generate an antibody response.
In this report, we present the results using a 4-weekly average, of testing samples up to
27 June 2021, which takes account of the age and geographical distribution of the
English population. Overall, the proportion of the population with antibodies using the
Roche N and Roche S assays respectively were 16.1% and 88.1% for the period 31
May to 27 June (weeks 22 to 25) (Figure 2). This compares with 15.0% Roche N
seropositivity and 77.5% Roche S seropositivity for the period of 3 May 2021 to 30 May
2021 (weeks 18 to 21). During this period seropositivity using the Roche N assay has
remained stable suggesting there hasn’t been significant ongoing spread of infection in
the population and the continuing increase in seropositivity using the Roche S assay
reflects the growing proportion of adults who have developed antibodies following
vaccination.
Figure 3a and 3b show the proportion of the population with antibodies by age group.
Roche N seropositivity has continued to plateau across the older age groups and this
was first observed in the 70 to 84 age group. A small increase in Roche N seropositivity
is seen in the 17 to 29 year olds from 19.3% in weeks 18 to 21 to 23.3% in weeks 22 to
25. This increase is consistent with recent increases in transmission seen form other
surveillance data. The absence of Roche N increases in older age groups likely reflects
the additional role vaccination is having in reducing viral infection in those already
vaccinated.
12COVID-19 vaccine surveillance report – week 27
The pattern of increases in Roche S seropositivity which are observed follow the roll out
of the vaccination programme with the oldest age groups offered vaccine first. (Figure
3b). Roche S seropositivity increased first in donors aged 70 to 84 and has plateaued
since week 13, reaching 99.5% in weeks 22 to 25. Seropositivity has also plateaued
since week 16 for those aged 60 to 69 reaching 99.1% in weeks 22 to 25. Plateauing in
Roche S seropositivity has been observed since week 19 in those aged 50 to 59
reaching 98.1% in weeks 22 to 25 2021. A notable increase has been observed in the
40 to 49 year olds from 85.8% in weeks 18 to 21 to 95.9% in weeks 22 to 25. Currently
the greatest increase observed is in the 30 to 39 year olds increasing from 52.1% in
weeks 18 to 21 to 87.3% in weeks 22 to 25. A small increase is seen in individuals aged
17 to 29 this week from 46.9% in weeks 18 to 21 to 59.5% in weeks 22 to 25.
The impact of the vaccination programme is clearly evident from the increases in the
proportion of the adult population with antibodies based on Roche S testing. This is
particularly evident amongst individuals aged 50 years and above who have been
prioritised for vaccination as part of the phase 1 programme and since week 15 in those
aged 40 to 49 and 30 to 39 years old as part of phase 2 of the vaccination programme.
This is further supported by the plateauing in the proportion testing positive using the
Roche N assay, in older age groups and likely reflects the additional role of vaccination
is having in reducing infection ahead of reductions seen from national restrictions alone
in younger age groups.
13COVID-19 vaccine surveillance report – week 27
Figure 2: Overall population weighted 4-weekly rolling SARS-CoV-2 antibody seroprevalence (% seropositive) in blood
donors from the Roche S and Roche N assays.
14COVID-19 vaccine surveillance report – week 27
Figure 3: Population weighted 4-weekly rolling SARS-CoV-2 antibody seroprevalence (% seropositive) in blood
donors from the Roche S and Roche N assays by a) age groups 17 to 29, 30 to 39 and 40 to 49, b) age group 50 to
59, 60 to 69 and 70 to 84.
a)
15COVID-19 vaccine surveillance report – week 27
b)
16COVID-19 vaccine surveillance report – week 27
Direct impact on hospitalisations
The number of hospitalisations averted by vaccination, can be estimated by considering
vaccine effectiveness against hospitalisation, vaccine coverage and observed
hospitalisations and through modelling using a range of parameters.
PHE estimates to 27 June 2021 based on the direct effect of vaccination and vaccine
coverage rates, are that around 46,300 hospitalisations have been prevented in those
aged 65 years and over in England (approximately 7,000 admissions in those aged 65 to
74, 18,000 in those aged 75 to 84, and 21,300 in those aged 85 and over) as a result of
the vaccination programme (Figure 4). There is increasing evidence that vaccines
prevent infection and transmission. The indirect effects of the vaccination programme
will not be incorporated in this analysis, therefore the figure of 46,300 hospitalisations
averted is likely to be an underestimate.
Please note this analysis will be updated every 2 weeks.
17COVID-19 vaccine surveillance report – week 27
Figure 4. Plot of daily observed and expected COVID-19 hospitalisations in adults aged 65 and over
2500 100%
90%
Percentage vaccine coverage (cumulative)
2000 80%
70%
Number of hospitalisations
1500 60%
50%
1000 40%
30%
500 20%
10%
0 0%
Date
Observed Expected
D1 Coverage 85+ (25 days earlier) D1 Coverage 75-84 (25 days earlier)
D1 Coverage 65-74 (25 days earlier) D2 Coverage 85+ (11 days earlier)
D2 Coverage 75-84 (11 days earlier) D2 Coverage 65-74 (11 days earlier)
18COVID-19 vaccine surveillance report – week 27
Direct and indirect impact on infection and mortality
The PHE and Cambridge real-time model has been used to track the COVID-19
infection throughout the pandemic, providing key epidemic insights, including estimation
of the reproduction number, R, to the Scientific Pandemic Influenza subgroup on
Modelling (SPI-M) and to the Scientific Advisory Group on Emergencies (SAGE). The
application to data from the first wave has been published in Real-time nowcasting and
forecasting of COVID-19 dynamics in England: the first wave (18). Since the first wave,
the model has been constantly improved to capture the pandemic activity as it develops,
in particular to account for the impacts, both direct and indirect, of the vaccination
programme. The direct impact of vaccination is the number of deaths saved in those that
get infected, whereas the indirect effect incorporates the additional prevention of
infections. The history of real-time modelling outputs can be found at Nowcasting and
Forecasting of the COVID-19 Pandemic (19), with the most recent results on which the
figures here are based is currently available at COVID-19: nowcast and forecast (20).
Vaccination rates in the model are based on the actual number of doses administered,
and the vaccine is assumed to reduce susceptibility to COVID-19 as well as mortality
once infected. Estimates for vaccine efficacy are based on the best available published
results (21). To infer the impact of vaccination, the model was fitted to both ONS
prevalence and daily COVID-19 mortality data in England, resulting in posterior samples
for a range of epidemiological parameters. The posterior samples were then used to
simulate the number of infections and deaths that would have occurred without
vaccination (Figure 5). Finally, the total impact was calculated by comparing the infection
and mortality estimates with vaccination versus the simulated outcomes without
vaccination (Figure 6; Table 4). The figures in Table 4 are expected to continue to grow
rapidly as the number of deaths in the no-vaccination scenario is still showing
exponential growth.
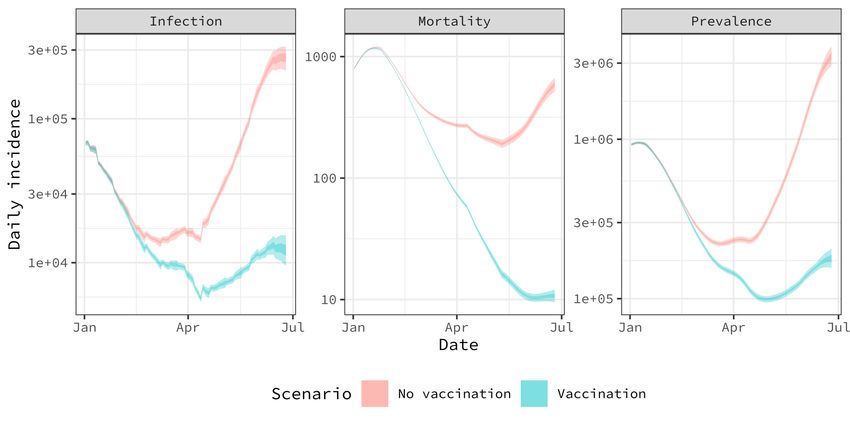
The no-vaccination scenario assumes that no other interventions are implemented to
reduce incidence and mortality. Therefore, the findings presented here should be
interpreted as the impact of the vaccination programme on infection and mortality
assuming no additional non-pharmaceutical interventions were implemented. In practice
it is impossible to predict what interventions would have been implemented in the
absence of vaccination, although it is reasonable to assume that lockdown measures
would have remained in place for substantially longer.
The work presented in this section is joint work completed by PHE and Cambridge
University’s MRC Biostatistics Unit.
Estimates suggest that 30,300 deaths and 8,151,000 infections have been prevented as
a result of the COVID-19 vaccination programme, up to 25 June.
19COVID-19 vaccine surveillance report – week 27
Figure 5. Inferred and predicted incidence, mortality and prevalence with and without vaccination in England. This is
presented on a log scale.
20COVID-19 vaccine surveillance report – week 27
Figure 6. Averted number of infections (left) and deaths (right) due to vaccination (cumulatively)
21COVID-19 vaccine surveillance report – week 27
Table 4. Inferred reduction in infections and mortality as the result of vaccination
up to 25 June 2021. (Infections are rounded to the nearest 1,000, deaths to the
nearest 100.)
Model Outcome Reduction
ONS/Death Infection 8151000 [ 7463000 , 8916000]
ONS/Death Mortality 30300 [ 29000 , 31800 ]
22COVID-19 vaccine surveillance report – week 27
References
1. Public Health England. COVID-19: vaccine surveillance strategy 2021
2. Medicines & Healthcare products Regulatory Agency. Coronavirus vaccine – weekly
summary of Yellow Card reporting 2021
3. Lopez Bernal J, Andrews N, Gower C, Robertson C, Stowe J, Tessier E, and others.
Effectiveness of the Pfizer-BioNTech and Oxford-AstraZeneca vaccines on covid-19
related symptoms, hospital admissions, and mortality in older adults in England: test
negative case-control study. BMJ. 2021;373:n1088
4. Public Health England. Public Health England vaccine effectiveness report – March
2021: Public Health England; 2021
5. Pritchard E, Matthews PC, Stoesser N, Eyre DW, Gethings O, Vihta K-D, and others.
Impact of vaccination on SARS-CoV-2 cases in the community: a population-based
study using the UK’s COVID-19 Infection Survey. medRxiv.
2021:2021.04.22.21255913
6. Public Health England. Public Health England COVID-19 vaccine surveillance report:
20 May 2021(week 20): Public Health England; 2021
7. Whitaker H, Tsang R, Byford R, Andrews N, Sherlock J, Sebastian Pillai P and
others. Pfizer-BioNTech and Oxford AstraZeneca COVID-19 vaccine effectiveness
and immune response among individuals in clinical risk groups. Link will be available at:
https://www.gov.uk/government/publications/phe-monitoring-of-the-effectiveness-of-
covid-19-vaccination
8. Vasileiou E, Simpson CR, Robertson C, Shi T, Kerr S, Agrawal U, and others.
Effectiveness of first dose of COVID-19 vaccines against hospital admissions in
Scotland: national prospective cohort study of 5.4 million people. 2021
9. Hyams C, Marlow R, Maseko Z, King J, Ward L, Fox K, and others. Assessing the
effectiveness of bnt162b2 and chadox1ncov-19 covid-19 vaccination in prevention of
hospitalisations in elderly and frail adults: A single centre test negative case-control
study. 2021
10. Ismail SA, Vilaplana TG, Elgohari S, Stowe J, Tessier E, Andrews N, and others.
Effectiveness of BNT162b2 mRNA and ChAdOx1 adenovirus vector COVID-19
vaccines on risk of hospitalisation among older adults in England: an observational
study using surveillance data. PHE Preprints. 2021
11. Lopez Bernal J, Andrews N, Gower C, Stowe J, Tessier E, Simmons R, and others.
Effectiveness of BNT162b2 mRNA vaccine and ChAdOx1 adenovirus vector vaccine
on mortality following COVID-19. PHE Preprints. 2021
12. Hall VJ, Foulkes S, Saei A, Andrews N, Oguti B, Charlett A, and others.
Effectiveness of BNT162b2 mRNA vaccine against infection and COVID-19 vaccine
coverage in healthcare workers in England, multicentre prospective cohort study (the
SIREN study). 2021
13. Shrotri M, Krutikov M, Palmer T, Giddings R, Azmi B, Subbarao S, and others.
Vaccine effectiveness of the first dose of ChAdOx1 nCoV-19 and BNT162b2 against
23COVID-19 vaccine surveillance report – week 27
SARS-CoV-2 infection in residents of Long-Term Care Facilities (VIVALDI study).
medRxiv. 2021:2021.03.26.21254391
14. Menni C, Klaser K, May A, Polidori L, Capdevila J, Louca P, and others. Vaccine
side-effects and SARS-CoV-2 infection after vaccination in users of the COVID
Symptom Study app in the UK: a prospective observational study. The Lancet
Infectious Diseases. 2021
15. V Shah AS, Gribben C, Bishop J, Hanlon P, Caldwell D, Wood R, and others. Effect
of vaccination on transmission of COVID-19: an observational study in healthcare
workers and their households. medRxiv. 2021:2021.03.11.21253275
16. Harris RJ, Hall JA, Zaidi A, Andrews NJ, Dunbar JK, Dabrera G. Impact of
vaccination on household transmission of SARS-COV-2 in England Public Health
England; 2021
17. Stowe J, Andrews N, Gower C, Gallagher E, Utsi L, Simmons R, and others.
Effectiveness of COVID-19 vaccine against hospital admission with the Delta
(B.1.617.2) variant. 2021
18. Birrell Paul, Blake Joshua, van Leeuwen Edwin, Gent Nick and De Angelis Daniela
(2021). ‘Real-time nowcasting and forecasting of COVID-19 dynamics in England:
the first wave’ Philosophical Transactions of the Royal Society B 376: 20200279
19. MRC Biostatistics Unit. ‘Nowcasting and Forecasting of the COVID-19 Pandemic’
20. Birrell, Paul, Joshua Blake, Edwin van Leeuwen, MRC Biostatistics Unit COVID-19
Working Group, Daniela De Angelis (2021) ‘COVID-19: nowcast and forecast’.
Published 25 June 2021
21. Public Health England (2021). COVID-19 vaccine surveillance report, Week 24
24www.gov.uk/phe
Twitter: @PHE_uk
www.facebook.com/PublicHealthEngland
© Crown copyright 2021
Published 8 July 2021
PHE gateway number: GOV-8931
25You can also read