2020 Results Carlos Torres Vila - Chairman - BBVA
←
→
Page content transcription
If your browser does not render page correctly, please read the page content below
2020 Results
January 29th, 2021

                     Carlos Torres Vila
                     Chairman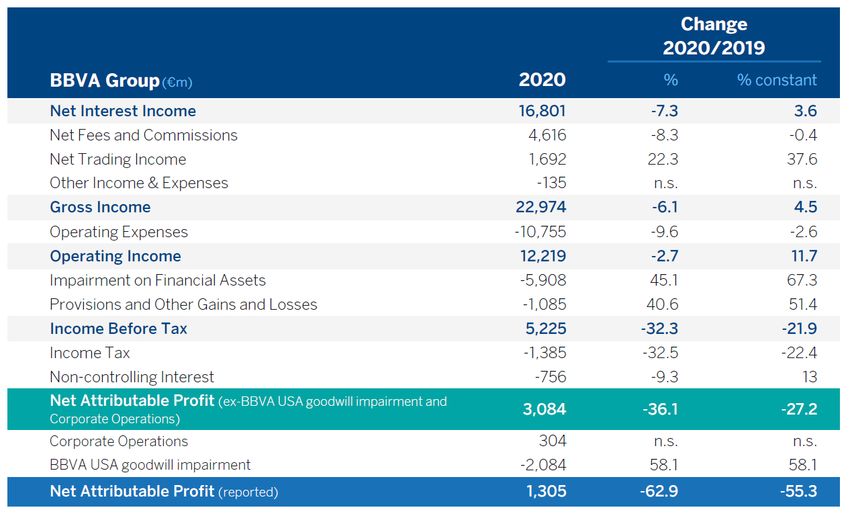
2020 Results     2
                                                                                                                                       January 29 th 2021

Disclaimer

This document is only provided for information purposes and does not constitute, nor should it be interpreted as, an offer to sell or exchange or
acquire, or an invitation for offers to buy securities issued by any of the aforementioned companies. Any decision to buy or invest in securities in
relation to a specific issue must be made solely and exclusively on the basis of the information set out in the pertinent prospectus filed by the
company in relation to such specific issue. No one who becomes aware of the information contained in this report should regard it as definitive,
because it is subject to changes andmodifications.
This document contains or may contain forward looking statements (in the usual meaning and within the meaning of the US Private Securities
Litigation Reform Act of 1995) regarding intentions, expectations or projections of BBVA or of its management on the date thereof, that refer to or
incorporate various assumptions and projections, including projections about the future earnings of the business. The statements contained herein
are based on our current projections, but the actual results may be substantially modified in the future by various risks and other factors that may
cause the results or final decisions to differ from such intentions, projections or estimates. These factors include, without limitation, (1) the market
situation, macroeconomic factors, regulatory, political or government guidelines, (2) domestic and international stock market movements, exchange
rates and interest rates, (3) competitive pressures, (4) technological changes, (5) alterations in the financial situation, creditworthiness or solvency
of our customers, debtors or counterparts. These factors could cause or result in actual events differing from the information and intentions stated,
projected or forecast in this document or in other past or future documents. BBVA does not undertake to publicly revise the contents of this or any
other document, either if the events are not as describedherein, or if such events lead to changes in the information contained in this document.
This document may contain summarised information or information that has not been audited, and its recipients are invited to consult the
documentation and public information filed by BBVA with stock market supervisory bodies, in particular, the prospectuses and periodical information
filed with the Spanish Securities Exchange Commission (CNMV) and the Annual Report on Form 20-F and information on Form 6-K that are filed with
the US Securities and Exchange Commission.
Distribution of this document in other jurisdictions may be prohibited, and recipients into whose possession this document comes shall be solely
responsible for informing themselves about, and observing any such restrictions. By accepting this document you agree to be bound by the foregoing
restrictions.
2020 Results      3
                                                                                                                                               January 29th 2021

2020 achievements

 Successfully navigated through the crisis                                                                              €63 billion1
 with clear priorities
                                                                                                                        DEFERRALS, PAYMENT FLEXIBILITY
                                                                                                                        AND CREDIT FACILITIES PROVIDED
                                                                                                                        THROUGH GOVERNMENT PROGRAMS

 Advanced in our strategy
                                                                                                                        +56%
 addressing accelerating trends
                                                                                                                        DIGITAL CLIENT
                                                                                                                        ACQUISITION VS. 2019

 Delivered excellent results                                                                                            +11.7%
 despite a challenging environment
                                                                                                                        OPERATING INCOME GROWTH
                                                                                                                        VS. 2019 IN CONSTANT EUROS

 Achieved ample strategic optionality                                                                                   €8.5 billion
 with the BBVA USA sale, unlocking value
                                                                                                                        CAPITAL GENERATION

 (1) Includes loans granted throughout the year that have been paid off and undrawn commitments in credit facilities.

                Allowing sizeable distributions to our shareholders in 2021
2020 Results     4
                                                                                                                                        January 29 th 2021

The sanitary crisis has had a strong impact on
economic growth in 2020
     GDP GROWTH ESTIMATES
     (% YoY)

          FOOTPRINT1                                 SPAIN                            MEXICO                              USA
                                                                        7.0
                                                                 5.5
                             4.7                                                                   3.2     3.8                             3.6
                                      4.5     2.0                                                                  2.2
    1.1
                                                                                0,0                                                                 2.4

                                                                                                                                 -3.6
              -7.2
                                                                                           -9.1
                                                         -11.0
  2019A       2020       2021        2022    2019A    2020   2021       2022   2019A    2020      2021     2022   2019A    2020         2021        2022

          TURKEY                                     ARGENTINA                        COLOMBIA                            PERU               10.0
                              5.0                                6.0
                                                                                                     4.8
                                       4.5                                      3.3                                 2.2
     0.9        1.0                                                                                                                                 4.5
                                                                         2.5                               3.8
                                              -2.1

                                                                                           -7.2
                                                         -11.0                                                                   11.5
  2019A        2020       2021       2022    2019A     2020      2021   2022   2019A    2020      2021     2022   2019A     2020         2021       2022

Source: BBVA Research as of Jan-21
(1) Weighted by gross margin
2020 Results              5
                                                                                                                                    January 29th 2021

BBVA has taken a step forward in response to the
COVID-19 crisis

    Protect the health                     Provide an essential                                                 Offer financial
    and safety of our                      service to our                                                       support to our
    employees, clients and                 communities                                                          clients
    society

  BBVA has donated more         Branch openings based on                                      Deferrals of loans and
  than €35 million and has      operational and health protocols                              repayment flexibility
  mobilized more than €11
                                OPEN BRANCHES
                                                                                              € 38 billion2
  million through clients and   % OF TOTAL                     97%
  employees contributions for
  the fight against COVID-19                                                                  Providing credit facilities
                                     59%                                                      through government programs

                                          Mar                Dec                              €25         billion3
  At the peak, 86,000
  teammates working from
                                Reorienting our clients to remote                             Financial support to
  home
                                and digital channels
                                                                                              individuals and businesses
                                                                                              ~3 million clients
                                INTERACTIONS           REMOTE BANKER
                                Global App Visits1     INTERACTIONS
  Return to the office plans    (Pre vs. post COVID)   “My Conversations in Spain”
                                                       (Dec,20 vs Dec,19)
  combining physical and
  remote work
                                  +43%                     +45%

                                                                                 (1) Only taking into account visits that log in the Private Area. (2) Includes
                                                                                 loans that have been paid off. (3) Includes undrawn commitments.
Our strategic priorities successfully address
accelerating trends during the crisis

       Improving our clients’     Helping our clients
       financial health           transition towards a
                                  sustainable future

        Reaching more             Driving operational
        clients                   excellence

        The best and most
                                  Data and Technology
        engaged team
2020 Results     7
                                                                                                                                            January 29th 2021

Leveraging our digital capabilities to better serve
our clients

                    MOBILE CUSTOMERS                                                                GROUP DIGITAL SALES
                    MILLION CUSTOMERS, PERCENTAGE                                                   YTD, PERCENTAGE

                                                                                                                                             64.0%
                                                                                                                                   57.7%
                                                                                                                          51.3%
                                                                                       34.5                      36.3%
                                                                                                  UNITS 21.8%
                                                                      28.8
                                                     23.1
                                   18.0                                                                                                      48.7%
                                                                                                                                   41.9%
                  12.2                                                                                                    33.0%
                                                                                                                 23.1%
                                                                                              VALUE-PRV1 14.8%

                Dec-16           Dec-17           Dec-18           Dec-19           Dec-20              Dec-16   Dec-17   Dec-18   Dec-19    Dec-20

                  24.9%            35.1%            43.8%            51.8%            59.0%

                 MOBILE PENETRATION

(1) Product Relative Value as a proxy of lifetime economic representation of units sold.
2020 Results     8
                                                                                                                                                       January 29 th 2021

We have reached more customers through digital
channels

      GROSS NEW CUSTOMERS ACQUISITION1
      (MN CUSTOMERS, % CUSTOMERS ACQUIRED THROUGH DIGITAL CHANNELS)

                                                                                                                      7.4           7.3
                                                                                            5.5                                                    DIGITAL
                                                                                                                                                 ACQUISITION
                                                             5.0                                                                                  +56%
                                                                                                                                                   vs. 2019

           TOTAL               3.4

                                                                                                                                    33.3%
NON-DIGITAL2
                                                                                                                      21.2%                2.4
                                                                                            14.4%
                                                                                                                              1.6
                                                              8.6%                                    0.8
                                3.7%                                   0.4
         DIGITAL                          0.1

                            2016                            2017                          2018                        2019          2020

(1) Gross customer acquisition through own channels for retail segment. (2) Branches, external salesforce and ATMs.
2020 Results      9
                                                                                                                                                January 29th 2021

We continue to successfully deliver on sustainability
strategy
Helping our clients transition towards a more sustainable future
 OVERDELIVERING ON BBVA’S                        PROVIDING SUSTAINABLE FINANCE AND ADVICE
 2025 PLEDGE                                     Wholesale clients                                                 New sustainable solutions for all segments

                                  €   100 Bn     €Bn                             11,0                                             Energy-efficient linked
                                                                                                                                  mortgages
                € 50 Bn                                            8,6                    Sustainable
                                                                                          Loans1
                                                                                                                                  Carbon footprint
                                                    3,8
                                                                                          Sustainable
                                                                                                                                  calculator
                                                                                          Bonds2

                                                    2018           2019          2020                                             Hybrid and electric
 2018       2020                         2025    Note: preliminary data. (1) Corporate Sustainable Loans
                                                 include BBVA's underwriting share in: (i) Certified Loans, (ii)
                                                                                                                                  vehicles loans
                                                 Project Finance and (iii) KPI and/or ESG Linked Loans. (2)
                                                 BBVA's underwriting share in ESG bonds (BBVA led bond
                                                 issuances for a total €22 Bn in 2020).

Aligning our Portfolio                      Increasing                                                             Leading sustainability
  Climate risk included in loan
                                            transparency                                                           indexes
  admission frameworks
  Internal taxonomy on transition risk

                                                                                                                                                 #   1
                                                                                                                                                 EUROPEAN
                                                                                                                                                 BANK
2020 Results 10
January 29 th 2021
Solid quarterly profit evolution, improving capital position
and tangible book value per share
NET ATTRIBUTABLE PROFIT CET1 FULLY LOADED TBV/SHARE + DIVIDENDS
(€M CURRENT) (%) (€/Share)
€ 3.08 Billion
in 20203 PRO-FORMA 4
14.58%
Dec-20
1,320
1,163 1,141 304
CORPORATE 11.74% 11.73%
OPERATIONS2
11.52% 6.27
6.21
11.22%
636 6.03 6.00
5.94
292 10,84%
1
4Q19 1Q201 2Q20 3Q20 4Q20 Dec-19 Mar-20 Jun-20 Sep-20 Dec-20 Dec-19 Mar-20 Jun-20 Sep-20 Dec-20
(1) Excluding BBVA USA goodwill impairment (1,318€m in 4Q19 and 2,084 €M in 1Q20). (2) Includes capital gain from the JV with Allianz and closed in 4Q20. (3) Excluding BBVA USA goodwill impairment (2,084 €M)
and corporate operations. (4) Includes impact from BBVA USA sale.2020 Results 11
January 29 th 2021
Our commitment to efficiency is reinforced by
the acceleration of trends such as digitization
DIGITAL TRANSACTIONS1 COST-TO-INCOME RATIO OPERATING JAWS
TRANSACTIONS PER CLIENT BBVA GROUP. PERCENTAGE (12M20 YOY, %; € CONSTANT)
29
BBVA BBVA
-521 bps
vs. peers2
-249 pbs
21 52.0 51.9 since 2015 INFLATION
In footprint
18 4.2%
17 2.7% Average 12m
49.5 49.4
12 48.7
10 BBVA Spain
46.8
-2.6%
Core Operating
2018 2019 2020 2015 2016 2017 2018 2019 2020
Revenues Expenses
(1) Includes monetary and non-monetary transactions excluding sales and information inquires. (2) European peer group: BARC, BNPP, CASA, CMZ, CS, DB, HSBC, ISP, LBG, RBS, SAN, SG, UBS, UCG.
European Peer Group f igures 9M20. BBVA figures 12M20.2020 Results 12
January 29 th 2021
Risk indicators impacted by COVID-19 but better
than initial estimates
COST OF RISK NPL & COVERAGE RATIOS
(%) (%)
2.57%
2.04% 86% 85% 85%
81%
77%
1.69% COVERAGE
2.57% 1.51%
1.12% YtD CoR
1.51%
Quarterly CoR NPL
1.02% 0.97% 3.8% 4.0%
0.94% 3.8% 3.7%
3.6%
4Q19 1Q20 2Q20 3Q20 4Q20 Dec-19 Mar-20 Jun-20 Sep-20 Dec-20
(1) In constant Euros.
Very significant effort to increase our reserves (impairments +67% in 2020 vs 20191)2020 Results 13
January 29 th 2021
We closed the year with a strong capital position and
revising our target ratio upwards
New CET1 FL target: 11.5 - 12.0%
CET1 FULLY-LOADED CET1 TARGET TO REQUIREMENT 2
PERCENTAGE € c.8bn BPS
excess capital
PEER 1 435
1 over target1
14.58%
341
New target
PEER 2 335
New Target Range 11.50-12.00%
11.73% PEER 3 314
Previous Target Range 10.84-11.34% PEER 4 314
PEER 5 295
Minimum requirement 8.59%
PEER 6 278
275
Previous target
PEER 7 250
2020 2020
PEER 8 206
Pro-Forma
(1) Includes the sale of BBVA USA. Excess capital calculated comparing BBVA’s 2020 %CET1 Pro-Forma versus 12% (upper part of our new target range).
(2) Distance of CET1 published targets (considering the upper part when is provided as a target range) versus 2020 CET1 SREP Requirement. European Peer Group subject to ECB regulation: BNPP, CA, CMZ, DB, ISP,
SAN, SG, UCG.2020 Results 14
January 29 th 2021
BBVA USA sale: a historic deal that
unlocks value
LARGE SIZE TRANSACTION AT MAIN RATIOS
VERY ATTRACTIVE PRICE
2.5x
19.7x
c. €10bn1 PER
2019
€3.8 bn
1.34x
P/TBV
Sep 2020
Value assigned by Transaction
analyst price
consensus
(1) Based on a EUR/ USD exchange rate of 1.20.2020 Results 15
January 29th 2021
BBVA USA transaction shows disciplined value-based
approach to capital allocation
We will deploy the excess capital:
In our markets through profitable growth
and costs’ reduction
Through increased distributions to
shareholders
Significant EPS and TBV per share accretion potential2020 Results 16
January 29th 2021
Capital deployment. Shareholder distributions
Extraordinary
2020 dividend 2021 ordinary dividend distributions
Follows regulatory Plan to recover our clear, The excess capital allows
guidance predictable and sustainable for additional
policy once regulatory distributions to
€5.9 cents per share restrictions are lifted shareholders, through
(maximum allowed by (expected in Sep 2021)2 buybacks and
regulatory guidance1) extraordinary dividends
35-40% payout
100% cash Targeting a buyback of
100% cash around 10% of ordinary
shares, after the closing of
Payment in April 2021
Payments in October BBVA USA transaction3
2021 and April 2022
(1) Includes dividend accrual of 5.9 Euro cents per share (gross) payable in April-21 subject to shareholders and supervisors approval. Calculated as the 15% payout over
2020 results, excluding goodwill impairments, the capital gain from the JV with Allianz and AT1 Coupons.
(2) Subject to shareholders and supervisors approval.
(3) Any potential repurchase of shares would, at the earliest, take place after the expected close of the BBVA USA transaction in mid 2021. Any decision on a repurchase of
ordinary shares would (i) require certain shareholders resolutions and supervisors approval and the lifting of the ECB recommendation on distributions to shareholders, and
(ii) take into consideration share prices, among other factors.2020 Results
January 29th, 2021
Onur Genç
Consejero Delegado2020 Results 18
January 29th 2021
2020 top financial messages
1
Solid core revenue growth NII + FEE INCOME (€ constant)
+2.7% vs. 12M19
2
Very strong cost control and efficiency OPERATING EXPENSES (€ constant)
-2.6% vs. 12M19
3
Resilient pre-provision profit growth OPERATING INCOME (€ constant)
+11.7% vs. 12M19
4
Risk indicators impacted by COVID-19 COST OF RISK (YtD)
but better than initial expectations 1.51% vs. 1.50-1.60% updated guidance
vs. 1.02% in 12M19
5
Reinforced capital position after BBVA USA sale PRO-FORMA CET1 FL
14.58%
6
Continue leading profitability metrics ROTE1
European peer
7.8% vs. 4.5% group average
7
Expecting to resume shareholder distribution 2020 DIVIDEND2
€5.9 cents per share
(1) Excludes goodwill impairments from BBVA and European peers. Excludes capital gains from corporate operation from BBVA. European Peer Group: BARC, BNPP, CASA, CMZ, CS, DB, HSBC, ISP, LBG, RBS, SAN,
SG, UBS, UCG. European Peer Group figures 9M20. BBVA figures 12M20. (2) Includes dividend accrual of 5.9 Euro cents per share (gross) payable in April-21 subject to shareholders and supervisors approval.
Calculated as the 15% payout over 2020 results, excluding goodwill impairments, the capital gain from the JV with Allianz and AT1 Coupons.2020 Results 19
January 29 th 2021
2020 Profit & Loss2020 Results 20
January 29 th 2021
Spain
RESULTS ACTIVITY
12M20 (€m; YoY%) DEC-20 (YoY%)
NET INTEREST INCOME
LENDING1 CUSTOMER FUNDS
3,553 -0.4%
FEES AND
+0.8% +8.1%
COMMISSIONS
1,802 +2.9%
ASSET QUALITY RATIOS
OPERATING EXPENSES
-3,039 -6.6% 60% 68% 67%
COVERAGE
OPERATING INCOME
2,515
4.44%
4.32% 4.27%
+4.7%
NPL
IMPAIRMENT ON FINANCIAL ASSETS
0.80% 0.67%
-1,167 n.s. 0.18% (2)
COST OF RISK YTD
NET ATTRIBUTABLE PROFIT
4Q19 3Q20 4Q20
606 -56.3%
(1) Perf orming loans under management. Note: activity exclude repos.
(2) 4Q19 CoR ex mortgage portfolio sale in 2Q19.
Core Revenue growth Excellent expenses Growth in lending driven by Front-loaded COVID
driven by fees management, improving commercial segments, supported provisions set aside in 1H20
the efficiency ratio by State guaranteed loans and best in class coverage2020 Results 21
January 29 th 2021
USA
RESULTS ACTIVITY
12M20 (€m; YoY % constant) DEC-20 (YoY %, € constant)
NET INTEREST INCOME
LENDING1 CUSTOMER FUNDS
2,284 -2.6%
NET FEES & COMMISSIONS
0.0% +13.1
%
665 +5.5%
ASSET QUALITY RATIOS
OPERATING EXPENSES
-1,870 -2.8% 101% 95% 84%
COVERAGE
OPERATING INCOME
1.281 1.93% 2.06%
1.10%
+4.4% NPL RATIO
IMPAIRMENT ON FINANCIAL ASSETS
1.69% 1.18%
-776 +44.3% 0.88%
COST OF RISK (YTD)
NET ATTRIBUTABLE PROFIT 4Q19 3Q20 4Q20
429 -25.5%
(1) Perf orming loans under management. Note: Activity excludes repos.
Positive jaws and cost reduction, Flat lending evolution; lower activity in retail and Asset quality better
resulting in a significant operating Corporate & Investment Banking has been offset by than expected
income growth commercial portfolios, driven by State guaranteed loans2020 Results 22
January 29 th 2021
MEXICO
RESULTS ACTIVITY1
12M20 (€m; YoY% constant) DEC-20 (YoY%, € constant)
NET INTEREST INCOME
LENDING CUSTOMER FUNDS
5,415 -0.7%
-0.6% +10.5%
NET FEES & COMMISSIONS
1,065 -6.6%
ASSET QUALITY RATIOS
OPERATING EXPENSES
-2,340 +0.7%
136% 170% 122%
COVERAGE
OPERATING
INCOME
3.33%
4,677 -1.1%
2.36% 2.29% NPL
IMPAIRMENT ON FINANCIAL ASSETS
3.01% 4.27% 4.02%
-2,172
COST OF RISK YTD
+45.6%
4Q19 3Q20 4Q20
NET ATTRIBUTABLE PROFIT
1,759 -25.8%
(1) Perf orming loans and Customer Funds under management, excluding repos, according to local GAAP.
Costs under control, Flat lending evolution; Growth in mortgages and public Asset quality in
significantly growing sector offsetting deleverage of commercial portfolios, and line with
below inflation consumer & credit cards expectations2020 Results 23
January 29 th 2021
TURKEY
RESULTS ACTIVITY1
12M20 (€m; YoY % constant) DEC-20 (YoY %, € constant)
NET INTEREST INCOME LENDING CUSTOMER FUNDS
2,783 +25.2% LIRAS: +33.6% LIRAS: +25.5%
NET FEES & COMMISSIONS
FC: -5.4% FC: +7.9%
510 -9.9%
ASSET QUALITY RATIOS
OPERATING EXPENSES
-1,029 +7.3% 75% 82% 80%
COVERAGE
OPERATING INCOME
2,544 6.99% 7.11% 6.58%
+35.6% NPL RATIO
IMPAIRMENT ON FINANCIAL ASSETS
2.07% 2.00% 2.13%
-895 +25.0% COST OF RISK (YTD)
4Q19 3Q20 4Q20
NET ATTRIBUTABLE PROFIT
563 +41.0%
(1) Foreign currency (FC) evolution excluding FX impact. Bank only. Performing loans and deposits under management, excluding repos, according to local GAAP.
Robust operating income Cost growth significantly Significant Turkish Lira loan Asset quality
growth, driven by NII, NTI below inflation growth, driven by commercial in line with
and expenses control portfolio expectations2020 Results 24
January 29 th 2021
SOUTH AMERICA
RESULTS1 ACTIVITY2
12M20 (€m; YoY % constant) DEC-20 (YoY %, € constant)
NET INTEREST INCOME
COLOMBIA PERÚ ARGENTINA
2,701 +0.9%
NET FEES & COMMISSIONS
+4.0% +20.1% +47.3
%
484 +0.6% ASSET QUALITY RATIOS
COST OF RISK (YTD)
OPERATING EXPENSES
2.98%
-1,372 1.67% 2.64%
+2.8% COLOMBIA
OPERATING INCOME
1.45% 2.25% 2.13%
1,853 +0.8%
PERU
2.59% 3.24%
IMPAIRMENT ON FINANCIAL 4.22%
ARGENT INA
ASSETS1
-864 +34.0% 4Q19 3Q20 4Q20
NET ATTRIBUTABLE PROFIT
446 -22.6% COLOMBIA 165 -28.9% PERÚ 110 -41.8% ARGENTINA 89 n.s.
(1) South America at constant perimeter (excludes BBVA Chile in 2018). (2) Performing loans under management. Nota: Activity excludes repos.
Colombia: operating income growth (6,2%) Peru: significant growth in activity Argentina: continues to show a
thanks to NII growth due to good spread supported by government programs. positive contribution although
management, and control of expenses Improvement in the cost of risk since 1Q20 affected by hyperinflation
growing below inflationFinal remarks and 2021 outlook
1Q20 Results        26
                                                                   April 30th 2020

2020 in review

 Successfully navigated through the crisis with clear
 priorities: first and foremost , the safety and health of our
 employees, clients and society, and support our clients

 Advanced in our strategy addressing
 accelerating trends

 Delivered excellent results despite a
 challenging environment
  •   Strong Operating Income growth (+11.7%)
      driven by core revenue and very strong cost
      control
  •   Risk indicators better than initial
      expectations
  •   Outstanding capital position

 Achieved ample strategic
 optionality with the BBVA USA
 sale, unlocking value
1Q20 Results 27
April 30th 2020
2021 Outlook
Core revenues to continue growing with
improving mix, price management and
fee income as key levers
Costs to grow below inflation
2021 CoR below 2020 levels,
although uncertainties remain
Sizeable distributions to our
shareholders in 2021You can also read