Uranium: Climbing the Wall of Worry - Price is Everything - October 2020 Confidential - Not for distribution Past performance is not indicative of ...
←
→
Page content transcription
If your browser does not render page correctly, please read the page content below
Uranium: Climbing the Wall of Worry - Price is Everything

October 2020

                                                                Confidential - Not for distribution
                                                 Past performance is not indicative of future results
                                                                          Confidential - Not for distribution
                                                           Past performance is not indicative of future results
Disclaimer
This document has been prepared by Lloyd Harbor Capital Management, LLC (“LHCM”) for investors who qualify to invest in the types of investments
described herein. Generally, they would include investors who are both (a) “Accredited Investors” under the U.S. Securities Act of 1933, as amended, and
(b) “Qualified Purchasers” under the U.S. Investment Company Act of 1940, as amended. This document may include estimates, projections and other
“forward-looking” statements. Due to numerous factors, actual events may differ substantially from those presented. This document is being provided
for information purposes only and does not constitute an offer to sell any securities. An offer or solicitation may only be made through the particular
private placement memorandum for the applicable fund. Before making an investment in any of the LHCM funds, potential investors should carefully
read the private placement memorandum for the applicable fund, which contains additional information needed to evaluate the investment and
provides important disclosures concerning risks, fees and expenses. The information in this document is qualified in its entirety by the terms and
conditions in such documents. Certain of the information in this document is confidential. Please do not distribute this material or copies of it to any
third parties other than your own professional advisors. The information contained herein is current as of its date. Therefore, this document may only
be relied upon as of the date hereof, is subject to modification, change or supplement without prior notice to you (including without limitation any
information pertaining to portfolio composition), and does not constitute investment advice or recommendations. Opinions and estimates offered
herein constitute LHCM’s judgment and are subject to change without notice, as are statements of financial market trends, which are based on current
market conditions. The information in this publication has been obtained from sources believed to be reliable but LHCM does not represent or warrant
that it is accurate or complete. LHCM does not accept any liability for loss arising from use of this document or its contents. Information, opinions, or
commentary concerning the financial markets, economic conditions, or other topical subject matter have been prepared, written, or created prior to the
creation of this document and may not reflect current, up-to-date, market or economic conditions. LHCM disclaims any responsibility to update such
information, opinions, or commentary. To the extent views forecast market activity, they may be based on many factors in addition to those explicitly
stated in this document. It is not possible to list all assumptions that may be relevant to understanding the forecast. Forecasts of experts inevitably
differ. Views attributed to third parties are presented to demonstrate the existence of points of view, not as a basis for recommendations or as
investment advice. Portfolio managers who may or may not subscribe to the views expressed in this document make investment decisions for funds
managed by LHCM or its affiliates.

                                                                                                                             Confidential - Not for distribution
2                                                                                                             Past performance is not indicative of future results
Common Investor Fears About Nuclear Power and Uranium
1. Nuclear power isn’t Safe
2. Nuclear Power isn’t a growth business.
3. The Kazakh’s can ramp production and fill any deficit.
4. All combined State-Owned production can meet all demand.
5. All State-owned and C&M mines at $45 lb. can meet all demand.
6. All State-owned + C&M + Secondary supply can meet all demand.
Confidential - Not for distribution
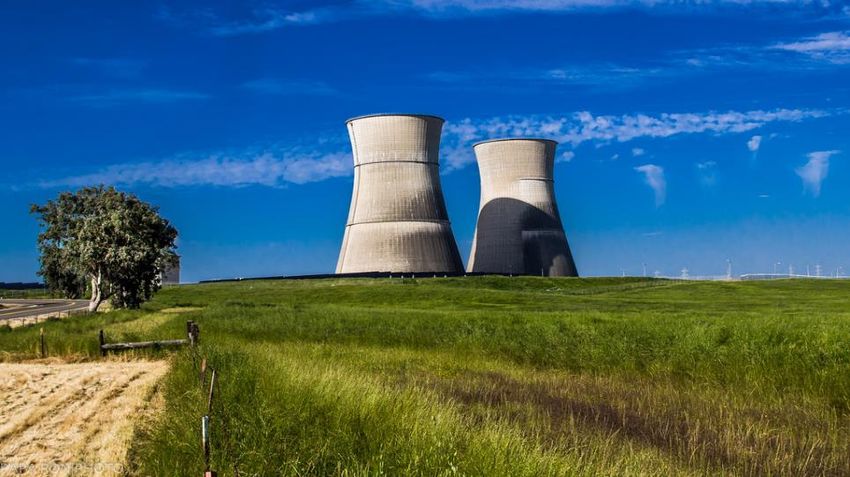
3 Past performance is not indicative of future resultsReality: Nuclear Power Must Be Part of Any Climate Change Playbook
Clean
Safe
Reliable
Confidential - Not for distribution
4 Past performance is not indicative of future resultsClean, Safe & Reliable: Nuclear is Here to Stay
11% of Global Electricity Generation
20% of United States Electricity Generation
Almost Zero Carbon Emissions
“Base load” Power
Operates 24/7 Versus Intermittent Power Like Wind and Solar
Significant New Capital Committed Globally
$500 Billion+ Globally to Build New Reactors
Strong Demand Growth
~2% Per Annum Through 2030
Confidential - Not for distribution
5 Past performance is not indicative of future resultsNuclear Power is Clean Power
Nuclear power produces electricity with almost no carbon output, the villainous
element of global warming.
gCO2/kWh
900
820
800 740
700
gCO2 Emission per kWh
600
490
500
400
300
230
200
100 38 41 48
12 12 24 27
0
Source: WNA
Confidential - Not for distribution
6 Past performance is not indicative of future resultsNuclear Power Is the Safest Way to Turn Your Lights On
Nuclear is the safest form of electricity generation
Deaths per thousand terawatt hour
120,000
100,000
80,000
60,000
40,000
20,000
0
Nuclear Wind Solar PV Hydroelectric Natural Gas Coal
Source: Statista
Confidential - Not for distribution
7 Past performance is not indicative of future resultsNuclear Power is Reliable Electricity
Nuclear is the unparalleled workhorse of electricity generation
Days at Full Power
400
350
300
250
200
150
100
50
0
Solar PV Wind Hydroelectric Natural Gas Coal Nuclear
Source: EIA Electric Power Monthly
Confidential - Not for distribution
8 Past performance is not indicative of future resultsNuclear Power is a Growth Business
Gigawatts of Nuclear Power
500
450
400
350
Gigawatts Electricity
300
250
200
150
100
50
0
2019 2020 2021 2022 2023 2024 2025 2026 2027 2028 2029 2030
Source: WNA Nuclear Fuel
Report 2019 Reference Case
Confidential - Not for distribution
9 Past performance is not indicative of future resultsAnd So Is The Feedstock - Uranium
Uranium Requirements
230
220
210
200
Million lbs. U308
190
180
170
160
150
2020E 2021E 2022E 2023E 2024E 2025E 2026E 2027E 2028E 2029E 2030E
WNA Requirments Reference Case
Source: WNA
Confidential - Not for distribution
10 Past performance is not indicative of future resultsThe Uranium Investment Case
The Uranium Sector Offers Exceptional Asymmetric Risk/Reward
Major dislocation between the math and the narrative.
Asymmetry due to very complex and opaque nuclear fuel cycle
Due to complexity and perceived negatives of nuclear, few bother doing the work
Industry Consultants – recency bias married with non-commercial supply analysis
Small and Significantly Underfollowed Equity and Physical Commodity Sector
Hardly any institutional ownership and even most commodity analysts don’t follow
Investor fatigue from multi-year downturn
Price Collapsed ~90% from peak to trough in 2017. Quietly up 66% since then.
Mining equities fell even more
Few ways to play the turn. Number of miners, developers and explorers from 500 to
40 and many of those are not investable.
Confidential - Not for distribution
11 Past performance is not indicative of future resultsA History of Boom/Bust Prices
Confidential - Not for distribution
12 Past performance is not indicative of future resultsMaterially Better Set-Up Now vs. Prior Bottom
Forecast Then – No Deficits Forecast Now – Deficits
250 $31
250 $120
$30 $30
200
$97 $100
200 $29
Million Lbs. U308
Price per Lb.
$80 150
150 $72 $28
$63 $60
$59 $27
$52 $54 $53 100
100
$41 $40
$32 $35 $39 $26 $26
50 50
$20 $25
0 $0 0 $24
2005 2006 2007 2008 2009 2010 2011 2012 2013 2014 2015
Existing Production New Primary Supply
Secondary Supply Requirements Existing Production New Primary Supply
Avg. Spot Price Secondary Supply Group 1 Restarted Idled Capacity
Requirements U Price
Source: 3rd party consultant reports Source: 3rd party consultants and WNA
Nuclear Fuel Report 2019
Confidential - Not for distribution
13 Past performance is not indicative of future resultsLet’s Talk Uranium
How the Uranium Market Got Here and How The Past Impacts the Future…
The Uniqueness of the Sector. Understanding the Market Structure is Critical…
The Market is Transitioning and Climbing the Wall of Worry….
Let’s Lay Out the Math….
Confidential - Not for distribution
14 Past performance is not indicative of future resultsHow Did Uranium Prices Get Here?
March 2011 Fukushima Disaster
Japan accounted for 13% of world uranium demand
54 reactors accounted for nearly 30% of its electricity generation
Reactors shut down soon after the accident
Prolonged safety inspections for all 54 reactors, 12 permanently closed
Investor interest dried up
Kazakhstan, the largest and lowest cost producer, continued to ramp supply
Cameco brought significant supply online into an oversupplied market in 2014
Protected by Long-Term contracts, producers were slow to make necessary cuts
Weak demand led to increased secondary supply from enrichment companies
Confidential - Not for distribution
15 Past performance is not indicative of future resultsA Bull Market in The Uranium Price is Quietly Underway
Climbing The Wall of Doubt
$40
U308 spot price +66% from the bottom
$35
$30
$25
$20
$15
$10
Confidential - Not for distribution
16 Past performance is not indicative of future resultsWhat a Difference A Few Years Makes
Q4 2016: Bottom Q3 2020: Today
No major supply cuts 25% of global supply cut
Commercial inventories high Commercial inventories in-line
Secondary supplies plentiful Secondary supplies declining
Structural surplus Structural Deficit - to shrink the
deficit, new mines are needed and
most mines on standby need prices
Carry-trade reduced need for LT
north of $50 per lb.
contracting
Carry trade receding
Uncovered demand low
Uncovered demand ~ similar to last
cycle lows
Confidential - Not for distribution
17 Past performance is not indicative of future resultsIgnore The Narrative, Mine the Arithmetic Gap
Bear Case Today Arithmetic Today
Production cuts not enough Production Cuts = Supply Deficit
Spot isn’t high enough Price is Everything. Need $50+ or
mines stay shut
Mines easily turned back on
New mines needed to fill deficit
Underfeeding is an overhang
Underfeeding impact is past peak
Inventories still too big
Inventories drawing down
China slowing down new builds
China New Builds Accelerating
Confidential - Not for distribution
18 Past performance is not indicative of future resultsUnderstanding Kazakhstan – The ~40% Market Share Giant
All State-Owned Current and Projected Production
140
120
100
Million Lbs. U308
80
60
40
20
0
2020E 2021E 2022E 2023E 2024E 2025E 2026E 2027E 2028E 2029E 2030E
Kazakhstan Uzbekistan Ukraine Russian Domestic Chinese Domestic China - Namibia France- Niger Other
Source:3rd party research, various
company reports
Confidential - Not for distribution
19 Past performance is not indicative of future resultsKazakh Production Peaks in 2023
80
70
60
Million Lbs. U308
50
40
30
20
10
0
2020E 2021E 2022E 2023E 2024E 2025E 2026E 2027E 2028E 2029E 2030E
KAP Production Per Prospectus ex-2020 KAP Consensus Production
Source: 3rd party research, sell-side, Kazatomprom IPO
document
Confidential - Not for distribution
20 Past performance is not indicative of future resultsWhich Squares With Its Capital Spending Plans
Kazatomprom IPO Document
Confidential - Not for distribution
21 Past performance is not indicative of future resultsEven Kazatomprom Acknowledges It Can’t Fill The Deficit
“The uranium story is on the supply side…by
2030 we will need two new Kazatomprom’s,
which presents an interesting challenge, where
are those pounds going to come from?”
Riaz Rizvi, Chief Commercial Officer, Kazatomprom
Kazatomprom Capital Markets Day – September, 2019 Markets
Day – September 2019
Confidential - Not for distribution
22 Past performance is not indicative of future resultsMassive Deficits < $45/lb.-$50/lb. With Kazakh’s At Consensus Production
Supply/Demand If L-T Prices Stay Below $45 Kazakh’s at current market
300 expectations
200 Includes all State-owned
production i.e., Kaz., Uzbek.,
100 Ukrainian, Russian, Chinese,
French, and Indian.
0
Includes Cigar Lake back in
-100
Million lbs. U308
2020.
-200
Includes Kazakh’s back in
-300 2020.
-400 McArthur River doesn’t
come back.
-500
No pre-COVID C&M mines
-600 back.
-700
No new mines built.
2020 2021 2022 2023 2024 2025 2026 2027 2028 2029 2030
WNA Requirements SCP Requirements Total Supply Surplus/(Deficit) Cumulative Surplus/(Deficit)
Source. Company reports, 3rd party research,
SCP estimates, WNA 2019 Fuel Report
Confidential - Not for distribution
23 Past performance is not indicative of future resultsMassive Deficits < $45/lb.-$50/lb. With Kazakh’s At FULL Production
Kazakh’s at Full run-
Supply/Demand If L-T Prices Stay Below $45 – Kazakh’s Full Run-Rate rate from ‘23-’30
300
Includes all State-
200 owned production
i.e., Kaz., Uzbek.,
100 Ukrainian, Russian,
Chinese, French, and
0
Indian.
-100
Million lbs. U308
Includes Cigar Lake
-200
back in 2020.
-300
Includes Kazakh’s back
-400 in 2020.
-500
McArthur River
-600 doesn’t come back.
-700 No pre-COVID C&M
2020 2021 2022 2023 2024 2025 2026 2027 2028 2029 2030
mines back.
WNA Requirements SCP Requirements Total Supply Surplus/(Deficit) Cumulative Surplus/(Deficit)
No new mines built.
Source. Company reports, 3rd party research,
SCP estimates, WNA 2019 Fuel Report
Confidential - Not for distribution
24 Past performance is not indicative of future resultsMoving on From Kazakhstan
Confidential - Not for distribution
25 Past performance is not indicative of future resultsMassive Deficit < $45/lb. w/ Kazkah’s at Full, McArthur Back, OD Expansion
McArthur River back in 2023.
Kazakh Full Run-Rate, Olympic Dam Expansion & McArthur
River Back Olympic Dam expansion added
300 (highly uncertain).
200
Includes all State-owned
100 production i.e., Kaz., Uzbek.,
Ukrainian, Russian, Chinese,
Million lbs. U308
0 French, and Indian.
-100 Includes Cigar Lake back in 2020.
-200
Includes Kazakh’s back in 2020.
-300
No pre-COVID C&M mines
-400 back(except McArthur).
-500 No new mines built.
2020 2021 2022 2023 2024 2025 2026 2027 2028 2029 2030
WNA Requirements SCP Requirements Total Supply Surplus/(Deficit) Cumulative Surplus/(Deficit)
Source. Company reports, 3rd party research, SCP estimates,
WNA 2019 Fuel Report
Confidential - Not for distribution
26 Past performance is not indicative of future resultsPrice is EVERYTHING; Don’t Confuse Costs With Required Selling Price
~105M pounds from existing
mines have an AISC at or
80 below spot price today. This
Annual Requirements 2020-2030, ~200M lbs./yr.
is cost, not where it can be
sold to account for profit.
Operating Mines with AISC < $50/lb. ~140M lbs./yr. (~23M of that
70 That requires a much higher
not producing)
price.
Secondary Supply (ex-drawdowns) ~25M lbs./yr.
60 Of that, pre-COVID,
production would have been
Minimum Shortfall back of envelope. ~35M lbs./yr.
~ 90M lbs. from that cohort.
Price matters.
AISC ($/lb U3O8)
50
Oh yeah, of that ~140M lbs. with AISC below $50, 23M lbs. are on care and
maintenance and another 3M lbs. depletes within a couple of years.
~140m lbs. have an AISC
40 below $50. Again, that is
~40% of average annual demand 2020-2030, from production with an AISC <
cost. Not selling price
today’s spot price.
required.
30
Annual Demand 2020-2030
~200M lbs. per year.
Australia
Namibia
Namibia
20
Russia
Namibia
Niger
At today’s spot price of $33,
Russia
Kazakhstan
Canada
Niger
Kazakhstan
Kazakhstan
Canada
Kazakhstan
Australia
Kazakhstan
Kazakhstan
only about 100M lbs. have an
Uzbekistan
Kazakhstan
Kazakhstan
Kazakhstan
Kazakhstan
Australia
AISC at or below that price.
Kazakhstan
Kazakhstan
10
Only ~80M lbs. being
0 produced there. (44% of next
0 10 20 30 40 50 60 70 80 90 100 110 120 130 140 year’s demand).
Cumulative Production (million lbs.) U3O8
Source: SCP estimates and various
company reports
Confidential - Not for distribution
27 Past performance is not indicative of future resultsPrice is EVERYTHING, As Witnessed By Huge Production Cuts
Production Cuts and Planned Closures
0
-5 Cigar Lake
Akdala
-10 East Mynkuduk
Zarechnoye
-15 Somair
South Moinkum
-20
Million Lbs. U308
Cominak
Ranger
-25
Somair
Kazatomprom (Actual)
-30
Smith Highland-Ranch
Crowe Butte
-35
Langer Heinrich
McArthur River
-40
Rabbit Lake
-45 Rossing
Kayelekera
-50
2014 2015 2016 2017 2018 2019 2020 2021 2022 2023 2024 2025 2026 2027 2028 2029 2030
Source: Company reports, SCP Estimates and pre-COVID
Confidential - Not for distribution
28 Past performance is not indicative of future resultsAnd Some of Those Lbs. Are Permanently Gone Due To Depletion
Permanently Lost Pounds Due to Mine Closures
0.0
-5.0
-10.0
Million Lbs. U308
-15.0
-20.0
-25.0
-30.0
-35.0
2020 2021 2022 2023 2024 2025 2026 2027 2028 2029 2030
Cominak Ranger South Moinkum Somair Zarechnoye East Mynkuduk Akdala Cigar Lake
Source: Company Reports and SCP Estimates
Confidential - Not for distribution
29 Past performance is not indicative of future resultsPrice is EVERYTHING: The Solution To Staggering Deficits
$55 LT Price is a starting point to incentivize new production and
motivate most producers to contemplate bringing back mines from care
and maintenance.
But that won’t eliminate the deficits, it can only reduce them. Much
higher prices than $55 are needed to bring the market into balance
AND enable utilities to re-stock.
The deficit horse left the barn already due to contracting apathy. Risk
has transferred from suppliers to nuclear utilities.
Confidential - Not for distribution
30 Past performance is not indicative of future resultsLT Contracting Has To Start As Fallen Well Short of Consumption
Long-Term Contracting As a % of Demand
160%
Since 2001. Average 70%
145%
140% 137% 135% Since 2013, Average 41%
121%
118%
120%
100%
81%
78%
80% 73%
60%
50% 49% 49%
47% 47%
42% 44%
39% 39%
40%
31%
20% 14%
0%
2001 2002 2003 2004 2005 2006 2007 2008 2009 2010 2011 2012 2013 2014 2015 2016 2017 2018 2019
Source: Various uranium mining company annual
reports and 3r-party Reports
Confidential - Not for distribution
31 Past performance is not indicative of future resultsWhile Global Uranium Deliveries Are Declining Precipitously
Total Utility Deliveries
120,000
100,000
80,000
Million lbs. U308
60,000
40,000
20,000
0
2020 2021 2022 2023 2024 2025 2026 2027 2028 2029 2030
Source: Various uranium mining company reports. 3rd. party research SCP
estimates
Confidential - Not for distribution
32 Past performance is not indicative of future resultsUtility Security of Supply is Low, We Think History At Least Rhymes
Source: 3rd party research
Confidential - Not for distribution
33 Past performance is not indicative of future resultsAnd Inventories Won’t Bail Them Out
Utilities can pay producers more now or pay them more later ~2.3 years inventory at normal levels and leave no
– but one way or another, they’re going to pay them more. wiggle room for inventory drawdowns to fill supply
Given security of supply is paramount to utilities and deficit gap.
inventory levels not providing a cushion, the math suggests
it’s much sooner than later.
Price is Everything Global Utility U308 Inventory
350 $100 Well Within Normal
$91
300 $83 $80
250
$66 $67 2021 Annual Requirments
200 $61 $60 $60
$54
150 $47 $46
$39 $40 SCP Estimate Global Utility
100 $31 $31 $32
Inventory
$20
50
0 100 200 300 400 500
0 $0
2007 2008 2009 2010 2011 2012 2013 2014 2015 2016 2017 2018 2019 Million lbs. U308
Total U.S. Commercial Inventories LT Volumes Contracted Globally
Global Average L.T Price Paid
Source: 2019 WNA Fuel Report , 2019 EIA marketing Report, SCP Estimates
Confidential - Not for distribution
34 Past performance is not indicative of future resultsYou can also read