Global Banking & Markets - Investor Relations Roadshow June 2021 - HSBC Group
←
→
Page content transcription
If your browser does not render page correctly, please read the page content below

Global Banking & Markets
Investor Relations Roadshow

June 2021
GBM overview   Strategy update       Appendix

Agenda

         1   Global Banking & Markets overview                                    3

         2   Strategy update                                                      7

         3   Appendix                                                        12

                                                                                                 2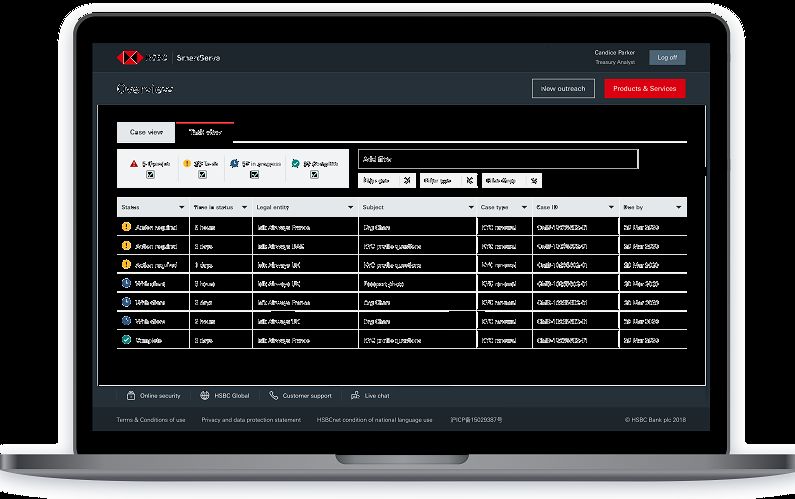
Global Banking & Markets overview

                                    3
GBM overview    Strategy update   Appendix

Our ambition is to be the leading international bank in Asia and the Middle East,
supported by a global network that promotes trade and capital flows
GBM strategic priorities                                                                           Performance ambition
1.    Grow Transaction banking revenues in key corridors capitalising on our broad product
      strength
                                                                                                                Corporate & Investment Bank
                                                                                                      #1
2.    Become a top 5 Global Financing house and significantly grow our event revenues in                        (CIB) in Asia2
      targeted markets with GBM and CMB clients1
3.    Provide financing and investment solutions to underpin the growth of the Group’s wealth
      business
4.    Maintain our leadership in ESG, helping issuer and investor clients manage the transition      Top 3      Global transaction bank3
      to a low carbon economy
5.    Deepen business with institutional clients by enhancing distribution capabilities and
      facilitating capital flows between East and West

                                                                                                                Global CIB for low carbon-
Key enablers                                                                                          #1
                                                                                                                transition & sustainable economy
a.    Reposition capital and cost base to focus resources on delivering our strategic priorities
b. Invest in technology to improve client experience, efficiency and scalability whilst
      reducing operational risk                                                                                 Attractive returns fully
c.    Do the right thing – maintain high conduct standards, invest in talent and uplift culture                 consistent with Group targets
1.   Based on Dealogic revenue rankings
                                                                                                                over the medium term               4
2.   The leading international Corporate & Investment Bank in Asia
3.   Transaction Banking defined as GLCM, GTRF, Securities Services & FX
GBM overview Strategy update Appendix
Our global network is the key to extracting value from our market leading platforms
A strategy built on our global network1 West-East connectivity is a key differentiator
# Countries Banked 1-2 3-7 8+
Higher
GBM clients2 ~50% The West providing access to talent,
FY20 ~75% large institutional clients, deep
liquidity pools and USD clearing
Our franchise is highly ~30%
connected and focused on
international clients ~20%
~20%
~5% Lower
Clients Client RoRWA3 The East supporting Western
revenue supply-chains, working capital and
Eastern revenues originating from
access to local markets
Western clients for selected products
Eastern GBM client
revenue3
FY20 ~65% ~55% ~50%
~40% of Eastern revenues Volumes in the West enable
are inbound from the West, competitiveness and scale to invest
with >2x the returns of intra- in the East
regional business4 Securities GLCM FX
Services
1. All data from FY20; client revenue is based on HSBC internal client management information and differs from reported revenue. Client revenue excludes MSS trading revenue, Principal Investments and non-customer revenue, including allocations from Corporate Centre
2. FY20 client revenue data includes Corporate clients only (excludes Institutional clients)
5
3. FY20 client revenue from transactions booked in the East where client relationships are managed in the West;, “East” defined as Asia and Middle East; West as remaining regions
4. Client returns based on Return over Risk Weighted Assets (RoRWA), measured by client profit before tax over average risk-weighted assets (excluding market risk RWAs)GBM overview Strategy update Appendix
Our role and value to the Group
Supporting the Group Positioned for growth Aligned to strengths Financial stability
Client revenue delivered to Majority of adjusted Transaction Banking Expert risk management
other businesses underpins revenue booked in high franchise delivers stable, and diversified trading
Group profitability growth markets1 recurring revenue2 portfolio (VaR)3
HSBC vs. quarterly peer average VaR
FX East
Transaction Banking & Lending 2020
Wealth & Risk Mgmt West
FI & Equities
Cap Mkts & Advisory 66
IB
Referrals
48
99%
confidence
interval
~$4bn $15.3bn
(+7% YoY) 95%
confidence ~35
interval
HSBC Peers HSBC Peers
2020 20202
1. East defined as Asia & Middle East; West as Europe, & Americas
2. Peers include a mix of 11 US and European banks 6
3. Peers include a mix of 5 US and European banks with confidence intervals between 95% - 99%Strategy update
7GBM overview Strategy update Appendix
Building from our plans announced in February 2020
GBM commitments Delivering against the plan 1Q20 vs. 1Q21
Delivered $54bn of gross RWA reductions to 1Q211
Align resources
to areas of Reduced capital deployed to G10 Rates business, GBM RWAs
growth exiting G10 long-term rates derivatives market- (14)%
from $295bn to $255bn
making
Merged Global Markets and Securities Services
Improve Created single middle and back office to support
Cost-Income-Ratio
efficiency wholesale clients (4)ppt
from 63% to 59%
Demised central structures
Invest in areas
Investing over $1.3bn in platforms, technology and
of competitive
coverage2 Return on Tangible Equity3
strength +5.8ppt
from 6.3% to 12.1%
1. Since 3Q19, which included accelerated saves in 4Q19
2. $1.3bn refers to 2021cash CTB in 2021 8
3. Excluding Significant Items & Bank LevyGBM overview Strategy update Appendix
Leveraging our strengths to deliver growth
A universal banking proposition Positioning for growth
Asset light, fee-driven business model, proactively
Supporting the Group’s clients with product expertise
distributing risk for clients across the Group
GBM Corporate
clients Extending Transaction Banking
Enabling positions of Fixed Income
financing leadership ESG
GBM Institutional solutions,
CMB clients
clients structuring &
distributing
risk
WPB clients Investment banking
Ambition for Products for wealth clients
growth Risk management and distribution
capabilities
Capital markets and advisory; payments and cash management;
FX and financing solutions; wealth and risk management products
9GBM overview Strategy update Appendix
Investment in technology enables better client service, growth and efficiency
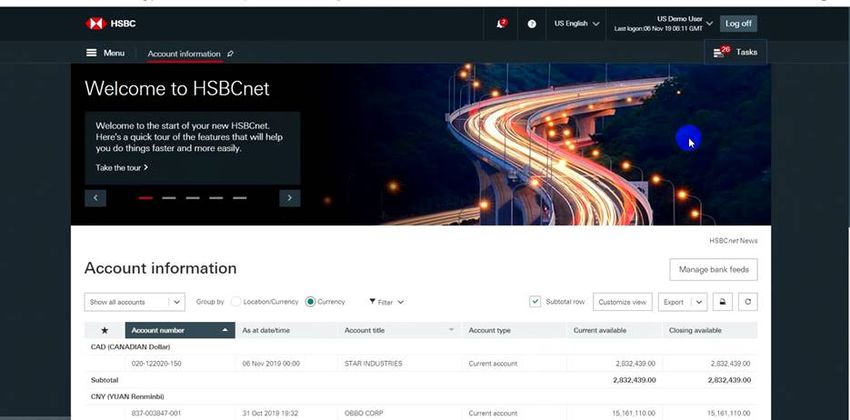
Digitising the client experience Delivering digital services
HSBCnet and Connect HSBC SmartServe
Secure, resilient and future-proof digital platforms and capabilities A secure, digitised customer User Interface for Wholesale clients to
allowing customers to transfer large quantities of payments request entity onboarding and access to products and services
Award winning mobile app gives quick and convenient 24/7 access Dynamic questionnaires replace paper forms to provide a simple journey
with best-in-class biometrics which includes eSign, document exchange and Virtual Assistant
Integrations to regional corporate registries and data providers to
minimise client effort when onboarding
>154k >20k
Customers
Client Interactions
$16.8tn >1.4k
Annual Payments Internal users
720m payments processed
YTD April 21 (+36% on same
3.3k period last year)
19
Transactions per
Countries live
minute 10GBM overview Strategy update Appendix
GBM’s ambition in 2025 is to deliver improved returns, with a simplified structure
and a material shift of resources to Asia
GBM in 2025 Return Levers
Serving clients with an aspiration into and/or within Asia and the Middle
East, and a strong global institutional client base RWA reduction and accelerated shift to
Asia
Focused on areas of strength in transaction banking, financing and ESG;
well connected with Group priorities
Simplified operating model delivering growth in the East, supported by Revenues driven by non-interest income
expertise, talent and client relationships from the West and Transaction Banking products
Asset light, fee-driven business model, proactively distributing risk for clients
across the Group
Cost reduction enabled by investments
A capital efficient, profitable business, aligned to areas of growth and in technology and, wholesale support
competitive strengths seeking to deliver attractive returns in the medium model
term
11Appendix
12GBM overview Strategy update Appendix
Global Banking & Markets financial highlights
Adjusted Financial Performance FY19-FY20 Adjusted Financial Performance 1Q20-1Q21
$m FY20 FY19 Δ RWAs $bn Revenue $bn
Markets and Securities Services 8,797 7,795 13%
(14)% +10%
Banking 6,599 7,399 (11)%
Other1 (93) (325) 63%
Revenue 15,303 14,869 3%
ECL (1,209) (153) >(200)% 295 3.9 4.3
255
Costs (9,264) (9,544) (3)%
Share of profits in associates and JVs – – –
Adjusted PBT 4,830 5,172 (7)% 1Q20 1Q21 1Q20 1Q21
Significant items and FX translation (1,214) (4,230) (72%)
Costs $bn ECL charge / (release) $m
Reported PBT 3,616 942 >200%
+3%
$bn FY20 FY19 Δ
Customer loans 224 252 (11)%
560
Customer deposits 337 304 11% 2.5 2.5
RWAs 265 277 (4)%
RoTE, %2 6.7% 9.8% (3.1)ppts (190)
1Q20 1Q21 1Q20 1Q21
1. Other includes PI and Markets treasury allocations
2. Excluding Significant Items & Bank Levy 13GBM overview Strategy update Appendix
Global Banking & Markets returns
GBM RoTE Evolution1
%
12.1%
10.5%
9.8%
6.7%
6.3%
2018 2019 2020 1Q20 1Q21
1. Excluding Significant Items & Bank Levy
14Disclaimer
Important notice
The information, statements and opinions set out in this presentation and accompanying discussion (“this Presentation”) are for informational and reference purposes only and do not constitute a public offer for the purposes of any applicable law or
an offer to sell or solicitation of any offer to purchase any securities or other financial instruments or any advice or recommendation in respect of such securities or other financial instruments.
This Presentation, which does not purport to be comprehensive nor render any form of legal, tax, investment, accounting, financial or other advice, has been provided by HSBC Holdings plc (together with its consolidated subsidiaries, the “Group”)
and has not been independently verified by any person. You should consult your own advisers as to legal, tax investment, accounting, financial or other related matters concerning any investment in any securities. No responsibility, liability or
obligation (whether in tort, contract or otherwise) is accepted by the Group or any member of the Group or any of their affiliates or any of its or their officers, employees, agents or advisers (each an “Identified Person”) as to or in relation to this
Presentation (including the accuracy, completeness or sufficiency thereof) or any other written or oral information made available or any errors contained therein or omissions therefrom, and any such liability is expressly disclaimed.
No representations or warranties, express or implied, are given by any Identified Person as to, and no reliance should be placed on, the accuracy or completeness of any information contained in this Presentation, any other written or oral information
provided in connection therewith or any data which such information generates. No Identified Person undertakes, or is under any obligation, to provide the recipient with access to any additional information, to update, revise or supplement this
Presentation or any additional information or to remedy any inaccuracies in or omissions from this Presentation. Past performance is not necessarily indicative of future results. Differences between past performance and actual results may be
material and adverse.
Forward-looking statements
This Presentation may contain projections, estimates, forecasts, targets, commitments, opinions, prospects, results, returns and forward-looking statements with respect to the financial condition, results of operations, capital position, strategy and
business of the Group which can be identified by the use of forward-looking terminology such as “may”, “will”, “should”, “expect”, “anticipate”, “project”, “plan”, “estimate”, “seek”, “intend”, “target” or “believe” or the negatives thereof or other
variations thereon or comparable terminology (together, “forward-looking statements”), including the strategic priorities, any financial, investment and capital targets and ESG targets/commitments described herein. Any such forward-looking
statements are not a reliable indicator of future performance, as they may involve significant stated or implied assumptions and subjective judgements which may or may not prove to be correct. There can be no assurance that any of the matters set
out in forward-looking statements are attainable, will actually occur or will be realised or are complete or accurate. The assumptions and judgments may prove to be incorrect and involve known and unknown risks, uncertainties, contingencies and
other important factors, many of which are outside the control of the Group. Actual achievements, results, performance or other future events or conditions may differ materially from those stated, implied and/or reflected in any forward-looking
statements due to a variety of risks, uncertainties and other factors (including without limitation those which are referable to general market conditions, regulatory changes or due to the impact of the Covid-19 outbreak). Any such forward-looking
statements are based on the beliefs, expectations and opinions of the Group at the date the statements are made, and the Group does not assume, and hereby disclaims, any obligation or duty to update, revise or supplement them if circumstances
or management’s beliefs, expectations or opinions should change. For these reasons, recipients should not place reliance on, and are cautioned about relying on, any forward-looking statements. No representations or warranties, expressed or
implied, are given by or on behalf of the Group as to the achievement or reasonableness of any projections, estimates, forecasts, targets, commitments, prospects or returns contained herein.
Additional detailed information concerning important factors that could cause actual results to differ materially from this Presentation is available in our Annual Report and Accounts for the fiscal year ended 31 December 2020 filed with the Securities
and Exchange Commission (the “SEC”) on Form 20-F on 24 February 2021 (the “2020 Form 20-F”) and our 1Q 2021 Earnings Release which was furnished to the SEC on Form 6-K on 27 April 2021 (the “1Q 2021 Earnings Release”).
Alternative Performance Measures
This Presentation contains non-IFRS measures used by management internally that constitute alternative performance measures under European Securities and Markets Authority guidance and non-GAAP financial measures defined in and presented
in accordance with SEC rules and regulations (“Alternative Performance Measures”). The primary Alternative Performance Measures we use are presented on an “adjusted performance” basis which is computed by adjusting reported results for the
period-on-period effects of foreign currency translation differences and significant items which distort period-on-period comparisons. Significant items are those items which management and investors would ordinarily identify and consider
separately when assessing performance in order to better understand the underlying trends in the business.
Reconciliations between Alternative Performance Measures and the most directly comparable measures under IFRS are provided in our 2020 Form 20-F and our 1Q 2021 Earnings Release each of which are available at www.hsbc.com.
Information in this Presentation was prepared as at 21 June 2021.
15Opening up a world of opportunity
You can also read