Deterra Royalties Macquarie Australia Conference Presentation - Julian Andrews Managing Director and Chief Executive Officer - Deterra ...
←
→
Page content transcription
If your browser does not render page correctly, please read the page content below

Deterra Royalties
Macquarie Australia
Conference Presentation
Julian Andrews
Managing Director and Chief Executive Officer

5 May 2021
Important notices and disclaimer
This presentation has been prepared by Deterra Royalties Limited (“Deterra”, “DRL”, “the Company”). By accessing this presentation you acknowledge that you have read and understood the following statement.
The material in this presentation is general background information about Deterra and its activities current as at the date of this presentation. This presentation provides an indicative outlook for the Deterra business and the 2021
financial year. The information in this presentation is given in summary form and does not purport to be complete. Information in this presentation is provided to assist sophisticated investors with their own analysis of the
Company but should not be relied upon as a predictor of future performance. The current outlook parameters supersede all previous key physical and financial parameters. The information in this presentation is not intended to be
relied upon as advice to investors or potential investors and does not take into account the investment objectives, financial situation or needs of any particular investors. Investors should consider these factors and consult with
their financial, legal or other professional adviser.
This information is based on Deterra forecasts and as such is subject to variation related to, but not restricted to, economic, market demand/supply and competitive factors. This presentation should be read in conjunction with
Deterra's other periodic and continuous disclosure announcements which are available at www.asx.com.au.
Forward-looking Statements
This presentation contains certain statements which constitute “forward-looking statements”. Often, but not always, forward-looking statements can generally be identified by the use of forward-looking words such as “may”,
“will”, “expect”, “plan”, “believes”, “estimate”, “anticipate”, “outlook” and “guidance”, or similar expressions, and may include, without limitation, statements regarding plans; strategies and objectives of management; anticipated
performance; estimates of future expenditure; expected costs; estimates of future royalty income, product supply, demand and consumption; statements regarding future product prices; and statements regarding the expectation
of future Mineral Resources and Ore Reserves.
Where Deterra expresses or implies an expectation or belief as to future events or results, such expectation or belief is expressed in good faith and on a reasonable basis. No representation or warranty, express or implied, is made
by Deterra that the matters stated in this presentation will in fact be achieved or prove to be correct.
Forward-looking statements are only predictions and are subject to known and unknown risks, uncertainties, assumption and other important factors that could cause the actual results, performances or achievements of Deterra or
the underlying royalty assets to differ materially from future results, performances or achievements expressed, projected or implied by such forward-looking statements. Readers are cautioned not to place undue reliance on these
forward-looking statements, which speak only as of the date thereof. Such risks and factors include, but are not limited to: the risks and uncertainties associated with the ongoing impacts of COVID-19, the Australian and global
economic environment and capital market conditions; changes in exchange rate assumptions; changes in product pricing assumptions; major changes in mine plans and/or resources; changes in equipment life or capability;
emergence of previously underestimated technical challenges; increased costs and demand for production inputs; and environmental or social factors which may affect a licence to operate, including political risk.
To the extent permitted by law, Deterra, its officers, employees and advisors expressly disclaim any responsibility for the accuracy or completeness of the material contained in this presentation and exclude all liability whatsoever
(including in negligence) for any loss or damage which may be suffered by a person as a consequence of any information in this presentation or any error or omission therefrom. Deterra does not undertake to release publicly any
revisions to any forward-looking statement to reflect events or circumstances after the date of this presentation, or to reflect the occurrence of unanticipated events, except as may be required under applicable securities laws.
No independent third party has reviewed the reasonableness of the forward-looking statements or any underlying assumptions.
Past performance
Investors should note that past performance metrics and figures in this presentation are given for illustrative purposes only and cannot be relied upon as an indicator of (and provide no guidance as to) future Deterra performance,
including future share price performance. Any such historical information is not represented as being, and is not, indicative of Deterra's views on its future financial condition and/or performance.
Non-IFRS Financial Information
This document may contain non-IFRS financial measures including cash production costs, non-production costs, Royalty EBITDA, Underlying Group EBITDA, EBIT, free cash flow, and net debt amongst others. Deterra management
considers these to be key financial performance indicators of the business and they are defined in the pre-quotation disclosure (22 October 2020). Non-IFRS measures have not been subject to audit or review.
To assist shareholders in their understanding of Deterra, pro forma financial information has been prepared to reflect the business as it is now structured and as though it was in effect from 1 January 2019.
All figures are expressed in Australian dollars unless stated otherwise.
In accordance with ASX Listing Rule 15.5, Deterra confirms that this presentation has been authorised for release to ASX by Deterra's Managing Director.

2
Business highlights

                                                                             • Board and management team now fully in place
            Successful demerger &
                                                                             • Implemented lean corporate structure with outsourced functional support
                          ASX listing                                        • Modest working capital facility in place

                                                                             • Royalty receipts of $90.3 million in the nine months to March 2021
           Lean business model
                                                                             • H1 FY21 NPAT of $33.3 million and Underlying EBITDA margin of 97%1
         delivering strong financial
                                                                             • Declared an Interim Dividend of 2.45 cents per share (fully franked) equal to 100% of
               performance                                                     Post-demerger Period NPAT

                                                                             • MAC South Flank 95 per cent complete with commissioning activity expected to
               Developing revenue                                              commence in the June 2021 quarter
                                                                             • Management team focused on identification and evaluation of new royalty
                     growth options                                            opportunities

    (1) Refers to interim period results for period 15 June to 31 December 2020.
3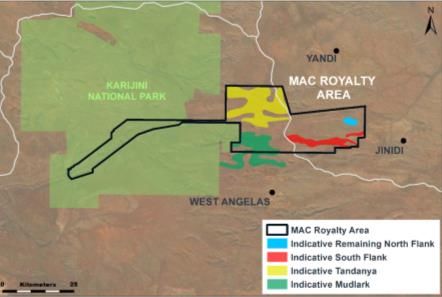
Business
update
Mining Area C royalty performance
The MAC Royalty continues to perform well in the robust iron ore price environment

                                 Key Points                                                                   MAC quarterly revenue royalty payment and sales volume1
                                                                                                                                     AUD million, Million dry metric tonnes
                                                                                                                                   Capacity payment                               Sales (Mdmt)
    • Iron ore price tailwinds have continued
                                                                                                                                    15.6
      since demerger                                                                                                                                                                             13.8
                                                                                                              13.0                                         12.5                  12.8

    • South Flank now 95% complete and
      commissioning activity on track to                                                                                     1.0
      commence in the June 2021 quarter
                                                                                                                                                                                                 36.3
                                                                                                                                    25.6                   24.1                  24.4
    • Capacity payment threshold remains at                                                                   21.3

      57Mdmt, set in FY20
                                                                                                              Mar                    Jun                   Sep                  Dec              Mar
                                                                                                              2020                  2020                  2020                  2020             2021

                                                                                                                                                                                                        South Flank project
                                                                                                               66%                  76%                    84%                   90%             95%
                                                                                                                                                                                                           completion

       (1) MAC sales volumes are reported on a dry basis and will vary from BHP reported production due to product moisture factors and the timing of sales and inventory
           movements in any reporting period. Iron ore sales typically reflect average index prices for the month of shipping, with adjustments for ore quality. Deterra’s royalty receipts
           are based on sales invoiced during the period which may reflect, in part, provisional pricing. Accordingly, quarterly revenues can be impacted by the timing of adjustments to
5          align achieved pricing to provisional pricing from the prior quarter.
           The threshold production for future capacity payments is now 57 Mdmt.
Strategy
Royalty and streaming company landscape
Deterra holds a leading position in the non-gold royalty and streaming sub-sector

                       Major Royalty and Streaming Companies                                              Non-Gold Royalty and Streaming Companies
                                     Total ~US$60bn Market Cap                                                      Sub-sector ~US$5bn Market Cap

                       Wheaton Precious Metals
                                                          Royal Gold
                                                                      Osisko Gold                        Deterra Royalties                    Altius Minerals
                                                                          Sandstorm
                                                                                                                                                       Anglo Pacific Group
                                                                           Other Gold

                                                                                                                          33%                              Mesabi Trust
                                                                    9%         Other
                                                                                                                                                           Other Non Gold

                                                                   Franco-Nevada                                           Labrador Iron Ore Royalty Corp

      Source:   Capital IQ. Average market capitalisation for the peer group during March 2021. Includes; TSX:FNV, NYSE:WPM, NasdaqGS:RGLD, TSX:OR, TSX:SSL, TSX:MMX, TSX:NSR,
                TSXV:MTA, TSXV:EMX, TSXV:RZZ, TSXV:ELY, TSXV:VOX, TSXV:ELE, TSXV:FISH, TSXV:OGN, TSX:LIF, ASX:DRR, TSX:ALS, LSE:APF, NYSE:MSB, TSXV:URC, AIM:TRR

7
Mining Area C operation and South Flank expansion (MAC royalty)
Low-risk exposure to a large, low-cost iron ore mining complex that will grow its volumes by approximately 2.4 times
Low-cost operations with long life Significant near-term growth Resource upside in a low-risk
jurisdiction
Iron ore total cash cost curve (2023F)1 Mining Area C production and Mining Area C (MAC)
Mining
sales volumes royalty area Area C
(Calendar years, Mwmt)2
1st 2nd 3rd 4th
quartile quartile quartile quartile
2.4x
145.0
58.0 58.4
46.5
21.8
2005
2010
2015
2020
Forecast
North Flank South Flank RoW
(1) As presented in the Demerger Booklet (Deterra Royalties Limited), published by Iluka Resources on 10 September 2020. Total cash costs are defined as direct cash cost
associated with mining, processing and transport of marketable products, including G&A costs directly related to mine production, royalties, levies and other indirect taxes.
(2) BHP reported MAC production volumes on a wet basis.
8Capital management and strategy
Low debt and scaleable corporate structure Build a portfolio of royalties focusing on
designed to support the flow of dividends to earnings growth and diversification through
shareholders value accretive investments
Capital management and dividend policy: Key objective of this strategy is to achieve:
• Intent to pay out 100% of NPAT1, franked to the • Multiple sources of earnings growth – new royalties with
maximum extent possible attractive returns, exposure to mine life extensions and
production increases
• Conservative capital structure limits interest costs
• Greater cash flow resilience and lower risk – through portfolio
• Lean corporate structure and cost base diversification over time
• Earnings sensitive to iron ore prices, sales volumes, • Scaleable cost structure – limited incremental operating cost
foreign exchange rates and one-off expenses required for new investments
• Disciplined approach – to investment and capital allocation
Building a track record of delivering shareholder value
(1) Deterra’s approach to dividends and dividend policy will be determined by the Deterra Board at its discretion and may change over time.
9Targeted growth strategy focused on value accretive investment
Deterra’s screening process and investment criteria prioritise opportunities where it has a competitive advantage
Primary Royalties
Creating new royalties for: How we prioritise opportunities
• Project capital Investment criteria
• Balance sheet repair Size Commodity Geography Stage
• M&A finance support ESG Value
Developed mining
Core target
jurisdictions, incl:
A$100 – A$300M • Bulks
• Australia • Production Ability to generate
• Base metals
Secondary Royalties but scope to invest • Battery metals
• N. America • Near production ESG risk and return in excess of
• S. America opportunity asset-specific
Acquire existing royalties to: above or below
• Europe cost of capital
• Improve liquidity
• Daylight value Other opportunities considered on merit on a case by case basis
• Diversify risk
10Six key drivers of success
Maximise value from portfolio Execute disciplined growth
Robust cashflows with strong embedded growth in Increase scale and diversification through
1 MAC
4 complementary acquisitions
2 Low cost, scaleable corporate structure 5 Disciplined capital allocation
3 Maximise franked dividends (100% NPAT) 1 6 Strong balance sheet and significant debt capacity
Maximise shareholder value
(1) Deterra’s approach to dividends and dividend policy will be determined by the Deterra Board at its discretion and may change over time.
11For more information Investor and Media enquiries Rob Ward Corporate Development and Investor Relations Mobile: + 61 (0) 431 596 831 Email: robert.ward@deterraroyalties.com Brendan Ryan Chief Financial Officer Email: investor.relations@deterraroyalties.com Deterra Royalties Limited ACN 641 743 348 Level 5, 216 St Georges Terrace Perth WA 6000 Telephone: +61 (0)8 6277 8880 www.deterraroyalties.com
Portfolio of royalties

     Project                           Counterparty                          Location              Commodity       Status        Royalty Key Terms
                                       BHP Billiton Minerals Pty Ltd;                                                            1.232% of MAC product
                                       Itochu Minerals & Energy of                                                               revenue
     Mining Area C (MAC)                                                     Pilbara, WA           Iron Ore        Producing
                                       Australia Pty Ltd;                                                                        $1 million per 1mdmt
                                       Mitsui Iron Ore Corporation Pty Ltd                                                       increase in capacity

     Yoongarillup / Yalyalup Project                                                                                             2% of revenue from sales
                                       Doral Mineral Sands Pty Ltd           South West, WA        Mineral sands   Producing
     (under two royalty agreements)                                                                                              of Minerals

                                                                                                                                 1.5% of gross revenue
     Eneabba Project                   Sheffield Resources Limited           Mid West, WA          Mineral sands   Exploration
                                                                                                                                 from sales of Minerals

                                                                                                                                 $0.70 per tonne of
     Wonnerup Project                  Cable Sands (W.A.) Pty Ltd            South West, WA        Mineral sands   Development
                                                                                                                                 Valuable Heavy Mineral

                                       St Ives Gold Mining Company Pty       Eastern Goldfields,                   No known      3% of gross revenue
     St Ives Gold Project                                                                          Minerals
                                       Ltd                                   WA                                    activity      (subject to conditions)

13
You can also read