TSX-V : GTT OTC : GTGDF - JULY 2020 INVESTOR PRESENTATION - GT Gold Corp.
←
→
Page content transcription
If your browser does not render page correctly, please read the page content below
I N V E STO R P R E S E N TAT I O N
                    TSX-V : GTT
    JULY 2020                         Saddle North Project, Tatogga Property
                    OTC : GTGDF
                                      Golden Triangle, BC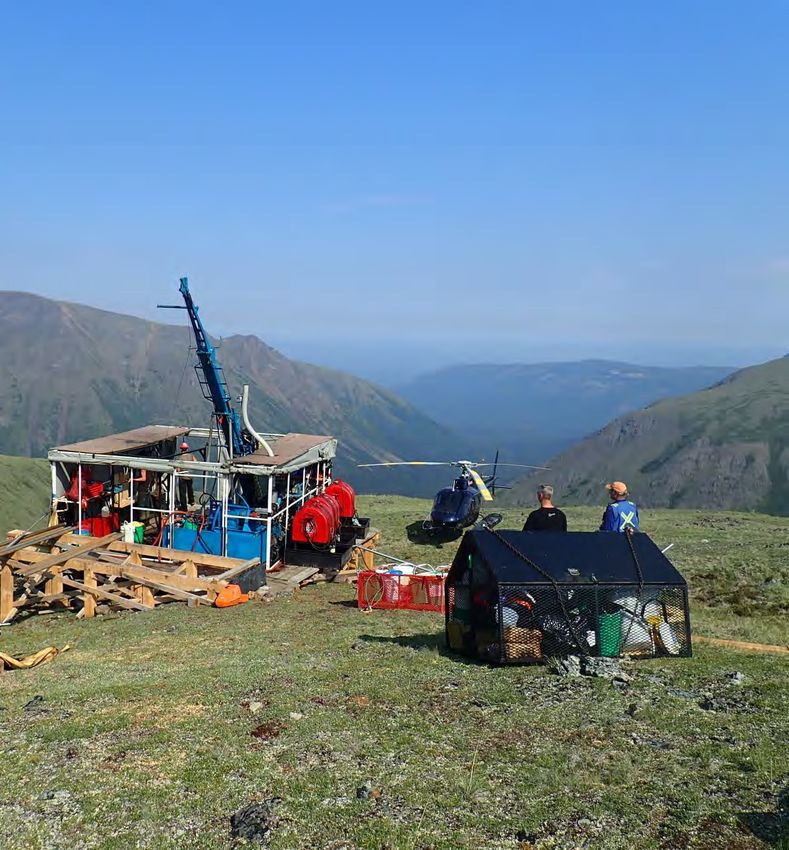
Cautionary Statement Regarding Forward Looking Information
Certain statements included in this presentation constitute forward-looking statements, including those identified by the words “proposed”, “will”, anticipate”, “believe”, “plan”, “estimate”,
“expect”, “intend”, “may”, “should” and similar words and expressions to the extent they relate to GT Gold Corp. (the “Company”) or its management.

The forward-looking statements are not historical facts and are based on current expectations and various estimates, factors and assumptions, and therefore involve known and unknown risks,
uncertainties and other factors.

Any forward-looking statements represent the Company’s estimates only as of the date of this presentation and should not be relied upon as representing the Company’s estimates as of any
subsequent date. The material factors and assumptions that were applied in making the forward-looking statements in this presentation include:

•   execution of the Company’s existing plans or exploration programs for its properties, which may change due to changes in the views of the Company, or if new information arises which
    makes it prudent to change such plans or programs; and

•   the accuracy of current interpretations of geochemical, geophysical, drilling and other exploration results, since new information or new interpretations of existing information may result in
    changes in the Company’s expectations. Readers should not place undue reliance on the Company’s forward-looking statements, as the Company’s actual results, performance or
    achievements may differ materially from any future results, performance or achievements expressed or implied by such forward-looking statements if known or unknown risks, uncertainties
    or other factors affect the Company’s business, or if the Company’s estimates or assumptions prove inaccurate. Therefore, the Company cannot provide any assurance that such forward-
    looking statements will materialize. The Company disclaims any intention or obligation to update or revise any forward-looking statements, whether as a result of new information, future
    events or otherwise.

QA/QC PROCEDURES
GT Gold has implemented a rigorous quality assurance / quality control (QA/QC) program to ensure best practices in sampling and analysis of RC chips and diamond drill core, the complete
details of which can be viewed on the Company’s website at http://www.gtgoldcorp.ca/projects/tatogga/

For full details on both Saddle North and Saddle South reverse circulation and diamond drill program assay results widths reported in this presentation, please refer to the corresponding press
release available on the Company website at www.gtgoldcorp.ca/news/. All assays are performed by ALS Canada Ltd. (Minerals), with sample preparation carried out at the ALS facility in
Terrace, BC, and assays at the North Vancouver laboratory. Assay values are uncut. For gold, fire assays are performed as per ALS protocol Au-AA26 (0.01-100.00 g/t Au) using 50 grams of
sample with assays equal to or greater than 5 g/t Au calculated gravimetrically, and lower-grade samples measured by (AA) atomic absorption. All samples that return equal to or greater than 5
g/t Au from initial fire assaying are additionally sent for screen metallic analysis using the remainder of the pulp (~950 grams of sample). This step is taken to ensure that any coarse grained,
nugget gold fraction that may have been missed in the fire assays has been captured.

GT Gold Corp.’s Qualified Person as defined by National Instrument 43-101 is Michael Skead, FAusIMM, VP Project Development. Mr. Skead has reviewed and approved the technical
information in this presentation.

                                                                                               TSXV: GTT                                                                                              2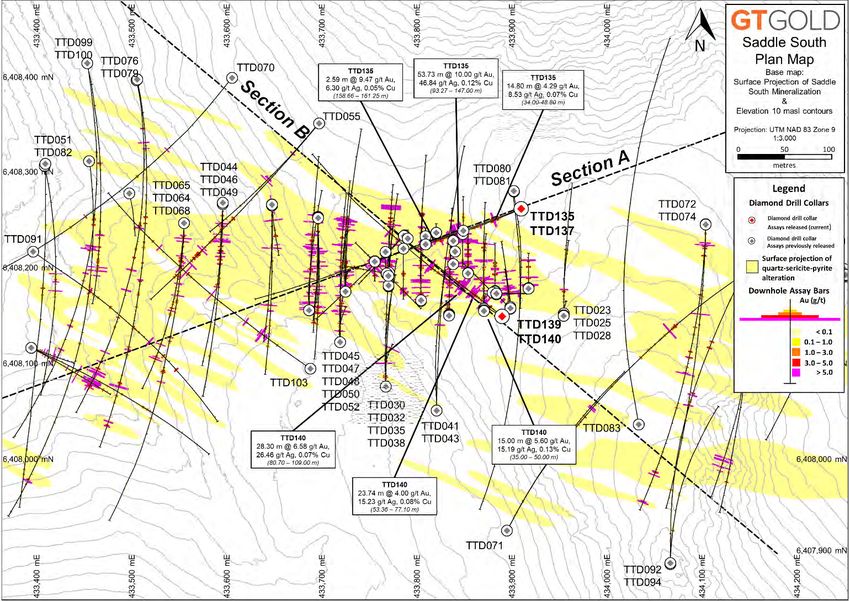
Attractive New Copper & Gold Investment Opportunity

1.81 Blb Cu | 3.47 Moz Au
                                       Maiden Mineral Resource for Saddle North Project
  INDICATED RESOURCE
                                          •   Multi-billion pound copper and multi-million ounce gold resource
2.98 Blb Cu | 5.46 Moz Au                 •   Located in Tier-1 Canadian jurisdiction with infrastructure
  INFERRED RESOURCE                       •   Prospective property with regional exploration upside potential

                                       Strong Leadership Team
      LEADERSHIP                          •   Highly experienced management and board with proven track record
  & GROWTH STRATEGY
                                          •   Clear, dual-focused growth strategy to create long-term value

                                       Solid Financial Position
     $14.4M CASH*
                                          •   Sufficient funds to support 2020 exploration season and work to complete
        NO DEBT
                                              Saddle North PEA

                                       Shareholder Confidence
 INSIDER & CORPORATE
                                          •   11.9% ownership by Directors and Management
       OWNERSHIP
                                          •   14.9% ownership by Newmont Corporation
               *as at March 31, 2020

                                                           TSXV: GTT                                                 3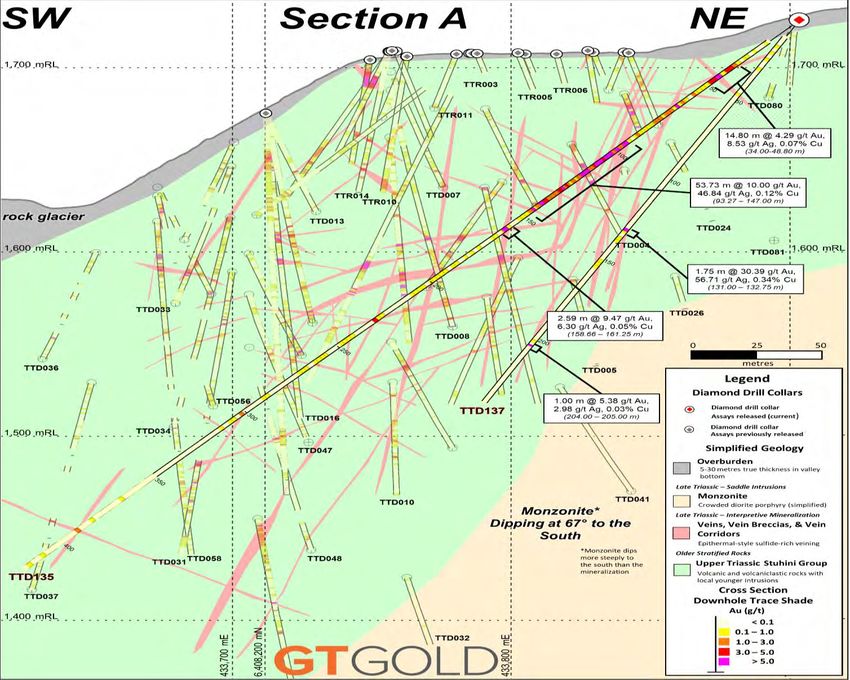
TATOGGA PROPERTY
Tier 1 Mining Jurisdiction with Access and Infrastructure
SADDLE
DISCOVERIES
TATOGGA PROPERTY
Iskut
• Existing
Infrastructure
Community
• Easily
Accessible
• Within Tahltan
Traditional Territory
• Within Prolific
Highway 37
Golden Triangle
in BC, Canada 287 kV Power Line
N
7/28/2020
TSXV: GTT 4
Attractive New Investment Opportunity
                            with District Upside Potential in Canada

       2020 Clear Dual-focused Strategy to Create Long-term Value

1. ADVANCE SADDLE NORTH TO PEA                                2. DEVELOP NEW TARGETS ON PROPERTY
Saddle North large-scale gold-copper porphyry                 • Quash Pass target
deposit with optionality and expansion upside                   5-6 km long strong coincident soil and geophysical
                                                                anomaly located less than 8 km from Saddle area
✓ Geological model completed in Q1
                                                              • Saddle area
✓ Initial mineral resource estimate completed in Q2             highly prospective untested targets adjacent to Saddle
• Continue ongoing engineering work and studies to              discoveries
  deliver the Preliminary Economic Assessment (PEA)           • Additional targets
  in Q4 2020                                                    identified on prospective 468 km2 property

                                                      TSXV: GTT                                                      5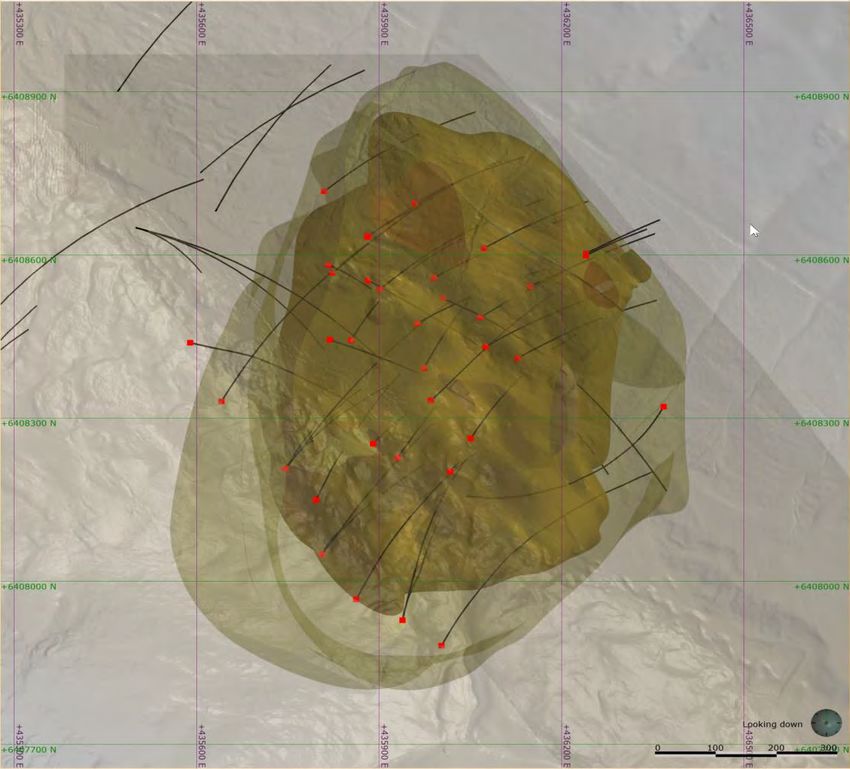
Saddle North
     Mineral
   Resource
    Estimate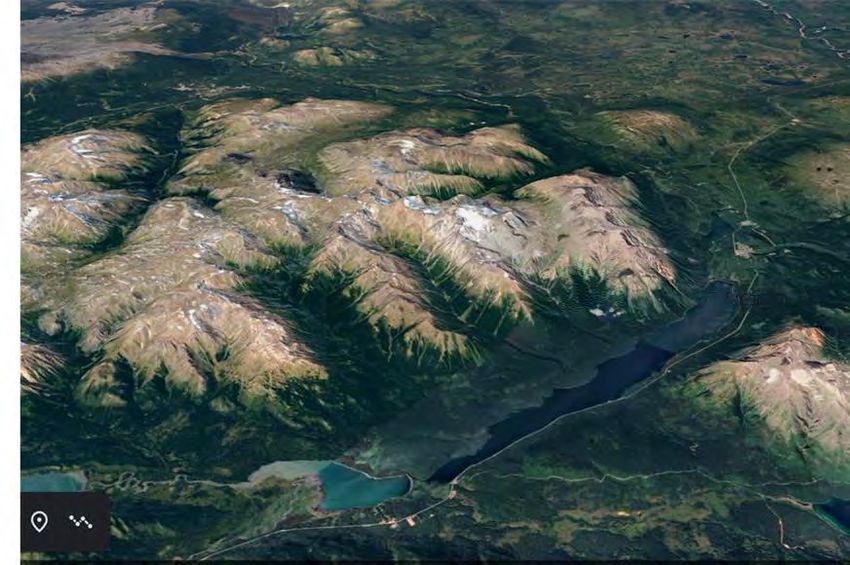
SADDLE NORTH MINERAL RESOURCE
Quality Control from Geological Model to Mineral Resource Estimate
  Lithology Model*                    Alteration Model*
                                                                                                                    Saddle North Combined Mineral Resource
                                                                                                                           Open Pit and Underground*

                                                                                Shapes
                                                                                from the
                                                                                geological
                                                                                model were
                                                                                imported
                                                                                and used
                                                                                as estimation
                                                                                domains to
                                                                                create the
                                                                                Mineral
                                                                                Resource
                                                                                Block Model

                                                                                                                                                                                  0m   250m      500m 750m

*See press releases dated April 28, 2020 and July 6, 2020 for details on Saddle North alteration and lithology models and Quality Control processes in creating the Mineral Resource estimate.

                                                                                              TSXV: GTT                                                                                          7
SADDLE NORTH MINERAL RESOURCE Saddle North Combined Mineral Resource
2020 Maiden Mineral Resource Open Pit and Underground*
Summary
Indicated Resource
298 Mt @ 0.28% Cu, 0.36 g/t Au and 0.79 g/t Ag
1.81 Blb Cu, 3.47 Moz Au and 7.58 Moz Ag
Inferred Resource
543 Mt @ 0.25% Cu, 0.31 g/t Au and 0.67 g/t Ag
2.98 Blb Cu, 5.46 Moz Au and 11.64 Moz Ag
✓ Open pit as well as underground mining potential
✓ Potential for expansion with mineralization open
down plunge and to the southwest
• Basis for PEA expected by year-end 2020
*See press release dated July 6, 2020 for notes on mineral resources,
Net Smelter Return (“NSR”) and assumptions
TSXV: GTT 8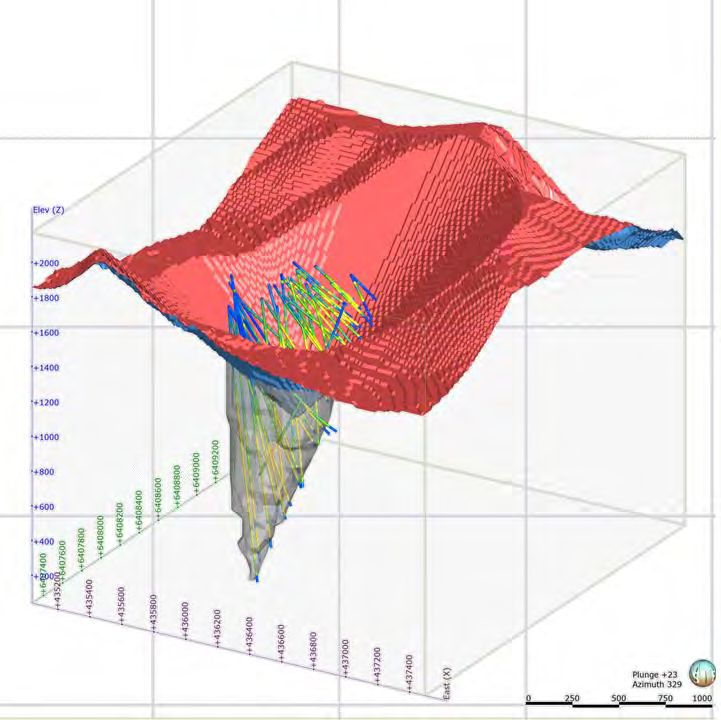
SADDLE NORTH MINERAL RESOURCE
 2020 Mineral Resource Estimates & Assumptions
Saddle North Open Pit Mineral Resource (NSR1 cut-off $9.00/t)                                                                                                     Assumptions
                                                                          Average Grade                                Contained Metal
      Open Pit           Resource            Tonnes               Cu            Au                Ag             Cu         Au          Ag                        •   Metal prices: US$3.25/lb Cu / US$1,500/oz Au / US$18/oz Ag
      Material           Category             (Mt)               (%)           (g/t)             (g/t)          (M lb)     (koz)       (koz)
                         Indicated              21.3             0.15          0.16              0.50                72         108        343                    •   Avg relative density: 2.80 g/cm3
    Transition
                         Inferred               13.0             0.20          0.12              0.62                58          49        261
                         Indicated             195.8             0.26          0.30              0.67             1,105       1,906      4,207                    •   US$/C$ exchange rate: 0.76
        Fresh
                         Inferred              240.5             0.22          0.25              0.53             1,174       1,907      4,091
                         Indicated             217.1             0.25          0.29              0.65             1,177       2,014      4,550                    •   Metal recoveries: 88% for Cu / 67% for Au / 58% for Ag
        Total
                         Inferred              253.5             0.22          0.24              0.53             1,232       1,956      4,352
                                                                                                                                                                  Open Pit
Saddle North Underground Mineral Resource (Bulk shape based on C$16/t NSR)                                                                                        •   Mining costs: C$2.30/t, with additional incremental depth cost
                                                                           Average Grade                               Contained Metal
  Underground            Resource            Tonnes               Cu             Au       Ag                     Cu          Au         Ag                        •   Processing and G&A costs: C$9.00/t
    Material             Category             (Mt)               (%)            (g/t)    (g/t)                  (M lb)     (koz)       (koz)
                         Indicated              80.9             0.35          0.56      1.16                       632       1,457      3,026
                                                                                                                                                                  •   Pit wall angle: - 45º
        Total
                         Inferred              289.3             0.27          0.38      0.78                     1,750       3,499      7,288
                                                                                                                                                                  •   Net Smelter Return (“NSR”) cut-off: C$9.00/t
                                                                                                                                                                  Underground
Saddle North Combined Open Pit and Underground Mineral Resource
                                                                      Average Grade                                    Contained Metal                            •   Underground bulk mining shape based on NSR C$16.00/t
  Open Pit and           Resource            Tonnes               Cu        Au                    Ag             Cu         Au          Ag                        ……………………………………………………………………………………………………………………………………………………………………………………………………………………………………

  Underground            Category             (Mt)               (%)       (g/t)                 (g/t)          (M lb)     (koz)       (koz)
                                                                                                                                                                  •   Payable metal net of smelter costs at 89%
                         Indicated             298.0             0.28      0.36                  0.79             1,809       3,471      7,576
    Combined
                         Inferred              542.8             0.25      0.31                  0.67             2,982       5,455     11,640
                                                                                                                                                                  •   1NSR ($/t) = (Cu% x $73.84 per % Cu) + (Au g/t x $37.84 per
• Differences may occur in totals due to rounding.                                                                                                                    gram Au) + (Ag g/t x $0.39 per gram Ag)
• The effective date for the Mineral Resource is July 6, 2020.
• Mineral Resources, which are not Mineral Reserves, do not have demonstrated economic viability. The estimate of Mineral Resources may be
  materially affected by environmental, permitting, legal, title, taxation, sociopolitical, marketing, changes in global gold markets or other relevant issues.
• CIM definitions were followed for classification of Mineral Resources. The quantity and grade of reported indicated and inferred Mineral Resources in
  this estimation are uncertain in nature. There has been insufficient exploration data to define the inferred Mineral Resources as an indicated Mineral
  Resource and it is uncertain if further exploration will result in upgrading them to an indicated or measured Mineral Resource category.

                                                                                                                            TSXV: GTT                                                                                                    9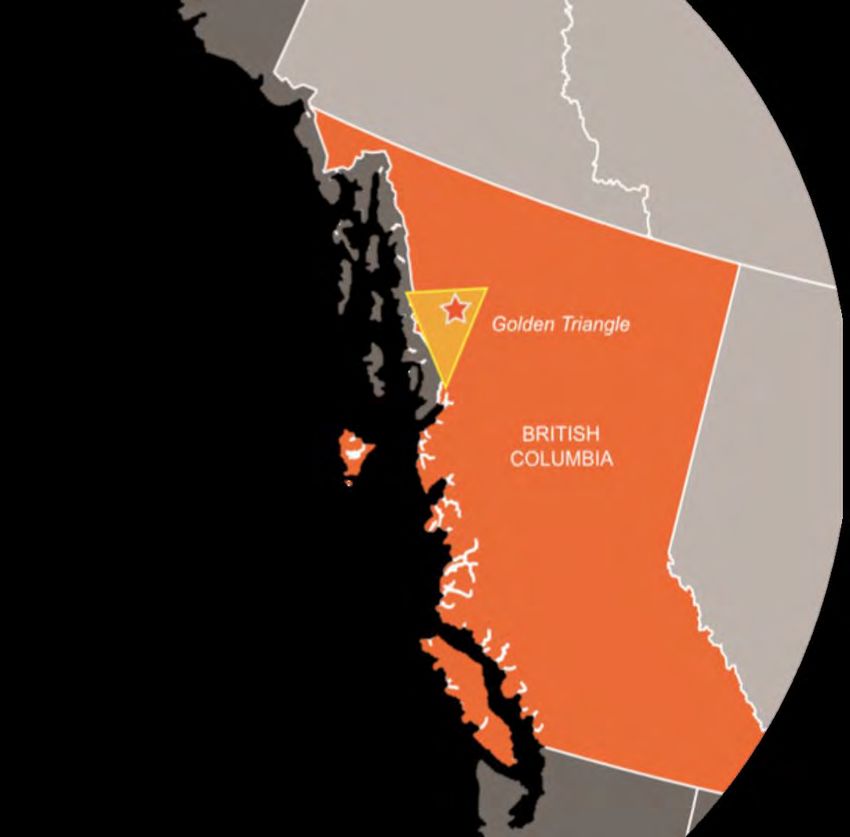
SADDLE NORTH MINERAL RESOURCE
Resource Grade Continuity and Zonation
Continuous grades extending +1.5 km
Tonnes of Resource by NSR value per 100 m Depth Intervals

                 1,700 2 2 5
                 1,600                   19                    27                                44
                                                                                                                                                                         Notes
                 1,500 1 7                               36                                  47                                               64
                 1,400 1         11                            41                                                59                                  41
                                                                                                                                                                         • Net Smelter Return (“NSR”) ($/t) = (Cu% x 2204.62
                                                                                                                                                                           lb/t x Cu Recovery x payable% x Cu Price) + (Au g/t ÷
                 1,300   3           9                        39                                      46                            15
                                                                                                                                                                           31.10348 ounces x Au Recovery x Au Price x
                 1,200       7               12                     38                                     38                 5
                                                                                                                                                                           payable%) + (Ag g/t ÷ 31.10348 ounces x Ag
                 1,100       8                12                        38                        28                  2
                                                                                                                                                                           Recovery x Ag Price x payable%) Payable metal net of
                 1,000           9            9                30                    17      1
 Elevation (m)

                                                                                                                                                                           smelter costs at 89%
                  900            11                14                   30             8 1
                                                                                                                                                                         • NSR ($/t) = (Cu% x $73.84 per % Cu) + (Au g/t x
                  800            12                 18                  20     3
                                                                                                                                                                           $37.84 per gram Au) + (Ag g/t x $0.39 per gram Ag)
                  700            9            12          15        1
                  600        6            12             15
                                                                                                                                                                         • Metallurgical recoveries of 88% for copper, 67% for
                                                                                                                                                                           gold and 58% for silver
                  500 2              12            9
                                                                             over 60              40 - 60                 20 - 40         09 - 20         0 - 09         • Metal prices of USD $3.25/lb of copper, USD
                  400 1 7                5
                  300 1 6 3                                                                                                                                                $1,500/oz of gold and USD $18/oz of silver
                  200    3 3                                                       Mt per NSR category                                                                   • Average density of 2.80 g/cm3
                  100
                         0                          20                  40             60                       80            100           120           140      160
                                                                                     Resource (Mt)

                                                                                                                                         TSXV: GTT                                                                    10
SADDLE NORTH MINERAL RESOURCE
Saddle North Resource Expansion Potential
Mineralization remains open at depth and to northwest and southeast
B B’
Saddle North plan view
B’
N A A’
A’
B
1.15 km
A
850 m
TSXV: GTT 11ADVANCING SADDLE NORTH
Next Steps – towards a PEA in 2020
Q3: File National Instrument 43-101 (“NI 43-101”) Technical Report for Saddle North Mineral Resource
Q3: Results expected from further comminution testing of nine variability samples collected:
• 5 from potential open pit limits (3 from broad envelope of mineralization + 2 from high-grade core)
• 4 from deeper high-grade core of mineralization with underground mining potential
Q4: Anticipated completion of Saddle North Preliminary Economic Assessment by year-end 2020
• Mining – mine design, access & infrastructure, production schedule, optimization, cut-off grade
• Geotechnical / Hydrology – tailings management, site water management, waste rock facility
• Mineral Processing / Metallurgy – basic engineering & design, flowsheets, site layouts
• Environmental / Social - water quality, climate, hydrology, hydrogeology, wildlife & vegetation,
fisheries, ARD/ML, socioeconomics, land use, culture and heritage
• Estimating - capital, sustaining and operating costs
• Economic Analysis - financial model with indicators and sensitivity analysis
• Filing of NI 43-101 Technical Report within regulatory time frame to follow early 2021
TSXV: GTT 12Saddle South
UpsideADVANCING SADDLE AREA
Saddle South – Precious Metal Rich Vein System
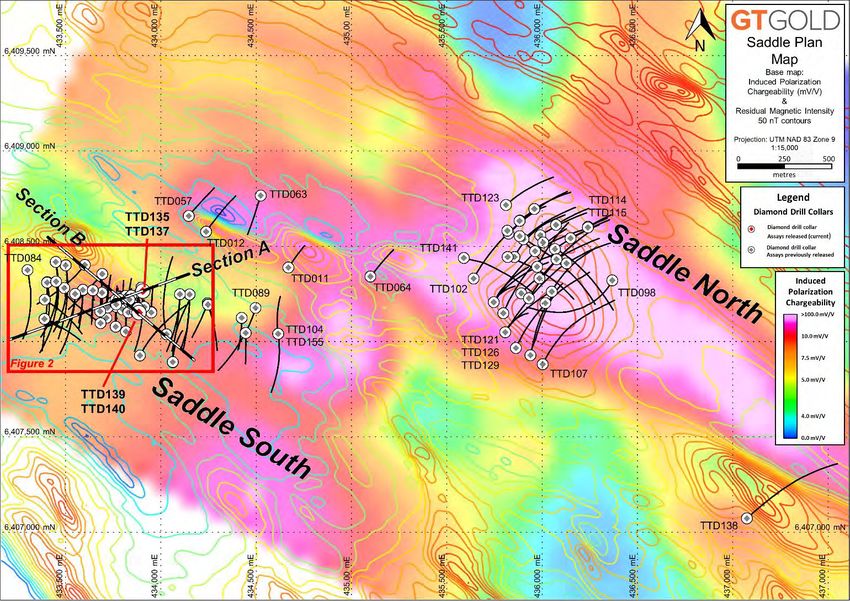
Saddle Zone Plan Map
• 2017: High grade gold-in-soil anomalies
IP chargeability basemap
Residual Magnetic Intensity (RMI) magnetic contours were followed up by first ever drilling at
TTD007 TTD135 Saddle South
51.53 g/t Au and 10.00 g/t Au and
117.38 g/t Ag 46.84 g/t Ag • Drilling to date (2017-2019) has outlined:
Saddle
Saddle North (West)
over 6.95 m over 53.73 m
TTD064 ✓ An extensive near-surface zone of
1.35 g/t Au high grade Au-Ag vein mineralization
and 0.37% Cu
over 18.50 m spanning ~1,000 m X 150 m X 700 m
✓ Good continuity across sections both
near surface and at depth in high
grade zones
TTD079 Eastern Extension ✓ Locally extensive surface expression
9.55 g/t Au of mineralization
over 40.89 m
TTD058 • Mineralized system remains open along
31.79 g/t Au and
1,141.10 g/t Ag Residual Magnetic
strike and at depth
Intensity (contours)
over 3.01 m
• Situated within 3 kilometres of Saddle
500 nT
mV/V
North project
0 1000
metres
-200 nT
mV/V
TSXV: GTT 14ADVANCING SADDLE AREA
Saddle South – Gold and Silver Rich System Adds Upside
TTD135
9.47 g/t Au TTD135 Historical drilling (2017-2019)
and 6.30 g/t Ag 10.00 g/t Au TTD135
4.29 g/t Au
over 2.59 m
(158.66 – 161.25 m)
and 46.84 g/t Ag
over 53.73 m and 8.53 g/t Ag • Reverse circulation drilling:
(93.27 – 147.00 m) over 14.80 m
(34.00 – 48.80 m) 2017: 28 holes (1,524 m)
• Diamond drilling:
2017: 58 holes (14,471 m)
2018: 36 holes (16,587 m)
2019: 4 holes (1,289 m)
TOTAL: 98 holes (32,347 m)
TTD140 TTD140
6.58 g/t Au 5.60 g/t Au
and 26.46 g/t Ag TTD140 and 15.19 g/t Ag
over 28.30 m 4.00 g/t Au over 15.00 m
and 15.23 g/t Ag (35.00 – 50.00 m)
(80.70 – 109.00 m)
over 23.74 m
(53.36 – 77.10 m)
TSXV: GTT 15ADVANCING SADDLE AREA
Saddle South – Cross Sections of a Precious Metal Rich Vein System
5.53 g/t Au
& 7.88 g/t Ag
4.29 g/t Au over 11.00 m
& 8.53 g/t Ag
over 14.80 m 5.60 g/t Au
10.00 g/t Au & 15.19 g/t Ag
& 46.84 g/t Ag over 15.00 m
over 53.73 m 4.00 g/t Au
2.80 g/t Au & 15.23 g/t Ag
& 2.45 g/t Ag over 23.74 m
30.39 g/t Au over 8.00 m 6.58 g/t Au & 26.46 g/t
& 56.71 g/t Ag Ag over 28.30 m
2.24 g/t Au 1.70 g/t Au
over 1.75 m
& 1.27 g/t Ag & 3.73 g/t Ag
9.47 g/t Au
over 6.49 m over 23.00 m
& 6.30 g/t Ag
over 2.59 m 1.91 g/t Au
& 16.05 g/t Ag
over 0.66 m
5.38 g/t Au
& 2.98 g/t Ag
over 1.00 m 0.52 g/t Au
& 0.67 g/t Ag
over 10.00 m
162020 Exploration
Cadia 5.5km
DEVELOPING A PROJECT PIPELINE Big Cadia Little Cadia
2020 Exploration: District Potential
Cadia Quarry Cadia Hill
Ridgeway
• Porphyry district comparisons show Tatogga upside Cadia East
• Initial diamond drill program beginning late July in
Quash Pass area
• Saddle remains a high priority target area Red Chris 3km
Main Zone East Zone OP Au ppm
0.5
Gully Zone 0.4
East Zone UG 0.3
Tatogga 0.2
Property 0.1
0
+1000 +1000
Saddle
NW Saddle North Anomaly ~3km
SE
Quash Pass
Red Chris mine
+0 +0
IP chargeability
Note: Cadia and Red Chris sections sourced from Newcrest’s Exploration Edge presentation (Jan 20, 2020)
TSXV: GTT 18QUASH-PASS
430,000 mN
432,000 mN
• Four Distinct Soil Geochemical Targets
• Main Trend, Silverhead, Central, &
6,402,000 mN Valleyside
• Multielement & Index Signatures
• Large base metal surface
expression
• Multielement zonation and
corridors
Au-in-Soil
(ppb)
1–5
5 – 10
10 – 25
25 – 50
50 – 75
75 – 100
100 – 150
>150
Induced Apparent
Polarization
Chargeability
Conductivity
(Mobile MT) Quash-Pass
> 25.0 mV/V > 6.86 mS/m
Plan Map
6.0 mV/V 5.59 mS/m Base maps:
IP Chargeability,
5.0 mV/V 5.06 mS/m
213 Hz MT, 50 m Elevation
4.0 mV/V 4.93 mS/m Contours, & Streams
.
Projection: UTM NAD 83
430,000 mN
432,000 mN
3.0 mV/V 4.73 mS/m Zone 9
TATOGGA PROPERTY 2.0 mV/V 4.54 mS/m 0 250 500
Quash-Pass 0.0 mV/V < 3.19 mS/m metresSADDLE AREA
• More to be Found
• Saddle North, along strike, at depth,
and in the Poelzer Footwall
• Western Geochem, Central and
Southern IP anomalies
• New and Old Targets
from Surface
• TTD064: 7.40 m @
2.28 g/t Au, 0.56% Cu
Collars
Legend
Past
Drilling
Induced RMI
Au-in-Soil
Polarization Magnetics Quash-Pass
Chargeability Contoured
(ppb)
> 25.0 mV/V >500 nT Plan Map
1–5
Base maps:
6.0 mV/V
5 – 10
100 nT IP Chargeability,
10 – 25 5.0 mV/V RMI Magnetic Contours,
25 – 50 50 m Elevation Contours,
4.0 mV/V 50 nT & Streams
50 – 75 .
3.0 mV/V 0 nT Projection: UTM NAD 83
75 – 100 Zone 9
TATOGGA PROPERTY 100 – 150 2.0 mV/V 0 250 500
Saddle North >150
0.0 mV/VSOCIAL RESPONSIBILITY 2019 FIELD SEASON
Working in Tahltan Traditional Territory 27% Tahltan employees
Exploration spending in
$3M contracts with Tahltan or
Tahltan Partner companies
Community Sponsorship and
~$70k Communications Agreement
Respect for Community, Culture and Wildlife
• Formal Communication and Engagement
Agreement with Tahltan Central Government
• Continuing water sampling
• Progressive reclamation of drill and camp areas
• Archaeology assessment and surveys
TSXV: GTT 21INVESTOR INFORMATION
Equity Structure & Analyst Coverage
39.6
2020 Year to Date2 Share Perfomance
Institutions
+38%
+34% GT Gold average
% GTT daily volume:
Retail +19%
Directors & 546,000 shares
Ownership1 24.7 +4% (consolidated across
Management 11.9 Canadian venues)
GT Gold GDXJ Gold Copper
9.9%
14.9 8.9
Newmont5 Ross Beaty Capitalization and Balance Sheet (C$)
Share Price2 $1.47
Analyst Coverage Basic Shares Outstanding3 125.9M
• Agentis Capital – Michael Gray Options Outstanding3 10.4M
• Cormark Securities – Brock Colterjohn Basic Market Capitalization $185.1M
• Industrial Alliance – George Topping Cash4 $14.4M
Total Debt $0
• M Partners – to be confirmed, analyst left firm
1. Source: IR Insight, Cap IQ, Morningstar, direct communication with firms and SEDI
• Paradigm Capital – David Davidson filings to May 30, 2020.
2. Prices and year to date average volume provided as at close of day July 22, 2020.
• PI Financial – Chris Thompson 3. As at April 20, 2020.
• Stifel GMP – Tyron Breytenbach 4. As at March 31, 2020.
5. Refer to financing press releases dated May 29, 2019 and December 12, 2019.
.
TSXV: GTT 22Q&A
Thank you for joining

     Sunlife Plaza. 1100 Melville Street, Suite 610
                Vancouver, BC V6E 4A6
       236-427-4711 | www.gtgoldcorp.ca

        For investor inquiries, please contact:
JENNI PIETTE, HEAD OF INVESTOR RELATIONS
       647-531-2471 | j.piette@gtgoldcorp.ca
You can also read