Investment in North Queensland Airports - 11 January 2010 - HotCopper
←
→
Page content transcription
If your browser does not render page correctly, please read the page content below
Investment in
North
Queensland
Airports

11 January 2010
Contents
•   Transaction Overview
•   Investment Profile
•   Fit with Growth Strategy
•   North Queensland Airports Overview
•   Investment Attractions
     –   Shared tourism objectives
     –   Upside potential
     –   Opportunity to add value
     –   Low future capital expenditure requirements
     –   Synergies with Auckland
     –   Risk diversification
     –   Compatible co-investors
•   Appendices
     –   Background to Cairns
     –   Background to Mackay
     –   Background to Tropical North Queensland

                                                       2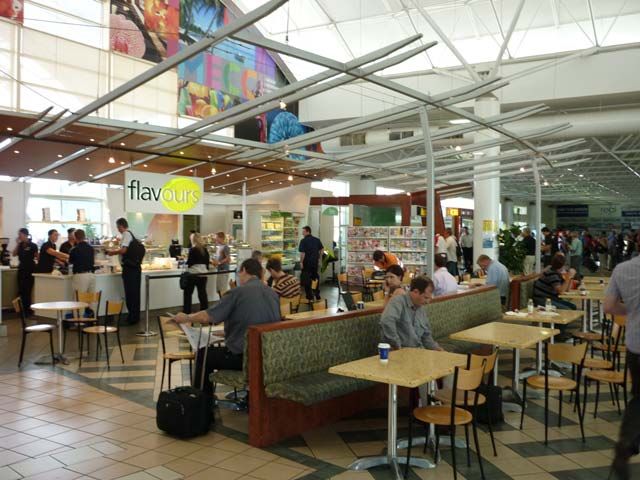
Transaction Overview
•   Purchase of 24.55% stake in North Queensland Airports (NQA), the operator of Cairns and
    Mackay Airports, for A$132.8m (NZ$166m)
•   To settle on 13 January 2010, timing driven by vendor requirements
•   Subject to NQA financier consents prior to settlement
•   Initially funded from existing debt facilities
•   Subsequently, the funding strategy is likely to involve a mixture of equity and debt consistent
    with Auckland Airport’s current capital structure
•   No impact on Auckland Airport existing credit rating of A- anticipated
•   Good potential to work with Cairns as a strategic stepping stone to strengthen air services
    connections between New Zealand and Asia
•   Rare opportunity to enter higher-growth Australian market and partner with key Australian
    airport investors
•   Auckland Airport moved to secure this opportunity, having initially investigated it when North
    Queensland Airports was being privatised 12 months ago
•   A measured step-out initiative for Auckland Airport in line with Growth Strategy announced
    earlier last year - modest investment representing ~5% of Auckland Airport total assets
•   No material impact from this transaction on Auckland Airport dividends

                                                                                                      3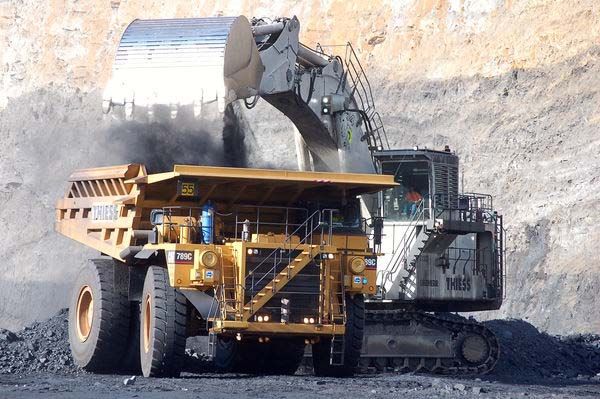
Overview: Cairns and Mackay locations

                                        4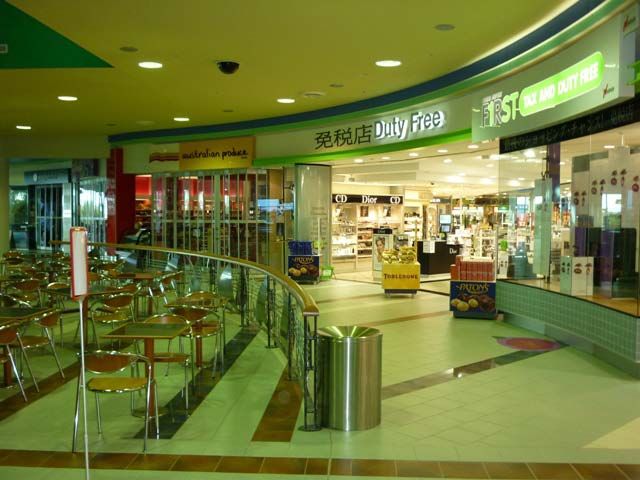
Attractive Investment Profile
•   Expected equity internal rate of return on Auckland Airport’s investment in North
    Queensland Airports in the mid-teen percentages
•   Purchase price slightly above price paid to State a year ago in the depths of the
    global financial crisis, and since then:
     –   The A$200m Cairns domestic terminal upgrade has largely been completed and a new
         strategic agreement with Jetstar has been announced
•   High recent capex positions Cairns well for “capex-lite growth”– meaning cashflow
    is forecast to exceed accounting earnings
•   Superior growth prospects of Cairns/Mackay Airports as tourism and economic
    conditions rebound and the full benefits of coming out of government ownership
    emerge
•   Purchase price represents an implied prospective EV/EBITDA multiple higher than
    Auckland Airport’s trading multiple, reflecting the turnaround growth outlook
•   Likely to have small dilutive effect on Auckland Airport earnings per share which will
    improve as Cairns Airport recovers from downturn in direct international passenger
    numbers

                                                                                            5
Fits with our step-out strategy
•   Our highest value growth step-out option
    is to invest in other airports through which
    we can drive synergies with and volume
    for our core business at Auckland
•   Our main value driver is growth in
    international passenger volumes through
    Auckland Airport
•   Asian tourism markets offer the greatest
    opportunity for long-term volume growth
•   One key enabler to growing Asian traffic is
    improved air services connections
•   While our ultimate goal is direct Asian
    connections with Auckland, an important
    parallel approach is to strengthen
    connections with other strategically
    located airports

                                                   6
North Queensland Airports Overview
  •    Operator of Cairns and Mackay Airports
  •    Privatised by Queensland Government approximately 12 months ago
  •    Shareholders:
         –   Auckland Airport                                    24.55% (acquired from Westpac Bank)
         –   JP Morgan Infrastructure Investments Fund
             (advised by JP Morgan Asset Management)             49.90%
         –   The Infrastructure Fund (Hastings-managed)          20.12%
         –   Perron Investments                                   5.43%
  •    Shareholders holding more than 20% are entitled to appoint a director and have
       veto rights on major decisions
  •    Estimated and summarised North Queensland Airports balance sheet as at 31
       December 2009:
                                                          A $m                                                 A $m
Equity                                                    489         Property, Plant, Equipment               577
Debt                                                      365         Prepaid operating lease                  42
Other liabilities                                         35          Other                                    59
                                                          -           Goodwill                                 211
Total Shareholders’ Equity and Liabilities                889         Total Assets                             889
                                                                  Source: unaudited management information provided by NQA

                                                                                                                     7
Cairns Airport Overview
• Represents around ¾ of the purchase price
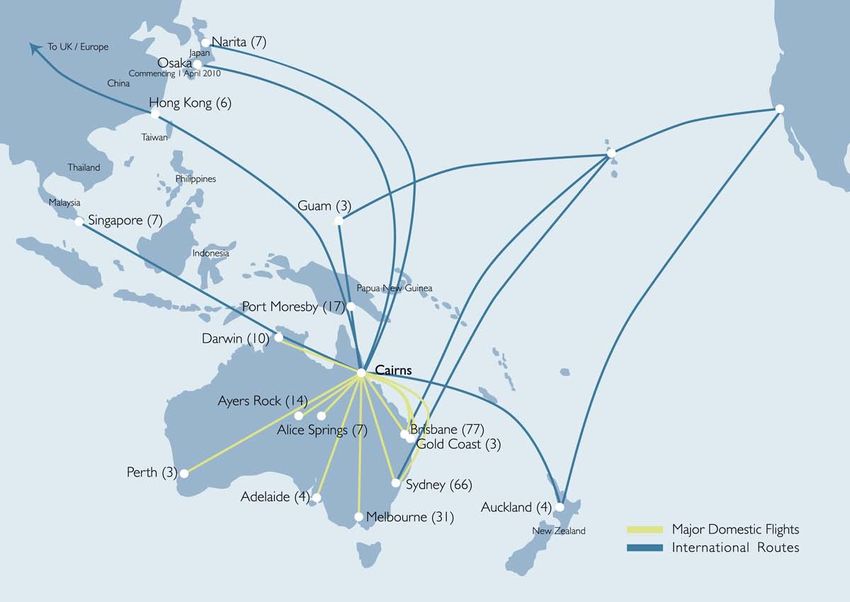
• Australia’s seventh busiest airport with 680,000 international pax, 3.0m domestic pax in FY09
• Gateway to Tropical North Queensland, a major Australian leisure destination:
– Two World Heritage listed attractions (Great Barrier Reef and Wet Tropics Rainforests)
– Serviced by Qantas, Jetstar, Virgin Blue, Cathay Pacific, Air New Zealand, Continental
Airlines, Air Niugini and Airlines PNG (and soon to be Pacific Blue)
• International pax volumes down from over 1m pa in 2007 to ~0.5m in FY10; partly due to
decline in Japanese visitors (withdrawal of Qantas services, a general reduction in Japanese
outbound leisure travel and a significant Australian dollar appreciation against the Yen)
• Well positioned to rebound and benefit from increasing Asian inbound tourism:
– Australia’s closest east coast airport to rapidly growing Asian markets
– New long term strategic agreement with Jetstar with sights on Asia
– Recently-announced Australian Federal Government tourism and airline support
packages and Queensland State Government tourism promotional initiatives
• Domestic passenger volumes grown strongly over the last decade and expected to maintain
that growth trend
• Ample terminal capacity for international growth and close to completing a A$200m
redevelopment of domestic terminal
8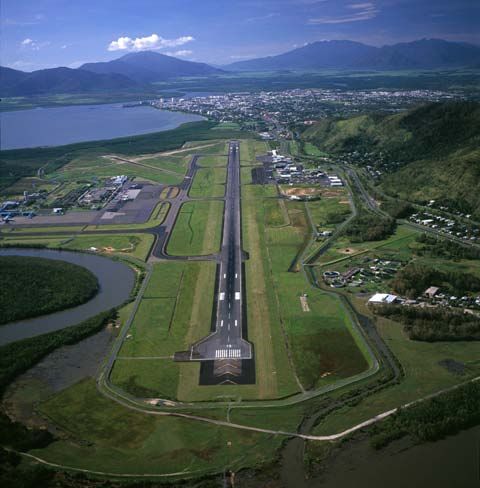
Mackay Airport Overview
•   Represents around ¼ of the purchase
    price
•   An important regional airport, benefiting
    from the strong resources industry and
    location close to the Whitsunday Islands
•   Access point to Bowen Basin, one of
    largest coal-mining regions in the world
    containing over 70% of known coal
    reserves in Queensland
•   946,000 domestic pax in FY09
    (passenger volumes have more than
    trebled since 2002)
•   Serviced by Qantas, Jetstar, Virgin Blue,
    Tiger Airways and Regional Express
•   Refer to Appendix B for further
    information

                                                9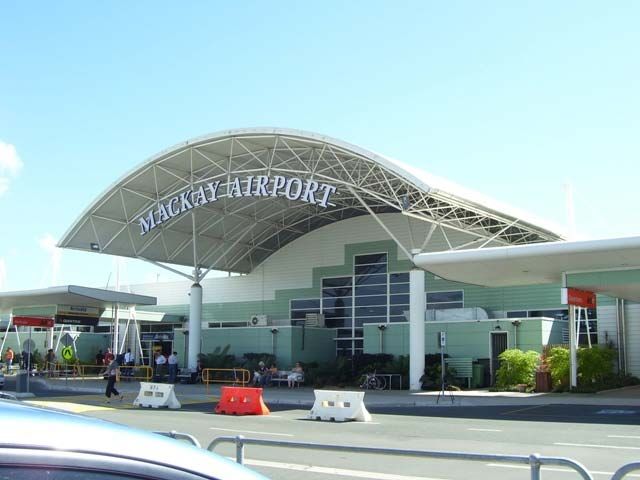
Routes

         10
Investment Attractions
• Shared tourism goals
• Good upside potential for
investment
• Opportunity to add value
• Low future capex requirements
• Synergies with Auckland
• Risk diversification
• Influential and compatible co-
investors
11Shared tourism goals
• Shared objective to drive passenger Forecast Asian Visitor Arrivals to Australia
volume growth from high growth Asian 17.0%
16.0%
markets 15.0%
14.0%
• Air services development is a major 13.0%
12.0%
focus 11.0%
2009-2018 CAGR
10.0%
9.0%
• Australia has higher growth targets for 8.0%
Asian market: forecast 7.0% p.a. growth 7.0%
6.0%
for Asian visitors to Australia 2009-2014, 5.0%
4.0%
versus New Zealand 3.8% p.a. 3.0%
2.0%
– Australia is forecast to continue to grow 1.0%
0.0%
strongly until at least 2018 – see chart -1.0%
opposite) Total Asia Japan China Singapore South Malaysia Hong India Indonesia Other Asia
Korea Kong
• Cairns particularly well placed to benefit as
tourism and economic conditions improve Source: Tourism Australia
– Well located within 5-7 hours flying distance
of China and a number of rapidly growing
Asian tourism markets
12Good Upside Potential for Investment
• Opportunity to re-generate leisure traffic by
targeting Australian and Asian low cost
carriers
• The Australian Government announced in
December 2009 a package of air services
development initiatives
• Tourism marketing commitments (in excess
of A$45m over 3 years) have been made
• Foreign airlines that make stopovers at
regional international airports will be offered
greater access to the four major gateway
airports of Sydney, Melbourne, Brisbane and
Perth
• Significant retail enhancement and longer
term property development opportunities at
both Cairns and Mackay Airports
13Opportunity to Add Value
• Auckland Airport will be the only shareholder of
Cairns/Mackay which is an airport operator
• Auckland Airport’s support will be required for major
decisions including changes to the business plan
• North Queensland Airports management welcome
Auckland Airport’s involvement and look forward to
developing opportunities together
• Potential to contribute world-class expertise in route
development, retail and property development
• Opportunities to leverage relationships with
suppliers, contractors and corporate service
providers on a multi-airport basis
14Low Future Capex Requirements
• A$200m domestic terminal
redevelopment at Cairns is close
to completion with no substantial
capital expenditure expected for a
number of years thereafter
• Direct international passenger
volumes are currently ~50% of
what they were at their peak, so
substantial capacity in existing
international terminal
• Overall capital expenditure
required to support projected
growth in passengers is low
15Synergies with Auckland
• While North Queensland Airports has been valued as a
stand-alone investment we believe there is significant
synergy potential
• Air services development: encourage airlines to use
Cairns as a ‘stepping stone’ to strengthen connections
between Auckland and Asia
• Currently 16 international airlines flying to airports on
Australian eastern seaboard do not fly to NZ
• Tourism marketing: leverage the dual-destination
attraction of Tropical North Queensland and New Zealand
• Of the 700,000 overseas visitors annually to Tropical North
Queensland, only a small proportion fly onto NZ
• NZ outbound travel: only 9% of New Zealanders
travelling to Queensland currently visit Tropical North
Queensland
• Within five years the potential benefits to Auckland Airport
are estimated to be at least ~100,000 additional pax pa –
delivering incremental EBITDA of ~NZ$2.0-2.3m pa –
which will deliver over $100m annual benefit to the NZ
economy.
16Risk Diversification
• Whilst the investment represents only 5%
of Auckland Airport’s total assets it does
provide an element of risk diversification
by:
• exposure to the higher growth
Australian tourist and Queensland
resources economies
• North Queensland Airport’s revenue
is 100% unregulated (c.f. Auckland
Airport ~53% regulated)
17Influential and Compatible Co-investors
• We are investing alongside two
experienced long-term investors:
• Hastings is the leading Australian
multi airports investor. Hastings-
managed funds have significant
investments in other Australian
airports – Perth, Gold Coast,
Darwin and Melbourne - which
have combined pax of ~47.3m pa
• JP Morgan Asset Management’s
Infrastructure Investments Group
is a major infrastructure/airport
investor with a global footprint
and funds under management in
excess of US$3bn
18Appendix A
Background to
Cairns Airport
19Additional Information on Cairns Airport
• Cairns Airport is located approximately 7 km from the Cairns
CBD
• The key driver of passengers is tourism, with a smaller
secondary driver of mining/business
• Cairns Airport is the closest airport on Australia’s east coast to
a number of rapidly growing Asian markets. For example, flying
time to Hong Kong is approximately 7 hours, to Singapore is
approximately 6 hours
• The airport has direct flights to all Australian capital cities with
the exception of Hobart and a high number of regional
destinations are also serviced from Cairns
• Aeronautical and other charges are determined by negotiation
with airlines and are not currently regulated (the ACCC will only
intervene in cases of abuse of market power)
• No curfew, operating 24 hours, 7 days a week
• Was owned by Cairns Port Authority until January 2009, when
it was sold by the Queensland State Government to the
IIF/TIF/Westpac/Perron consortium.
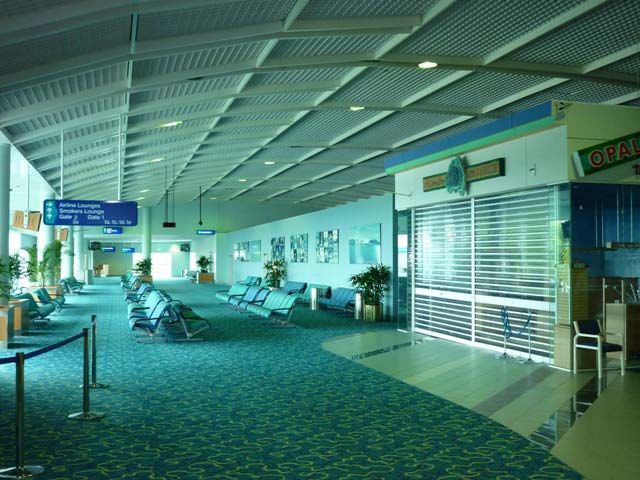
20Cairns Airport Facilities
• Cairns Airport has a main north-south runway (3,196m) and a smaller cross runway
(925m) for general aviation
• The international terminal is a 3 level building with a total floor area of 25,419m2
• A major A$200 million redevelopment of the domestic terminal (which will bring the
total floor area of the terminal to 37,545m2) is due for completion in the second half of
2010 and will accommodate significant future growth
• The international apron has 9 stands, 5 of which are served by aerobridges. The
domestic apron has 14 stands, and will have 5 aerobridges following completion of
the domestic terminal redevelopment
• The international terminal has 225 parking spaces. Following completion of the
domestic terminal redevelopment there will be approximately 1,000 domestic parking
spaces
• The international terminal provides approximately 3000m2 of retail space with
significant opportunities for enhancement. Following completion of the domestic
terminal development, the domestic terminal will have an improved retail offering with
21 tenancies
• There will be 328 rental car bays following completion of the domestic terminal
redevelopment
21Recent Developments for Cairns Airport
• Jetstar increased services;
– Reintroduction of 4 flights a week between Cairns and Osaka, commencing in April 2010
– Addition of 18 additional flights a week between Cairns and Sydney, Melbourne, Perth and
Adelaide
• Pacific Blue have announced they will be flying twice a week direct between Cairns and Auckland
commencing in March 2010
• In November, Cairns Airport announced a long-term strategic agreement with Jetstar, which is
structured to incentivise international passenger growth prospects for the Tropical North Queensland
region
– Includes a working group with Tourism Tropical North Queensland, Tourism Queensland,
Tourism Australia, the Queensland Government and Jetstar to ensure marketing efforts are
maximised and to develop a forward plan for route development opportunities
• In December, the Australian Federal Government announced important new initiatives to help make
regional international airports, such as Cairns Airport, even more attractive ports of call for
international airlines and tourists
• Foreign airlines that make stopovers at regional international airports will be offered greater
access to the four major gateway airports of Sydney, Melbourne, Brisbane and Perth
• In future bilateral negotiations, foreign airlines will be offered greater “beyond rights” from
regional international airports to New Zealand and/or the Pacific Islands (subject to agreement
by those countries).
22Cairns Airport Passenger Numbers
• Overall passenger numbers declined 4.0% in 2009 to 3.7 million due to a decline in
international passengers, particularly from Japan
• Overall CAGR between 2003 and 2009 of 3.0%, driven by strong growth in domestic
passengers offsetting a decline in international passengers
• It has been estimated that 40% of passengers who travel on the Cairns Airport domestic
network are international passengers who, due to the limited direct international services
into Cairns Airport, transit or stopover at other Australian capital city airports
3.5 m Domestic International
3.0 2003-09 CAGR %
2.5
Domestic 6.0%
2.0
1.5 International (5.4%)
1.0 Total 3.1%
0.5
-
2003 2004 2005 2006 2007 2008 2009
Source: Cairns Port Authority
23Cairns Historical Financials
A$m, financial year to June FY06 FY07 FY08 FY09 CAGR FY06-09
Revenue 61.3 63.0 66.4 57.6 (2.1%)
Expenses* (14.2) (15.7) (18.2) (20.5) 13.0%
EBITDA* 47.1 47.3 48.2 37.0 (7.7%)
FY09 Revenue Breakdown
Property
Non- Rentals Retail and
Aeronautical 28% Advertising
40% Aeronautical 35%
60%
Ground Transport
37%
Total Revenue A$57.6m Total Non-Aeronautical Revenue A$23.1m
*Source: NQA. FY06-08 under public ownership Cairns Airport was part of Cairns Port Authority and not
a standalone airport and the above results do not include any allocation of corporate costs. FY09 figures
are estimates and represent a combination of the financial results of the three different ownership 24
regimes and are inclusive of corporate costs.Appendix B
Background
to Mackay
Airport
25Additional Information on Mackay Airport
• Mackay is an important regional centre in North Queensland
and has a population of around 90,000
• Mackay Airport is located approximately 5 km from the Mackay
CBD and served approximately 946,000 passengers in FY09
• The key driver of passengers is coal mining/business, with a
smaller secondary driver of tourism (given proximity to over 74
Whitsunday Islands and Central Queensland)
• The major mines in the Bowen Basin coalfields are typically
within 2 to 2.5 hrs driving time from Mackay.
• Strong economic growth in the region since coal prices began
to rise rapidly in 2002, has seen passenger numbers more than
treble in the last 8 years
• Mackay Airport has direct flights to Brisbane, Sydney,
Melbourne and a number of regional destinations in
Queensland
• Aeronautical and other charges are determined by negotiation
with airlines and are not currently regulated (the ACCC will only
intervene in cases of abuse of market power)
• No curfew, operating from 5:15am to 9:00pm, 7 days a week
26Mackay Airport Facilities
• Mackay Airport has a main runway (1,981m)
and a smaller cross runway (1,344m) for
general aviation
• The terminal is generally single storey and
contains a 500m2 concourse area, a 815m2
departure level and a 450m2 outdoor seating
area
• 13 check-in desks and 6 car rental desks
• 2 baggage carousels (45m each)
• The aircraft parking aprons have been
designed to accommodate up to A320, E190
or B737-800 on Bays 1 to 4, Dash 8-300 / 400
on Bays 1 and 5 and a B767 on bay 1a
• The airport has approximately 1,030 car parks
for the public, staff and car rental companies
• There are currently 2 retail outlets at the
airport, with significant opportunities to
expand the offering
27Mackay Airport Passenger Numbers
• Passenger numbers at Mackay increased 13.0% in 2009 to 940,000 passengers
• Overall CAGR between 2003 and 2009 of 17.1%, driven by the development of the Bowen
Basin coal fields and the associated impact of the “fly in – fly out” workforce
1.0 m
0.8 2003-09 CAGR %
0.6 Domestic 17.1%
0.4
0.2
-
2003 2004 2005 2006 2007 2008 2009
Source: Mackay Ports
28Mackay Historical Financials
A$m, financial year to June FY06 FY07 FY08 FY09 CAGR FY06-09
Revenue 9.9 12.0 14.1 16.2 17.8%
Expenses (4.1) (4.7) (4.8) (5.0) 6.8%
EBITDA 5.8 7.3 9.3 11.2 24.5%
FY09 Revenue Breakdown
Property Retail and
Rentals Advertising
10% 10%
Non-
Aeronautical
30%
Aeronautical
70%
Ground Transport
80%
Total Revenue A$16.2m Total Non-Aeronautical Revenue A$4.9m
*Source: NQA. FY06-08 under public ownership Mackay Airport was part of Mackay Port Authority and
not a standalone airport and the above results do not include any allocation of corporate costs. FY09
figures are estimates and represent a combination of the financial results of the three different
29
ownership regimes and are inclusive of corporate costs.Appendix C
Background to
Tropical North
Queensland
30Overview of Tropical North Queensland
• The Tropical North Queensland region (covering approximately
270,000 km2) is internationally recognised as a premier tourist
destination
• Tropical North Queensland has an estimated population of
approximately 262,000 and attracted more than 2.2 million
overnight visitors in FY09. According to Tourism Queensland,
visitors spent over $2.4 billion in the Tropical North Queensland
region during 2009
• Key Tropical North Queensland attractions include the Great
Barrier Reef; Wet Tropics rainforests, and tropical island retreats
• More than 11,000 guest rooms, representing 5.1% of all guest
rooms in Australia
31TNQ tourism market
• In 2008/09, around 24% of holiday visitors to Approximate FY09 Breakdown of Visitors
Australia had a stopover at Tropical North to Tropical North Queensland by Country
of Residence
Queensland during their time in Australia, ranking
third behind Sydney and Melbourne
• The region is also a highly popular destination for Japan
18%
Australians, receiving over 1.5 million domestic Other
overnight visitors and over 2 million day trip visitors 31%
during 2009
• Tourism Australia is predicting strong tourism growth
for Australia from India (14.8% 2008-2018 CAGR), United Kingdom
18%
China (10.3%) and a number of other Asian
countries
Canada
• Tropical North Queensland has an opportunity to 4%
China
5% New
benefit from this predicted growth and decrease its Zealand USA
5% Germany 12%
historical reliance on Japan. 7%
Source: Tourism Australia, International Visitor Survey
32Australia has higher ambitions than NZ for Asian tourism growth
Asia NZ Asia Aus
Sources:
Tourism New Zealand and
Tourism Australia figures
and forecasts 3,060,000
2,893,000
2,702,000
2,524,000
2,348,000
2,236,000 2,210,000 2,231,000
2,124,000 2,117,000 2,159,000
2,078,000 2,042,000
2,021,000 2,018,000
1,917,000
544,474 529,516 519,560 512,084 502,422 515,600 542,740
463,519 489,580 450,049 461,920 489,210
432,801 404,620 434,180
364,000
2000 2001 2002 2003 2004 2005 2006 2007 2008 2009f 2010f 2011f 2012f 2013f 2014f 2015fYou can also read