Casper Noise Lab User Manual
←
→
Page content transcription
If your browser does not render page correctly, please read the page content below
CITY OF SUNNYVALE                     F E B R U A R Y 1, 2 0 2 1

            Casper Noise Lab User Manual

                                           Casper Airport Solutions Inc
                                        1055 Westlakes Drive, Suite 300
                                                    Berwyn, PA 19312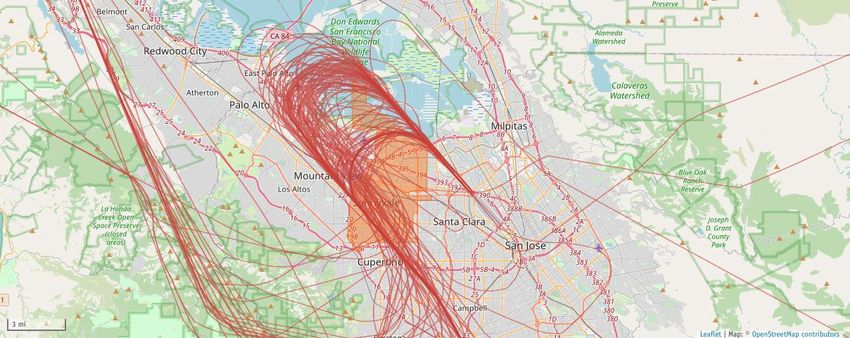
TABLE OF CONTENTS
1 HOME PAGE ............................................................................. 4
  1.1 Site Navigation Menu................................................................................................................. 5
  1.2 Current Operational Conditions ............................................................................................. 5
  1.3 Flight Track Map........................................................................................................................... 5
  1.4 Runway Utilization Indicator .................................................................................................... 6
  1.5 Weather Conditions .................................................................................................................... 6
  1.6 Status News Item ......................................................................................................................... 7
  1.7 Calendar .......................................................................................................................................... 7
  1.8 News Items ..................................................................................................................................... 8
  1.9 Data from Yesterday ................................................................................................................... 8
  1.10 Frequently Asked Questions (FAQs) ................................................................................... 9
2 FAQ PAGE .............................................................................. 10
3 EDUCATION PAGES .................................................................... 11
4 FLIGHT TRACKER PAGE .............................................................. 12
5 HISTORY PAGE ......................................................................... 13
  5.1 Arrivals per Runway Chart ...................................................................................................... 14
  5.2 Departures per Runway Chart ............................................................................................... 14
  5.3 Top 5 Noise Events Chart........................................................................................................ 15
  5.4 Flights per Period Chart........................................................................................................... 16
  5.5 Flights per Hour Chart.............................................................................................................. 16
6 NOISE PAGE ............................................................................ 18
  6.1 Aircraft Noise Events per Period Chart .............................................................................. 19
  6.2 Average Aircraft Noise Events per Hour Chart................................................................ 19
  6.3 Top Aircraft Noise Events (max dBA) Chart ...................................................................... 20
  6.4 Aircraft Noise Events Chart .................................................................................................... 21
7 TRAFFIC PAGE ......................................................................... 22
  7.1 Arrivals per Runway (Day) Chart ........................................................................................... 23
7.2 Arrivals per Runway (Night) Chart ....................................................................................... 24
  7.3 Departures per Runway (Day) Chart ................................................................................... 24
  7.4 Departure per Runway (Night) Chart .................................................................................. 25
8 SOUTH FLOW PAGE ................................................................... 27
  8.1 Aircraft Noise Events (Max dBA) RNP Approach Chart ................................................ 28
  8.2 Aircraft Noise Events (Max dBA) non-RNP Approach Chart ...................................... 29
  8.3 Jet Arrivals per Approach ........................................................................................................ 30
  8.4 Altitude Chart .............................................................................................................................. 30
  8.5 Flights per Aircraft Type Chart .............................................................................................. 31
  8.6 Flights per Airline Chart ........................................................................................................... 32
9 REPORT PAGES ........................................................................ 33
  9.1 Sunnyvale Overflight Data Report ....................................................................................... 33
  9.2 SJC South Flow Data Report .................................................................................................. 33
  9.3 Raw Noise Data Report............................................................................................................ 34
10 UPDATES PAGE ....................................................................... 35
11 COMPLAINTS PAGE .................................................................. 36
12 RETURN TO SUNNYVALE ........................................................... 37
Casper Noise Lab User Manual
                                                                                        February 1, 2021

1 Home Page
To launch Casper Noise Lab, open your web browser and input the following address in the search bar:
https://syv.noiselab.casper.aero

                                        Figure 1 – Home Page

                                                                                                       4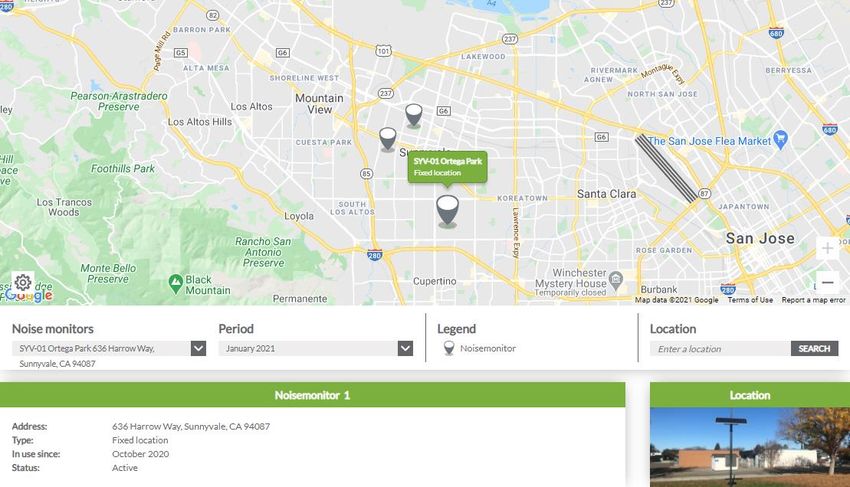
Casper Noise Lab User Manual
                                                                                             February 1, 2021

1.1 Site Navigation Menu
The site navigation menu at the top of the webpage allows you to navigate the site and visit the various
pages. Each menu item is described in greater detail in Sections 2 through 12.

Note: some menu items contain a drop-down list requiring you to make a selection to view the
information on that particular page. The current active page is highlighted in green.

                                      Figure 2 – Site Navigation Menu

1.2 Current Operational Conditions
Just below the Site Navigation Menu is the Current Operational Conditions summary as shown in Figure
3. This bar displays the current weather conditions and runway utilization reported by the Casper NOMS
system for Norman Y Mineta San Jose International Airport (KSJC), including the current runways in use
for Arrivals      and       Departures.

                           Figure 3 – Current Operational Conditions Summary

1.3 Flight Track Map
Below the Current Operational Conditions bar is a live view of the Flight Tracker's current flight activity,
as shown in Figure 4. For FAA security reasons, the Flight Tracker operates on a 10-minute delay. You
can click on a flight on the map to see additional information about that operation.

Note: Clicking on the map will not launch the Flight Tracker website. To do that, select the Flight
Tracker entry on the site navigation menu above the map.

                                                                                                               5
Casper Noise Lab User Manual
                                                                                            February 1, 2021

                                   Figure 4 – Flight Track Map Window

1.4 Runway Utilization Indicator
Just to the right of the Flight Track map is the Runway Use Indicator as shown in Figure 5. This diagram
shows the current observed runway use at Norman Y Mineta San Jose International Airport (KSJC).
Casper calculates the runway use by analyzing the last five minutes of activity at the airport. The arrival
runway is highlighted in red, and the departure runway is highlighted in green. During overnight hours,
the display may be blank for long periods due to a lack of activity at KSJC.

                                  Figure 5 – Runway Utilization Indicator

1.5 Weather Conditions
To the Runway Use Indicator's right, the current weather conditions measured by the KSJC Airport
weather station are displayed as shown in Figure 6. The Meteorological Aerodrome Report (METAR)
provides hourly surface weather observations, including the temperature, wind speed, wind direction,
precipitation, and cloud cover.

                                                                                                          6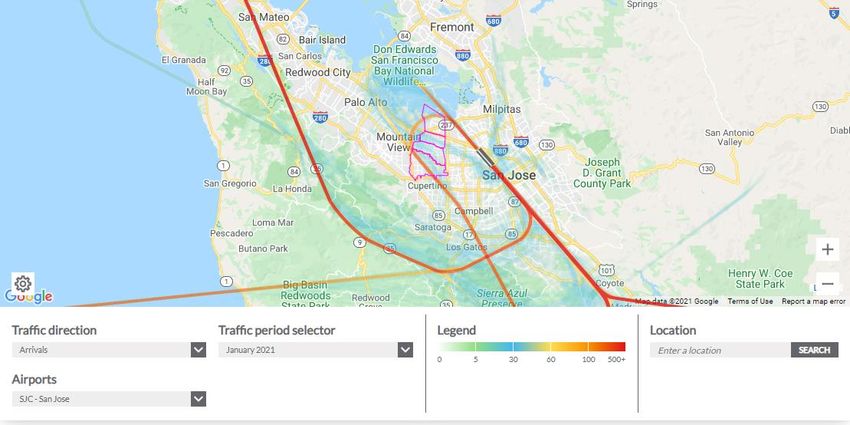
Casper Noise Lab User Manual
                                                                                             February 1, 2021

                                  Figure 6 – Current Weather Conditions

1.6 Status News Item
Below the Runway Use Indicator, you will find active calendar notices for the current day. Only notices
for the current day or the selected day on the calendar will be shown. Clicking the "Read more" button
will display the full notice as shown in Figure 7.

                                      Figure 7 – Active Calendar Notice

1.7 Calendar
To the right of the Status News Item block, you will see the Calendar. The calendar will highlight the
current day in        . Dates with active notices on the calendar are highlighted in          , as shown in
Figure 8. Clicking on a day with a notification displays that notification in the Active Calendar Notice
block.

Note: Only days with a gray calendar notice can be selected. To advance the calendar forward or
backward, use the           arrows.

                                                                                                              7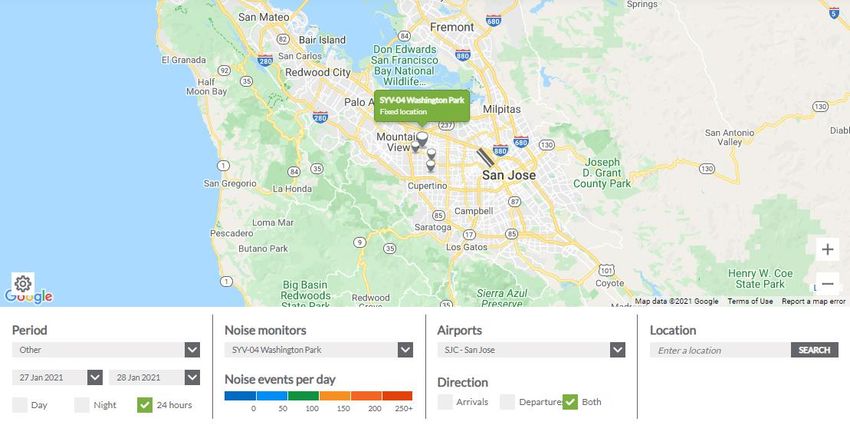
Casper Noise Lab User Manual
                                                                                            February 1, 2021

                                      Figure 8 – Calendar Examples

1.8 News Items
Below the Flight Track Map is the News Items section as shown in Figure 9. In this section, current news
items display in date order from left to right. Only notices with the current or past dates will display
here. News items with a future publication date will not display in this section until the publication date
is reached. Select the  arrow to the right of the news item to expand it and view the full text. Click
on the More News Items > to be taken to the Updates webpage, where you can view all current and
archived news items.

                                      Figure 9 – News Items Section

1.9 Data from Yesterday
In this section, interactive charts display flight operation data from the previous day as shown in Figure
10. The charts are interactive, and hovering over a data slice or bar indicates the number of operations
for that period. You can also click on a particular entry in the chart legend and remove that entry. The
charts will update automatically to reflect the new data. Click on the           directional arrows to
scroll through the available charts.

                                                                                                             8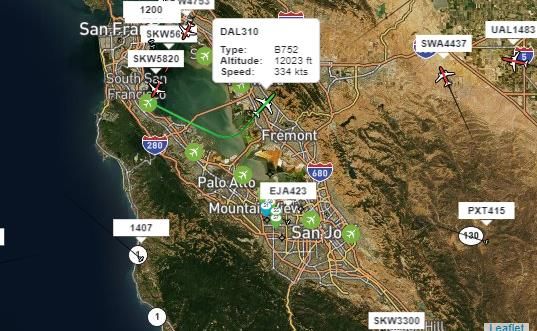
Casper Noise Lab User Manual
                                                                                          February 1, 2021

                                Figure 10 – Data from Yesterday Section

1.10 Frequently Asked Questions (FAQs)
The FAQ section below the charts contains answers to aircraft noise topics that residents often inquire
about. Select a particular FAQ to open and view the corresponding answer. Click on the (read more) >
link to see the full answer. Selecting the More FAQ > entry opens the FAQ webpage allowing you to
view all FAQs currently available.

                                        Figure 11 – FAQ Section

                                                                                                          9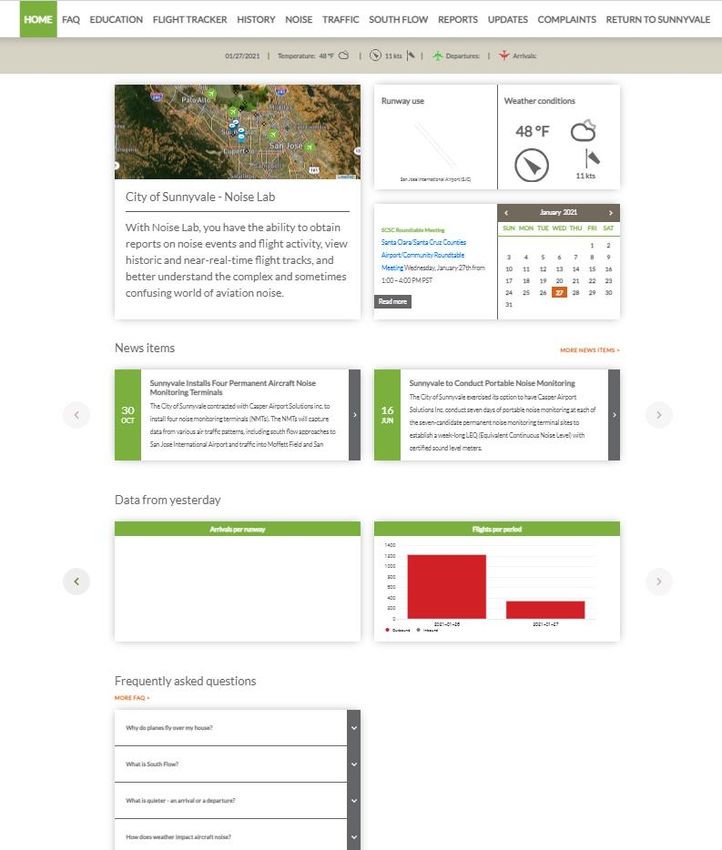
Casper Noise Lab User Manual
                                                                                           February 1, 2021

2 FAQ Page

The FAQ page provides access to all currently posted Frequently Asked Questions. The FAQs appear in
the Date/Time order that they were created, with the most recent appearing at the top left and the
oldest appearing in the bottom right. If all FAQs are not displayed, clicking on the SHOW ALL entry will
display them. Selecting a particular entry will slide open the answer below the question. Click on the
(read more) > link to see the full answer.

                                          Figure 12 – FAQ Page

                                                                                                        10
Casper Noise Lab User Manual
February 1, 2021
3 Education Pages
The Education pages provide access to a series of educational topics that help users better understand
the complex world of aviation noise, air traffic control, and flight operations. Each course is dedicated
to a specific topic area. Much of the material contained in the 101 pages were taken directly from the
Noise 101-course material taught by the author (Gregory Maxwell) at the annual U.C. Davis Aviation
Noise Symposium. The included topics are:
• South Flow 101 – Contains information about South Flow operations at KSJC Airport
o How winds affect the traffic flow direction at KSCJ Airport
o Comparison of ILS/GPS approaches and RNP approaches to Runway 12L/R
o Comparison of typical vertical flight profiles of the two types of approaches
• Noise 101 – Contains information about noise terminology, metrics, and measurement
o A-weighted noise measurement
o Quantifying changes in sound energy
o Aircraft noise footprint
o Noise metrics such as Lmax, SEL, Leq, Ln, DNL, and CNEL
• Aircraft 101 – Contains information about aircraft noise, factors that affect performance
o Aircraft noise sources
o Environmental/Operational factors that influence aircraft noise
o Evolution of jet engines from 1955 to the present
o Aircraft noise certification process
o Wake turbulence and aircraft spacing requirements
• Airspace 101
o General FAA airspace classes and their limitations
o Special Use Airspaces and their limitations
o Other specialized airspace areas
• Air Traffic 101
o Responsibilities and jurisdiction of FAA in controlling aircraft movements
o Influence of weather on air traffic management
o Bay Area air traffic management
o Runway capability and limitations
o Runway and taxiway designations explained
• Procedures 101
o Factors that influence the design of flight procedures
o Differences between RNAV and RNP procedures
o Basic building blocks of flight procedures
o Detailed explanation of RNP and RNP-AR approaches
• Codes 101
o Language of Aviation (letters and numbers)
o Airport, airline, aircraft codes, and radio callsigns
o Aircraft registration numbers
11Casper Noise Lab User Manual
February 1, 2021
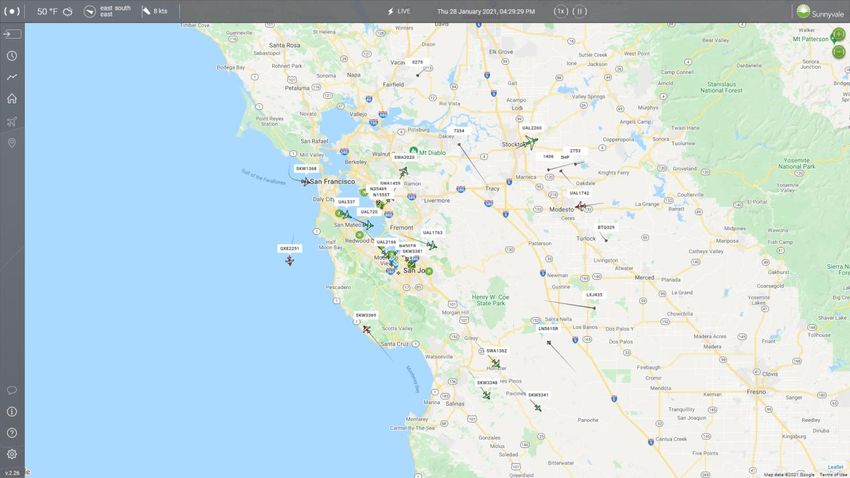
4 Flight Tracker Page
Clicking the Flight Tracker Menu header opens the Casper Flight Tracker
(https://flighttracker.casper.aero/syv) in a new window as shown in Figure 13.
Figure 13 – City of Sunnyvale Casper Flight Tracker
12Casper Noise Lab User Manual
February 1, 2021
5 History Page
Figure 14 – History Data Browser
The History page provides access to the History Data Browser, which allows the user to view aircraft
noise and flight data for either the current day or a fixed historical period. The map highlights the NMT
on the map when selected from the Noise monitor drop-down list, as shown in Figure 14.
Clicking on the icon in the lower left-hand corner of the map allowing the user to change the base
map type. The choices are:
• Google Maps – Google street map
• Google Maps (Satellite) – Google aerial map
• Google Maps (Satellite/Hybrid) – Google aerial map with labels
• Openstreet Map – Openstreet map (default)
Under the map are a series of pull-down menus and checkboxes that allow you to change the data
displayed in the charts below the menu.
The Period selector allows you to choose from the following time ranges: Yesterday, Last week, Last
Month, Last year, and Other. When the Period “Other” is selected the user enters the date range of
interest using the calendar below the period selector.
*Note - when you select an NMT from the drop-down list, only flights correlated to a noise event at that
monitor are displayed in the charts. Due to the flight patterns in use, one or more NMTs may have zero
13Casper Noise Lab User Manual
February 1, 2021
correlated noise events when selecting specific periods such as "Yesterday or Last Week," and some
charts may be blank as a result.
By default, the selected Airport is SJC – San Jose. Selecting a new airport from the drop-down list
displays only arrivals, departures, or terrain (flights with the same arrival and departure airport).
The Location search box uses the Google Address lookup to find a location and display it for visual
reference.
The charts are interactive. Hovering over a particular data slice or bar displays the value represented by
the data grouping. You can also click on a particular entry in the chart legend and remove that entry.
The charts will update automatically to reflect the new data. Click on the directional arrows
to scroll through the available charts.
5.1 Arrivals per Runway Chart
This donut chart displays the percentage of arrivals per runway at the selected airport. If an NMT is
selected, the flight information displayed is limited to situations where the system correlated an aircraft
noise event to the selected noise monitor and airport. With no noise monitor selected, all arrivals for
the chosen airport are displayed regardless of if they generated a noise event.
Figure 15 – Arrivals per Runway Chart
The chart legend denotes the percentage and the total number of arrivals on an individual runway.
5.2 Departures per Runway Chart
This donut chart displays the percentage of departures per runway at the selected airport. If an NMT is
selected, the flight information displayed is limited to situations where the system correlated an aircraft
14Casper Noise Lab User Manual
February 1, 2021
noise event to the selected noise monitor and airport. With no noise monitor selected, all departures
for the chosen airport are displayed regardless of if they generated a noise event.
Figure 16 – Departures per Runway Chart
The chart legend denotes the percentage and the total number of departures on an individual runway.
5.3 Top 5 Noise Events Chart
This chart (Figure 17) displays the Top 5 Noise Events as determined by the Lmax of the event. If no
noise monitor is selected, the chart shows the Top 5 noise events for the selected period across all four
NMTs.
Figure 17 – Top 5 Noise Events Chart
15Casper Noise Lab User Manual
February 1, 2021
The Y-axis labels denote the aircraft type and takeoff/landing runway, while the X-axis indicates the
Lmax value in A-weighted decibels (dBA). The event bars are sorted in descending order by Lmax.
5.4 Flights per Period Chart
This chart compares the number of Takeoff (Outbound) and Landing (Inbound) flights for the selected
airport and the period. In the example below a week’s flights are compared using a stacked column for
each day. The column indicates the ratio between outbound and inbound flights. If no noise monitor is
selected, all fights for the chosen airport are shown regardless of whether they generated a noise event.
Figure 18 – Flights per Period Chart
The Y-axis denotes the number of flights, while the X-axis indicates days, months, or years depending on
the period selected. In the example in Figure 18 with the period set to "Last Week," each column
represents a day.
5.5 Flights per Hour Chart
This chart compares the number of Takeoff (Outbound) and Landing (Inbound) flights for the selected
airport and the period. Flights by hour of the day are compared using a stacked column, which indicates
the ratio between outbound and inbound flights. If no noise monitor is selected, all flights for the
chosen airport are shown regardless of whether they generated a noise event.
16Casper Noise Lab User Manual
February 1, 2021
Figure 19 – Flights per Hour Chart
The Y-axis denotes the number of flights, while the X-axis indicates the hour of the day based on the 24-
hour clock, which is the standard used in Aviation.
*Note: To convert to PM, subtract 12 from any hour past 12:00 noon. For example, 18:30 = 6:30 PM.
17Casper Noise Lab User Manual
February 1, 2021
6 Noise Page
Figure 20 – Noise Data Browser
The Noise page provides access to the Noise Data Browser, which allows the user to view aircraft noise
data for a given month. The Period selector defaults to the current month. The map highlights the NMT
on the map when selected from the Noise monitor drop-down list, as shown in Figure 20.
Clicking on the icon in the lower left-hand corner of the map allowing the user to change the base
map type. The choices are:
• Google Maps – Google street map
• Google Maps (Satellite) – Google aerial map
• Google Maps (Satellite/Hybrid) – Google aerial map with labels
• Openstreet Map – Openstreet map (default)
Under the map are two pull-down menus that allow you to change the data displayed in the charts
below the menu. By default, the selected NMT is SYV-01 Ortega Park. Selecting a new NMT from the
drop-down list displays only correlated aircraft noise events at the chosen location. When you select an
NMT, the details, including the address and a photo, are also displayed.
The Period Selector is a rolling 12 month period, based on the current month. Historical noise data is
only available from November 1, 2020, when the NMTs went live. Months queried before that will
display no data in the charts.
18Casper Noise Lab User Manual
February 1, 2021
The Location search box uses the Google Address lookup to find a location and display it for visual
reference.
The charts are interactive. Hovering over a particular data slice or bar displays the value represented by
the data grouping. You can also click on a particular entry in the chart legend and remove that entry.
The charts will update automatically to reflect the new data. Click on the directional arrows
to scroll through the available charts.
6.1 Aircraft Noise Events per Period Chart
This chart displays the number of correlated aircraft noise events during the selected month at the
chosen NMT as shown in Figure 21.
Figure 21 – Aircraft Noise Events per Period
The Y-axis denotes the number of aircraft noise events, while the X-axis indicates the day of the month.
6.2 Average Aircraft Noise Events per Hour Chart
This chart displays the average number of aircraft noise events (ACNE) per hour over the selected month
at the chosen NMT.
19Casper Noise Lab User Manual
February 1, 2021
Figure 22 – Average Aircraft Noise Events per Hour Chart
The Y-axis denotes the average number of aircraft noise events, while the X-axis indicates the hour of
the day.
6.3 Top Aircraft Noise Events (max dBA) Chart
This chart displays the Top 10 aircraft noise events ranked by Lmax in A-weighted decibels (dBA) at the
selected NMT.
Figure 23 – Top Aircraft Noise Events (max dBA) Chart
The Y-axis denotes the Lmax in A-weighted decibels, while the X-axis depicts the events in descending
order by Lmax from left to right. The individual bars are color-coded based on the Lmax value range, as
shown in the key. The X-axis labels display the event's date, and aircraft type.
20Casper Noise Lab User Manual
February 1, 2021
6.4 Aircraft Noise Events Chart
This chart displays the number of aircraft noise events per day at the selected NMT.
Figure 24 – Aircraft Noise Events Chart
The Y-axis denotes the number of aircraft noise events (ACNE), while the X-axis indicates the day of the
month.
21Casper Noise Lab User Manual
February 1, 2021
7 Traffic Page
Figure 25 – Traffic Data Browser
The Traffic page provides access to the Traffic Data Browser, which allows the user to view aircraft flight
track data for a given month. The Period selector defaults to the current month. A density (heat map)
overlays the map highlighting the predominant flight paths for the selected airport and operation mode
(Arrivals or Departures) during the chosen month, as shown in Figure 25.
The heat map is calculated based on a fixed grid that is overlayed on a map. The Casper NOMS system
calculates the number of flights that passed through each equal-sized grid square. A color is then
applied to the grid square based on the volume of flights compared to other squares. The color
assignment is determined based on pre-determined buckets, as shown in the Map Legend in Figure 26.
Figure 26 – Heat Map Legend
Clicking on the icon in the lower left-hand corner of the map allowing the user to change the base
map type.
22Casper Noise Lab User Manual
February 1, 2021
• Google Maps – Google street map
• Google Maps (Satellite) – Google aerial map
• Google Maps (Satellite/Hybrid) – Google aerial map with labels
• Openstreet Map – Openstreet map (default)
The user can also activate one or multiple zip code (94085, 94086, 94087, 94089) map overlays.
Under the map are several pull-down menus that allow you to change the map and chart data displayed.
By default, the page displays Arrivals for the current month at SJC- San Jose Airport. Changing the
Traffic Direction, Period, and or airport alters the display of the page's data.
The Period Selector is a rolling 12 month period, based on the current month. Historical flight track data
is available from January 1, 2020, when Casper turned on Sunnyvale's flight track data feed.
The Location search box uses the Google Address lookup to find a location and display it for visual
reference.
The charts are interactive. Hovering over a particular data slice or bar displays the value represented by
the data grouping. You can also click on a particular entry in the chart legend and remove that entry.
The charts will update automatically to reflect the new data. Click on the directional arrows
to scroll through the available charts.
7.1 Arrivals per Runway (Day) Chart
This chart compares the number of Arrivals per runway during daytime hours (defined by the FAA as
07:00-22:00) at the selected airport. A single day's flights are compared using a stacked column, which
indicates the distribution of flights by arrival runway at the selected airport over the chosen month.
Figure 27 – Arrivals per Runway (Day) Chart
23Casper Noise Lab User Manual
February 1, 2021
The Y-axis denotes the number of daytime arrivals, while the X-axis indicates the day of the month. The
chart key is color-coded by arrival runway in number order at the selected airport.
7.2 Arrivals per Runway (Night) Chart
This chart compares the number of Arrivals per runway during nighttime hours (defined by the FAA as
22:00-07:00) at the selected airport. A single day's flights are compared using a stacked column, which
indicates the distribution of flights by arrival runway at the selected airport over the chosen month.
Figure 28 – Arrivals per Runway (Night) Chart
The Y-axis denotes the number of nighttime arrivals, while the X-axis indicates the day of the month.
The chart key is color-coded by arrival runway in number order at the selected airport.
7.3 Departures per Runway (Day) Chart
This chart compares the number of Departures per runway during daytime hours (defined by the FAA as
07:00-22:00) at the selected airport. A single day's flights are compared using a stacked column, which
indicates the distribution of flights by departure runway at the selected airport over the chosen month.
24Casper Noise Lab User Manual
February 1, 2021
Figure 29 – Departures per Runway (Day) Chart
The Y-axis denotes the number of daytime departures, while the X-axis indicates the day of the month.
The chart key is color-coded by departure runway in number order at the selected airport.
7.4 Departure per Runway (Night) Chart
This chart compares the number of Departures per runway during nighttime hours (defined by the FAA
as 22:00-07:00) at the selected airport. A single day's flights are compared using a stacked column,
which indicates the distribution of flights by departure runway at the selected airport over the chosen
month.
Figure 30 – Departures per Runway (Night) Chart
25Casper Noise Lab User Manual
February 1, 2021
The Y-axis denotes the number of nighttime departures, while the X-axis indicates the day of the month.
The chart key is color-coded by departure runway in number order at the selected airport.
26Casper Noise Lab User Manual
February 1, 2021
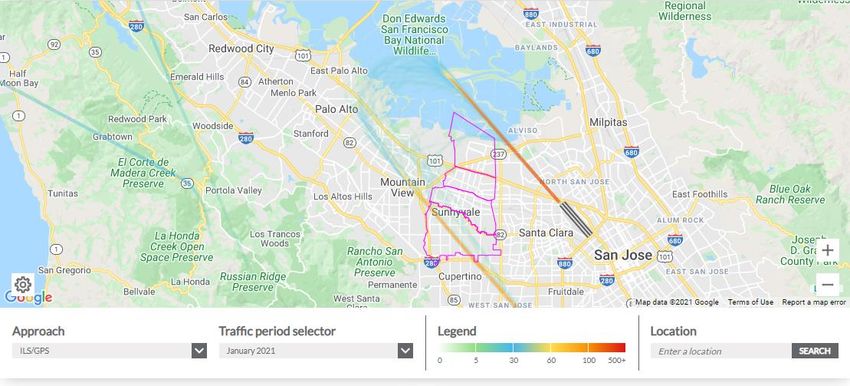
8 South Flow Page
Figure 31 – South Flow Data Browser
The South Flow page provides access to the South Flow Data Browser, which allows the user to view
aircraft flight track data associated with South Flow Arrivals at KSJC Airport for a given month. Note only
jet aircraft are included in the data as most turboprop and all piston-powered aircraft are not authorized
to fly the RNP Z Approach.
The Approach selector allows you to choose what type of landing pattern you wish to view data on. The
two South Flow Approach procedures that most affect Sunnyvale are discussed in detail on the South
Flow 101 page under the Education menu covered in Section 3.
A density (heat map) overlays the map highlighting flight track concentration areas over the City for the
selected approach type during the chosen month, as shown in Figure 31.
The heat map is calculated based on a fixed grid that is overlayed on a map. The Casper NOMS system
calculates the number of flights that passed through each equal-sized grid square. A color is then
applied to the grid square based on the volume of flights compared to other squares. The color
assignment is determined based on pre-determined buckets, as shown in the Map Legend in Figure 32.
Figure 32 – Heat Map Legend
27Casper Noise Lab User Manual
February 1, 2021
Clicking on the icon in the lower left-hand corner of the map allowing the user to change the base
map type.
• Google Maps – Google street map
• Google Maps (Satellite) – Google aerial map
• Google Maps (Satellite/Hybrid) – Google aerial map with labels
• Openstreet Map – Openstreet map (default)
The user can also activate one or multiple zip code (94085, 94086, 94087, 94089) map overlays.
Under the map are two pull-down menus that allow you to change the map and chart data displayed.
By default, the page displays ILS/GPS Arrivals for the current month at SJC- San Jose Airport. Changing
the approach type alters the map display, while selecting a different period alters the charts.
The Period Selector is a rolling 12 month period, based on the current month. Historical flight track data
is available from January 1, 2020, when Casper turned on Sunnyvale's flight track data feed.
The Location search box uses the Google Address lookup to find a location and display it for visual
reference.
The charts are interactive. Hovering over a particular data slice or bar displays the value represented by
the data grouping. You can also click on a particular entry in the chart legend and remove that entry.
The charts will update automatically to reflect the new data. Click on the directional arrows
to scroll through the available charts.
8.1 Aircraft Noise Events (Max dBA) RNP Approach Chart
This chart compares the number of aircraft noise events by Lmax in A-weighted decibels (dBA) grouped
into buckets of 5 dBA. The chart only includes noise event data for flights that flew the RNP Z approach
to Runway 12L or 12R at SJC Airport. Note some flights may have generated noise events at more than
one NMT.
28Casper Noise Lab User Manual
February 1, 2021
Figure 33 – Aircraft noise Events (Max dBA) RNP Approach Chart
The Y-axis denotes the number of aircraft noise events, while the X-axis depicts the Lmax in A-weighted
decibels (dBA) grouped into buckets of 5 dBA. Each column is colored differently based on the decibel
bucket represented.
8.2 Aircraft Noise Events (Max dBA) non-RNP Approach Chart
This chart compares the number of aircraft noise events by Lmax in A-weighted decibels (dBA) grouped
into buckets of 5 dBA. The chart only includes noise event data for flights that flew the ILS/GPS
approach to Runway 12L or 12R at SJC Airport. Note some flights may have generated noise events at
more than one NMT.
Figure 34 – Aircraft Noise Events (Max dBA) non-RNP Approach Chart
29Casper Noise Lab User Manual
February 1, 2021
The Y-axis denotes the number of aircraft noise events, while the X-axis depicts the Lmax in A-weighted
decibels (dBA) grouped into buckets of 5 dBA. Each column is colored differently based on the decibel
bucket represented.
8.3 Jet Arrivals per Approach
This donut chart displays the percentage of flights that flew a particular South Flow approach procedure
when landing at SJC Airport.
Figure 35 – Jet Arrivals per STAR Chart
The chart legend denotes the percentage and the total number of each approach type flown in South
Flow during the chosen month. Each procedure type is assigned a different color.
8.4 Altitude Chart
This chart compares individual aircraft's altitude that flew through the RWY 12L-12R Downwind Gate,
which intersects the ZORSA waypoint on the RNP Z 12L and 12R approach to SJC Airport. The gate
captures both ILS/GPS and RNP approaches to Runway 12L and 12R, in which the aircraft overflew the
City of Sunnyvale.
Each dot on the scatter plot indicates the penetration altitude of a single flight during the chosen
month. The dots' distribution shows you the altitude and position left or right of the gate centerline.
The chart makes it easy to determine concentration areas and highlights flights outside the typical
approach pattern parameters.
30Casper Noise Lab User Manual
February 1, 2021
Figure 36 – Approach Altitude Scatter Plot Chart
The Y-axis denotes the penetration altitude in thousands of feet, while the X-axis depicts the
penetration distance in thousands of feet left (negative) or right (positive) of the center point of the
gate. Note a mile is equal to 5,280 feet.
8.5 Flights per Aircraft Type Chart
This chart displays the most frequent aircraft types to fly the RNP Z Approach to Runway 12L or 12R at
SJC Airport for the chosen month.
Figure 37 – Flights per Aircraft Type Chart
The Y-axis labels denote the aircraft type, while the X-axis indicates the number of RNP approaches
flown. The bars are sorted in descending order from top to bottom.
31Casper Noise Lab User Manual
February 1, 2021
8.6 Flights per Airline Chart
This chart displays the most frequent airlines to fly the RNP Z Approach to Runway 12L or 12R at SJC
Airport for the chosen month.
Figure 38 – Flights per Airline Chart
The Y-axis labels denote the airline, while the X-axis indicates the number of RNP approaches flown. The
bars are sorted in descending order from top to bottom.
32Casper Noise Lab User Manual
February 1, 2021
9 Report Pages
The Report pages provide access to a series of Excel reports that can be downloaded by users. Each
report covers a specific area of interest as identified by the City. The included reports are:
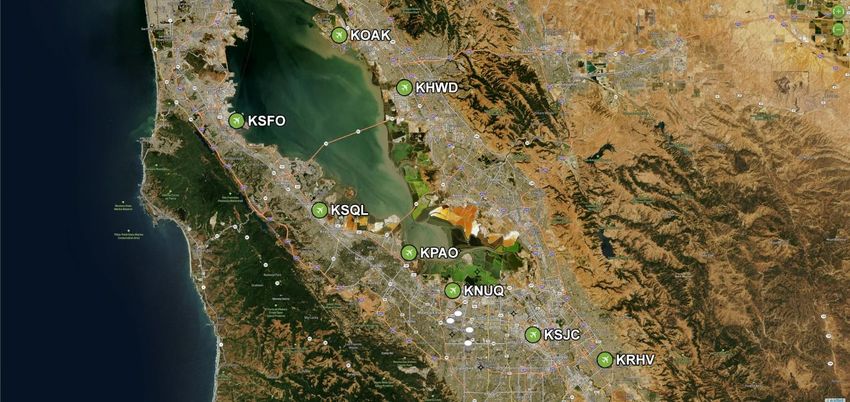
9.1 Sunnyvale Overflight Data Report
This monthly report includes information on all flights that overflew the City of Sunnyvale during a given
month arriving or departing from one of the eight local Bay Area airports of interest, as shown in Figure
39. Note this report doesn't include noise data. For details about the specific fields included in the
report, please see the dedicated report page on the website.
Figure 39 – Map showing Bay Area Airports of Interest
1. KRHV – Reid-Hillview Airport of Santa Clara County
2. KSJC – Norman Y Mineta San Jose International Airport
3. KNUQ – Moffett Federal Airfield
4. KPAO – Palo Alto Airport
5. KSQL – San Carlos Airport
6. KSFO – San Francisco International Airport
7. KOAK – Metro Oakland International Airport
8. KHWD – Hayward Executive Airport
9.2 SJC South Flow Data Report
This monthly report includes information on all south flow jet arrivals that generated at least one noise
event at one of the four City-owned NMTs.
33Casper Noise Lab User Manual
February 1, 2021
Figure 40 – Map Depicting SJC South Flow Approaches that Overflew Sunnyvale
The report breaks out flights by the approach procedure flown to allow for comparison. The altitude
reported is when the aircraft was closest to the NMT that recorded the aircraft noise event. The noise
level reported is the Lmax in A-weighted decibels (dBA) recorded for each flight. For details about the
specific fields included in the report, please see the dedicated report page on the website.
9.3 Raw Noise Data Report
This weekly report is a raw dump of the 1-second noise data from each of the City's four NMTs. The
data isn't correlated to aircraft overflights, and no attempt is made to associate a source (aircraft or
community) to the noise level recorded. For details about the specific fields included in the report,
please see the dedicated report page on the website.
Figure 41 – Raw Noise Data Report Snapshot
34Casper Noise Lab User Manual
February 1, 2021
10 Updates Page
Figure 42 – Sample News Items on the Updates Page
The Updates page provides access to news items issued by the City of Sunnyvale concerning aircraft
noise. The page displays all current and archived news items. It will not display any news items with a
future publication date. Selecting the SHOW ALL entry displays all news items available on the website.
Select the arrow to the right of the news item to expand it and view the full text.
35Casper Noise Lab User Manual
February 1, 2021
11 Complaints Page
The Complaints page provides users with information on how to file an aircraft noise complaint. Note
the City of Sunnyvale does not accept aircraft noise complaints. Instead, it directs residents to submit
their complaints directly to the airport authority.
As explained on the page, the airport responsible for the aircraft noise event can be determined using
the City's Casper Public Flight Tracker. The page includes links to each airport's noise website from
which residents can submit their complaints.
The FAA's Northern California Aviation Noise Ombudsman's contact email and phone number are also
listed. This information changes regularly, and updated contact information can be found at
https://www.faa.gov/noise/inquiries/
Region State Name Email Telephone
Western-Pacific California (Northern) Sky Laron 9-awp-noise@faa.gov 424-405-8020
36Casper Noise Lab User Manual
February 1, 2021
12 Return to Sunnyvale
Clicking on this menu item opens up the City of Sunnyvale's website in a new browser window.
Figure 43 – City of Sunnyvale's Website
37You can also read