January 2021 - Southwest Florida Regional Economic Indicators - Regional Economic Research Institute
←
→
Page content transcription
If your browser does not render page correctly, please read the page content below
Southwest Florida
         Regional Economic
             Indicators

              January 2021
              VOLUME XV NUMBER 1

                             Lutgert College of Business
Regional Economic            10501 FGCU Blvd. South
                             Fort Myers, FL 33965
Research Institute           Phone 239-590-7370
                             fgcu.edu/cob/reri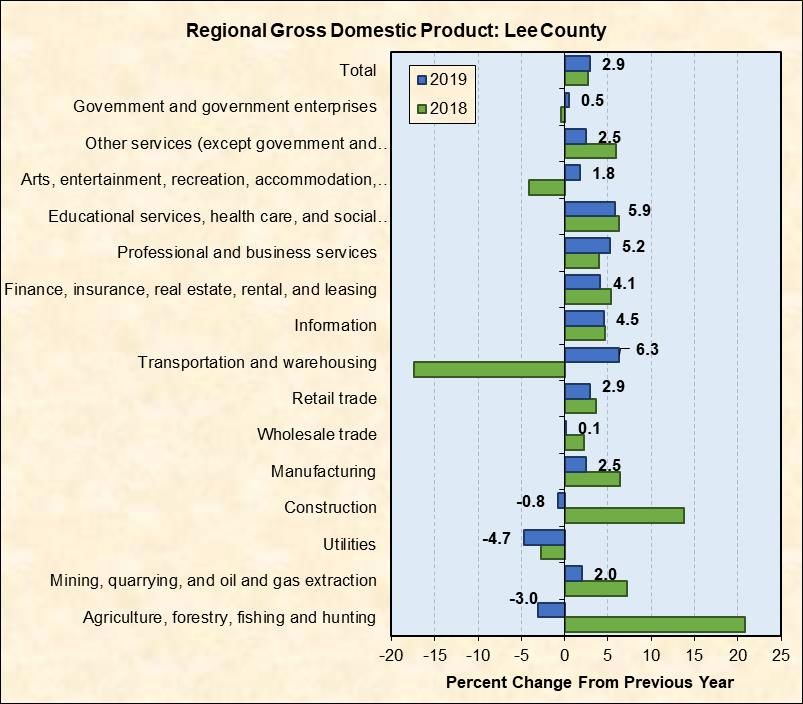
Table of Contents
Introduction: Regional and National Background ........................................................................................................4
Airport Passenger Activity .............................................................................................................................................5
    Chart 1: SW Florida International Passenger Activity...............................................................................................5
    Chart 2: Punta Gorda Airport Passenger Activity .....................................................................................................6
    Chart 3: Sarasota Airport Passenger Activity ............................................................................................................6
Tourist Tax Revenues .....................................................................................................................................................7
    Chart 4: Tourist Tax Revenues for the Coastal Counties ..........................................................................................7
    Chart 5: Coastal County Tourist Tax Revenues .........................................................................................................8
Taxable Sales .................................................................................................................................................................8
    Chart 6: Taxable Sales for 5 County Region ..............................................................................................................9
    Chart 7: Taxable Sales for Coastal Counties .............................................................................................................9
    Chart 8: Taxable Sales for Inland Counties .............................................................................................................10
Workforce – Labor Force, Employment and Unemployment......................................................................................10
    Chart 9: Lee County Labor Force and Unemployment ...........................................................................................11
    Chart 10: Collier County Labor Force and Unemployment ....................................................................................12
    Chart 11: Charlotte County Labor Force and Unemployment................................................................................12
    Chart 12: Hendry County Labor Force and Unemployment ...................................................................................13
    Chart 13: Glades County Labor Force and Unemployment ....................................................................................13
Single-Family Building Permits ....................................................................................................................................14
    Chart 14: Single-Family Building Permits for Lee County ........................................................................................14
    Chart 15: Single-Family Building Permits for Collier County ..................................................................................15
    Chart 16: Single-Family Building Permits for Charlotte County .............................................................................15
Existing Single–Family Home Sales and Median Prices ...............................................................................................16
    Chart 17: Existing Single-Family Home Sales for Lee County .................................................................................16
    Chart 18: Existing Single-Family Home Sales for Collier County .............................................................................17
    Chart 19: Existing Single-Family Home Sales for Charlotte County .........................................................................17
Realtor® Active Listings ................................................................................................................................................18
    Chart 20: Active Listings for Lee County .................................................................................................................18
    Chart 21: Active Listings for Collier County ............................................................................................................19
    Chart 22: Active Listings for Charlotte County ........................................................................................................19

                                                                                       2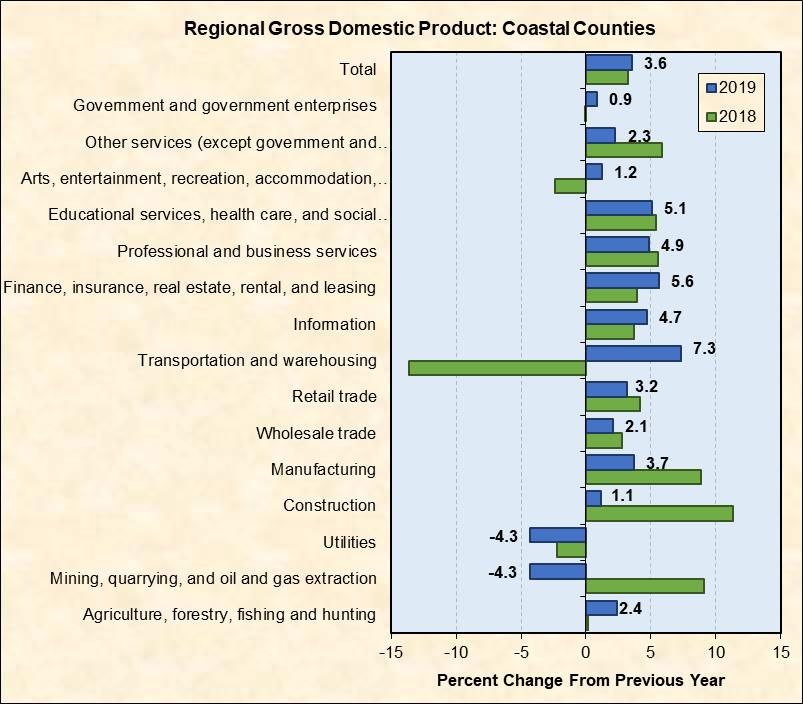
Consumer Sentiment Index .........................................................................................................................................20
    Chart 23: U.S. Index of Consumer Sentiment .........................................................................................................21
    Chart 24: Florida Consumer Sentiment Index .........................................................................................................21
Consumer Price Index ..................................................................................................................................................22
    Chart 25: CPI Annual Percentage Change...............................................................................................................22
    Chart 26: Miami-Fort Lauderdale CPI Component Percentage Change .................................................................23
Appendix ......................................................................................................................................................................23
    Chart A1: Coastal Counties Population, 1990 to 2045 ...........................................................................................24
    Chart A2: Inland Counties Population, 1990 to 2045 .............................................................................................25
    Chart A3: Historic and Projected GDP Growth, 2009 to Long Run .........................................................................26
    Chart A4: Historic and Projected Unemployment, 2009 to Long Run ....................................................................27
    Chart A5: Regional Gross Domestic Product for Coastal Counties ..........................................................................28
    Chart A6: Regional Gross Domestic Product for Lee County ...................................................................................29
    Chart A7: Regional Gross Domestic Product for Collier County ..............................................................................30
    Chart A8: Regional Gross Domestic Product for Charlotte County .........................................................................31
    Chart A9: Industry Diversification Index, 2005 to 2020 ..........................................................................................32

Regional Economic Indicators is published monthly by the staff and students of the Regional
Economic Research Institute at Florida Gulf Coast University.

              Dr. Amir B. Ferreira Neto, Interim Director, Regional Economic Research Institute
                        Phone: 239-590-7370 Email: aborgesferreiraneto@fgcu.edu
                Mr. Jim Breitbach, Technical Support, Regional Economic Research Institute
                                           Email: jbreitba@fgcu.edu
                Mr. John Shannon, Senior Economist, Regional Economic Research Institute
                             Phone: 239-590-1430 Email: jmshannon@fgcu.edu

                                                                        RERI Students
                                                                           Alia Judd
                                                                    Roxana Ruiz Rodriguez
                                                                         Jaime Wood

                                                          Copyright © 2020 FGCU - All rights reserved.

                                                                                        3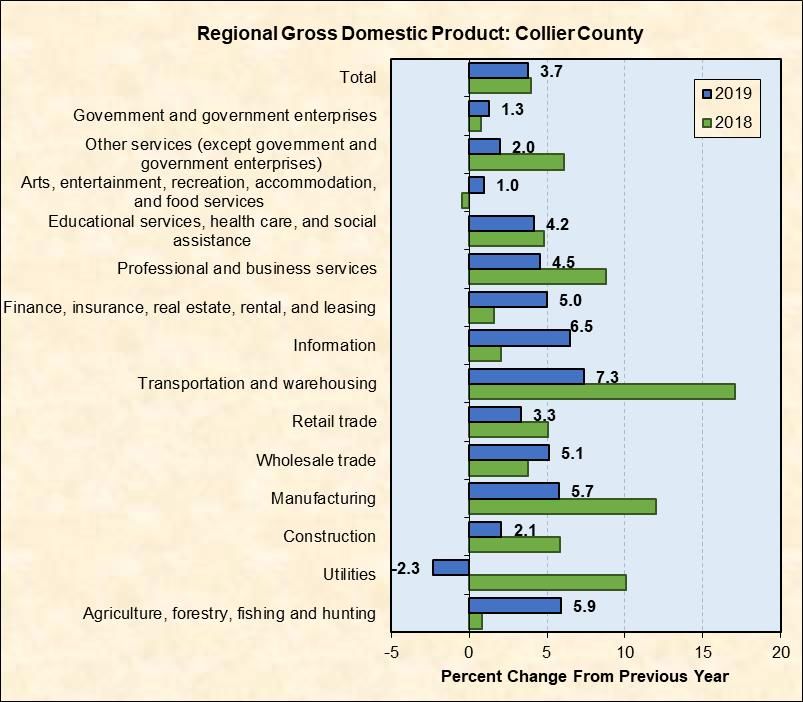
Introduction: Regional and National Background
The latest economic indicators continued to show mixed results for the Southwest Florida
economy, as some indicators improved while others declined. Despite positive news this month
with the production of a COVID-19 vaccine, uncertainty continues to persist as cases in the state
continue to rise.
Unemployment rates tend to be meaningful indicators. The seasonally-adjusted unemployment
rate for the region edged up to 6.1 percent in November 2020, up 0.7 percentage points from
October 2020, and 2.8 percentage points above the November 2019 figure. The number
unemployed in November 2020 increased by 17,048 from November 2019, and by 3,973 over
October 2020.
Real estate indicators continued to be a bright spot for the region. Single-family building permits
for the coastal counties improved 22 percent from November 2019 to November 2020. Single-
family home sales improved 43 percent in November 2020 over November 2019. Median prices
for all three counties also increased by 12 to 26 percent in November 2020 compared to
November 2019.
Other indicators provided some mixed results for the hospitality and tourism economy:
Airport passenger activity for November 2020 increased by 11 percent over October 2020,
following the traditional seasonal pattern, but was 41 percent below the total for
November 2019;
October 2020 seasonally-adjusted tourist tax revenues were 5 percent lower than
October 2019, as well as 14 percent below the September 2020 total;
Seasonally-adjusted taxable sales rose 7 percent in September 2020 compared to
September 2019.
Finally, beginning in January 2021, the RERI will begin tracking Realtor® active listings for the
Southwest Florida coastal counties. Active listings for the coastal counties were down in
November 2020, falling 39 percent from November 2019.
The RERI staff extends its sincere thanks and appreciation to the dedicated individuals and
organizations which make this report possible. They include FGCU student workers affiliated with
the RERI, the Southwest Florida Regional Planning Council, the individual economic development
organizations in Charlotte, Collier, and Lee counties, the convention and visitors’ bureaus in
Charlotte, Collier and Lee counties, the regional airport authorities, the Realtors® of Collier, Lee,
and Charlotte counties, the University of Florida Survey Research Center, and the county and city
permit offices.
Reader comments or suggestions to enhance the usefulness of this report are always welcome.
Please email them to RERI Senior Economist John Shannon at reri@fgcu.edu. Stay well, and please
observe masking and distancing guidelines in order to save lives.
4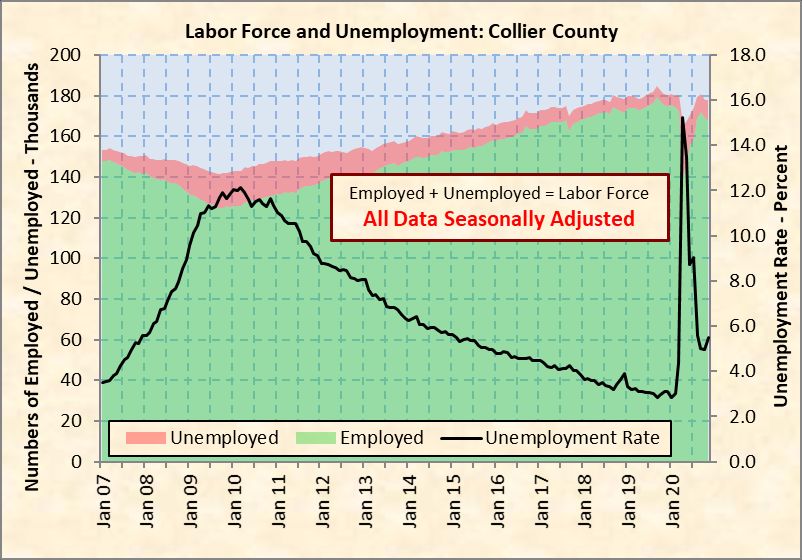
Airport Passenger Activity

Airport passenger activity is the sum of arrivals and departures for Southwest Florida International
(RSW), Sarasota Bradenton International (SRQ), and Punta Gorda (PGD) airports. Peak seasonal
activity usually occurs in February, March, and April, with significantly lower activity in the summer
months. Charts 1, 2, and 3 illustrate the historic seasonality as well as the changes from year to
year.

As noted in previous reports, the COVID-19 pandemic is keeping both Floridians and non-
Floridians at home. Total passenger traffic for the three airports amounted to 702,369 in
November 2020, down 41 percent from November 2019, and up 11 percent over October 2020
following the seasonal pattern. While all three airports continue to improve from the dip in
passenger activity experienced in April, a complete recovery to pre-pandemic levels is not
anticipated in the short-term.

The charts’ fishhook patterns that began in April 2020 now better reflect the historic seasonal
pattern, albeit at a reduced level. Passenger traffic at RSW was 500,468 in November 2020, down
43 percent from November 2019, but 20 percent greater than October 2020 (see Chart 1). PGD’s
passenger activity amounted to 95,706 in November 2020, a decrease of 27 percent from
November 2019, as well as 9 percent below October 2020 (see Chart 2). Sarasota Bradenton
served 106,195 passengers in November 2020, a 42-percent decrease from November 2019 and
4-percent decline from October 2020.

                                                        Chart 1: SW Florida International Passenger Activity
                                                                SW Florida International Airport (RSW) Passenger Activity

                                                1,600
                                                                                          2020
         Arrivals plus Departures - Thousands

                                                1,400
                                                                                          2019

                                                1,200                                     2018
                                                                                          2017
                                                1,000

                                                 800

                                                 600

                                                 400

                                                 200

                                                   0
                                                         Jan   Feb   Mar   Apr   May   Jun    Jul   Aug   Sep   Oct   Nov   Dec

        Source: Local Airport Authorities

                                                                                         5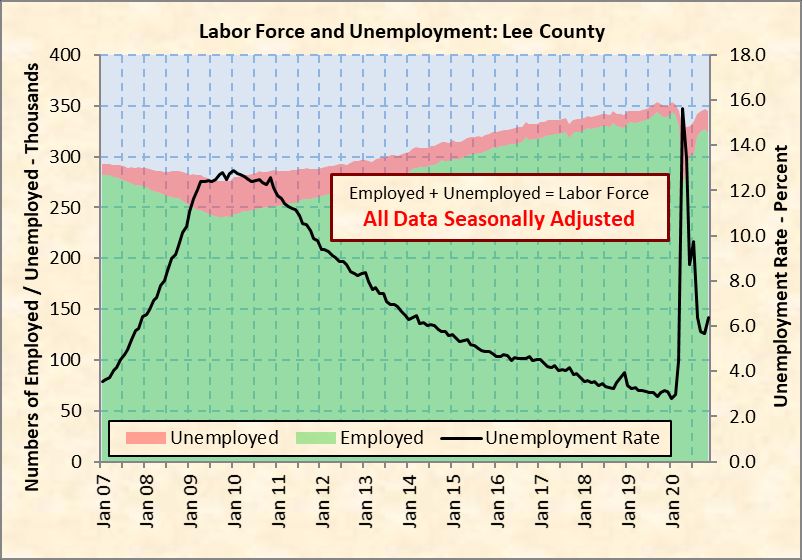
Chart 2: Punta Gorda Airport Passenger Activity
                                                                            Punta Gorda Airport (PGD) Passenger Activity
                                                  225
                                                                                                                    2020
                                                  200
                                                                                                                    2019
  Arrivals plus Departures - Thousands

                                                             2020                                                   2018
                                                  175
                                                                                                                    2017
                                                  150
                                                             2019

                                                  125             2018

                                                  100               2017

                                                  75

                                                  50

                                                  25

                                                   0
                                                            Jan     Feb         Mar   Apr   May   Jun   Jul   Aug   Sep    Oct    Nov      Dec

Source: Local Airport Authorities

                                                              Chart 3: Sarasota Airport Passenger Activity
                                                                   Sarasota Bradenton Int'l Airport (SRQ) Passenger Activity
                                                   250

                                                   225
           Arrivals plus Departures - Thousands

                                                                         2020                                                    2019
                                                   200

                                                   175

                                                   150
                                                                                                                                  2018

                                                   125

                                                   100
                                                                                                                                        2017
                                                    75

                                                    50

                                                    25

                                                        0
                                                            Jan      Feb        Mar   Apr   May   Jun   Jul   Aug   Sep    Oct   Nov      Dec

 Source: Local Airport Authorities

                                                                                                   6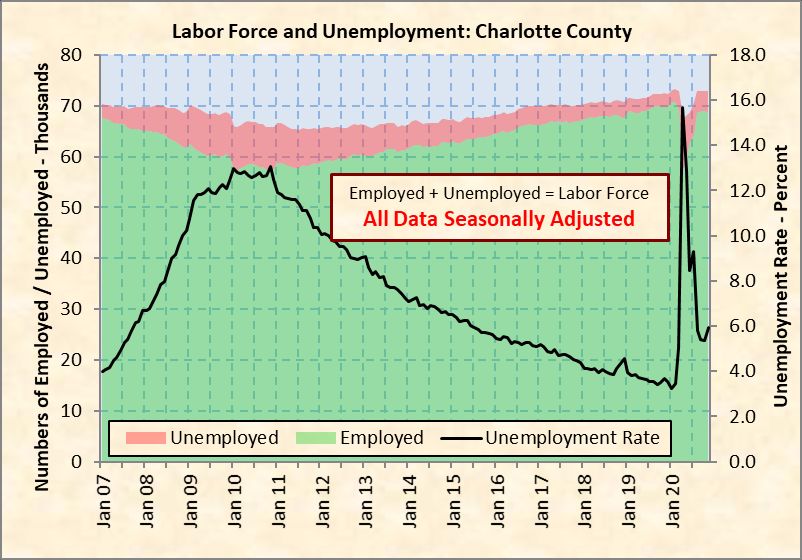
Tourist Tax Revenues

Charts 4 and 5 show seasonally-adjusted tourist tax revenues by month of occupancy. Revenues
for the coastal counties decreased to $6.31 million in October 2020 from $7.35 million in
September 2020. Revenues were also more than $363 thousand (5 percent) behind October 2019.

Lee County’s seasonally-adjusted tourist tax revenues for October 2020 improved to $3.76 million,
up 3 percent from October 2019, but 12-percent lower than September 2020. Collier County’s
tourist tax revenues amounted to $2.23 million in October 2020, down 15 percent compared to
October 2019, and 20-percent below the September 2020 figure. Seasonally-adjusted tourist tax
revenues in Charlotte County declined to $299 thousand in October 2020, a decrease of 25 percent
from October 2019 and a decline of 17 percent from September 2020.

                                                    Chart 4: Tourist Tax Revenues for the Coastal Counties
                                                         Tourist Tax Revenue 2015 to Present: 3 Coastal Counties Total
                                                    18
                                                              Unadjusted Data
                                                    16
            Monthly Tourst Tax Revenue - Millions

                                                              Seasonally Adjusted (SA) Data

                                                    14

                                                    12

                                                    10

                                                    8

                                                    6

                                                    4

                                                    2

                                                    0
                                                    Jan-15     Jan-16       Jan-17         Jan-18   Jan-19    Jan-20

         Source: Local County Tourism, Tax, and Economic Development Reports

                                                                                       7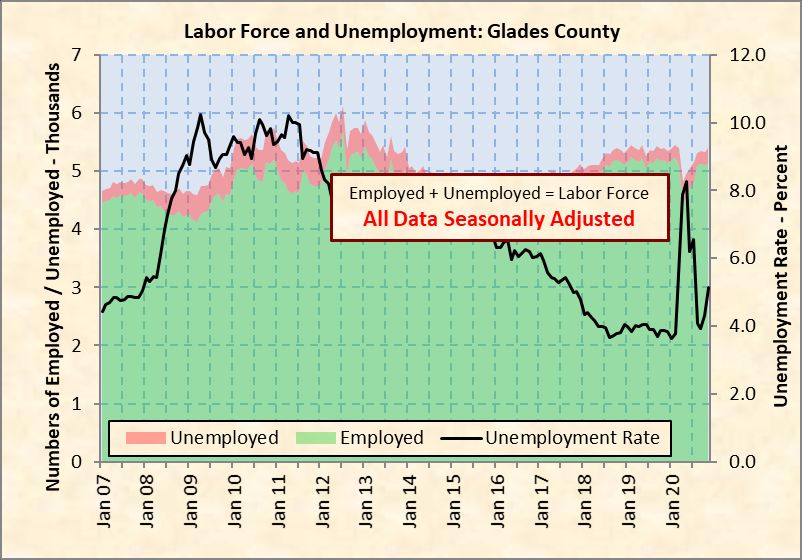
Chart 5: Coastal County Tourist Tax Revenues
                                                                    County Tourist Tax Revenue - 2015 to present
                                                     5.0

          Monthly Tourist Tax Revenue - $ Millions   4.5

                                                     4.0                     Lee
                                                     3.5

                                                     3.0

                                                     2.5                 Collier
                                                     2.0

                                                     1.5

                                                     1.0

                                                     0.5                  Charlotte

                                                     0.0
                                                       Jan-15          Jan-16          Jan-17            Jan-18         Jan-19          Jan-20
                                                     Source: Local County Tourism, Tax, and Economic Development Reports and seasonal adjustment by RERI

Taxable Sales

Taxable sales data track consumer spending based on the latest month of merchant collections.
Data lag one month behind the Florida Department of Revenue’s reporting month and are now
available through September 2020.

Seasonally-adjusted taxable sales for Southwest Florida edged up to $2.716 billion in September
2020, an increase of 7 percent from September 2019 and 9 percent higher than August 2020 (see
Chart 6).

Results for the coastal and inland counties are shown in Charts 7 and 8, respectively. Lee County’s
seasonally-adjusted taxable sales were $1.466 billion in September 2020, an increase of 7 percent
over September 2019, and 8 percent over August 2020. Collier County taxable sales rose to $944.6
million in September 2020, up 14 percent from August 2020, and 9 percent over the September
2019 total. Taxable sales in Charlotte County increased to $271.7 million in September 2020,
compared to $263.9 million in September 2019 and to $257.1 million in August 2020.

Taxable sales in Hendry County declined to $32 million in September 2020, down 5 percent from
September 2019 and 12 percent below August 2020. Glades County taxable sales were $5.5
million in September 2020, up 4 percent from August 2020, but 4 percent below the September
2019 total. All cited data are seasonally adjusted.

                                                                                                     8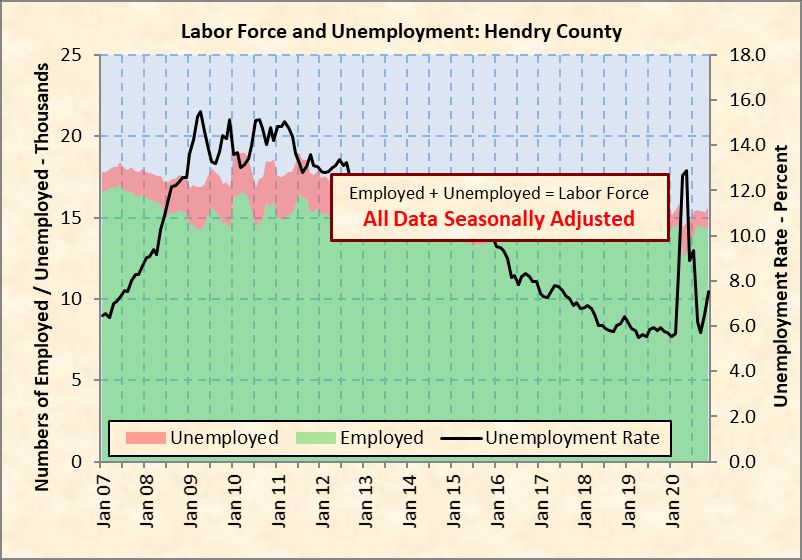
Based on the data, taxable sales for the coastal counties (Lee, Collier, and Charlotte) fared better
than those of the inland counties in the month of September 2020. Despite the continued impact
of the COVID-19 pandemic, most counties, except for Hendry County, saw improvement in their
consumer spending in September 2020 when compared to August 2020.

                           Chart 6: Taxable Sales for 5 County Region

            Source: Florida Department of Revenue, Office of Tax Research

                           Chart 7: Taxable Sales for Coastal Counties

           Source: Florida Department of Revenue, Office of Tax Research

                                                                9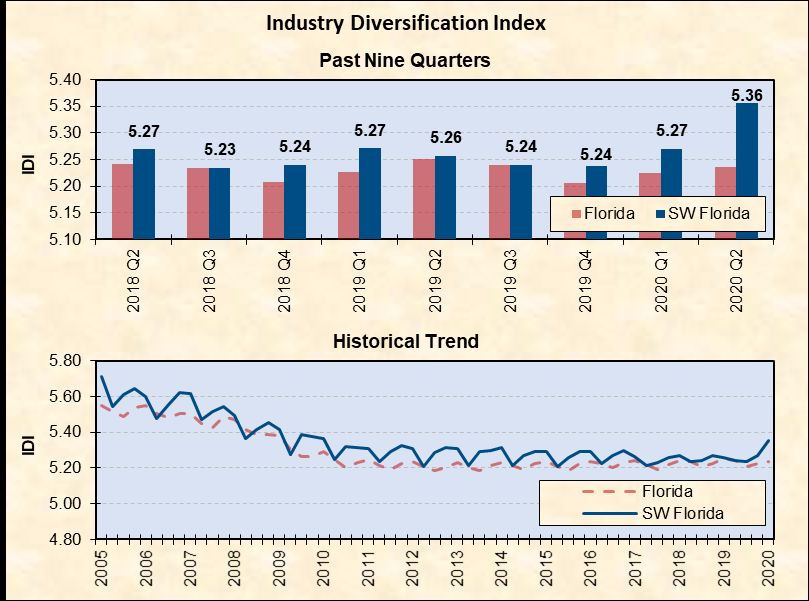
Chart 8: Taxable Sales for Inland Counties

           Source: Florida Department of Revenue, Office of Tax Research

Workforce – Labor Force, Employment and Unemployment
Charts 9-13 show total persons employed and unemployed, and the resulting unemployment
rates seasonally adjusted by the RERI, for each county from January 2007 through November
2020. The Southwest Florida region experienced a month-to-month increase in unemployment
rates in November 2020, with the number of employed persons in the region falling by 5,864,
while the number of unemployed increased by 3,973. The region’s seasonally-adjusted
unemployment rate inched up to 6.1 percent in November 2020, up from a restated 5.4 percent
in the prior month, and well below the figures for the state and the nation. Compared to a year
ago, the seasonally-adjusted number of employed workers is down by 25,295, while the number
of unemployed were 17,048 higher. The total labor force declined by 8,247 from November 2019
to November 2020, mainly in Collier and Lee counties.

Lee County’s seasonally-adjusted unemployment rate rose from 5.7 percent in October 2020 to
6.4 percent in November 2020, compared to 3.2 percent in November 2019 (Chart 9). Lee’s
employment fell by 4,374 from the prior month, while unemployment increased by 2,328. Collier
County’s unemployment rate rose from 3.1 percent in November 2019 to 5.0 percent in October
2020 and to 5.5 percent in November 2020 (Chart 10). Charlotte County’s unemployment rate
was 6.0 percent in November 2020, up 0.7 percent from the previous month, and 2.3 percent
higher than November 2019 (Chart 11).

Hendry’s unemployment rate has gone from 5.7 percent in November 2019 to 6.5 percent in
October 2020 to 7.5 percent in November 2020, as depicted in Chart 12. The corresponding
                                                              10
figures for Glades County are 3.9 percent in November 2019, 4.3 percent in October 2020, and
5.1 percent in November 2020 (Chart 13). Both inland counties show only modest changes in
workforce size.
The State of Florida’s seasonally adjusted unemployment rate was 6.4 percent in November
2020, unchanged from the revised October 2020 rate, and up 3.6 percentage points from
November 2019. The United States unemployment rate was 6.7 percent in November 2020, up
from 3.5 percent in November 2019, but showing improvement from the revised 6.9 percent
figure for October 2020.
Chart 9: Lee County Labor Force and Unemployment
Source: Florida Department of Economic Opportunity and seasonal adjustment by RERI
11Chart 10: Collier County Labor Force and Unemployment
Source: Florida Department of Economic Opportunity and seasonal adjustment by RERI
Chart 11: Charlotte County Labor Force and Unemployment
Source: Florida Department of Economic Opportunity and seasonal adjustment by RERI
12Chart 12: Hendry County Labor Force and Unemployment
Source: Florida Department of Economic Opportunity and seasonal adjustment by RERI
Chart 13: Glades County Labor Force and Unemployment
Source: Florida Department of Economic Opportunity and seasonal adjustment by RERI
13Single-Family Building Permits
The Southwest Florida coastal counties issued 1,059 single-family building permits in November
2020, an increase of 191 permits (22 percent) over November 2019, but down 247 from October
2020. Lee County issued 645 permits in November 2020, up from 468 in November 2019, but
fewer than the 716 permits issued in October 2020 (Chart 14). In Collier County, 244 permits were
issued in November 2020, an increase of nine permits from November 2019 and 108 fewer than
October 2020 (see Chart 15). Charlotte County recorded 170 permits issued in November 2020,
a small increase over the 165 permits issued in November 2019, but 68 fewer than October 2020
(as depicted in Chart 16).
For the eleven-month period ending November 30, 2020, Hendry County issued 279 single-family
building permits, compared to 192 issued during the same eleven-month period in 2019, a 45
percent increase.
Chart 14: Single-Family Building Permits for Lee County
Source: Local Building and Zoning Departments, including Fort Myers, Cape Coral, and Unincorporated Lee County,
Bonita Springs, Estero, and Fort Myers Beach permits
14Chart 15: Single-Family Building Permits for Collier County
Source: Collier County Growth Management Department, includes unincorporated Collier County permits only
Chart 16: Single-Family Building Permits for Charlotte County
Source: Charlotte County Economic Development Organization, includes unincorporated Charlotte County permits only
15Existing Single–Family Home Sales and Median Prices
Charts 17-19 show existing single-family home sales by Realtors® for Lee, Collier, and Charlotte
Counties. Each solid line represents median prices plotted against the scale on the right side, and
the bars show the number of homes sold with the scale on the left side. The broken lines show
the linear trends in numbers of homes sold and median prices.
Realtor® sales of single-family homes in the three coastal counties again rose substantially
compared to the same month of the prior year. Totals for November 2020 were 2,495, an increase
of 43 percent over November 2019, albeit 9 percent below October 2020. All three counties
experienced meaningful increases in median prices from one year ago, ranging from 12 to 26
percent. The sales and median price trend lines for all three counties continue to be positive.
Single-family home sales in Lee County rose to 1,364 units in November 2020, an increase of 363
units (36 percent) from November 2019, while Lee’s median price rose from $262,500 to $319,150
over the same period (Chart 17). Collier County single-family home sales improved to 639 units
in November 2020, an increase of 254 (66 percent) over November 2019. The median price in
Collier County rose from $435,000 in November 2019 to $550,000 in November 2020 (Chart 18).
Charlotte County reported 492 existing single-family home sales for November 2020, up 39
percent from the 353 units sold in November 2019. The median price in Charlotte County was
$269,900 in November 2020, up $29,950 (12 percent) over the same month last year (Chart 19).
Chart 17: Existing Single-Family Home Sales for Lee County
Lee County Existing Single Family Home Sales by Realtors®
1600 $400
1400 $350
Median Sale Price - Thousands
1200 $300
Number of Homes Sold
1000 $250
800 $200
600 $150
Lee Homes Sold
400 Lee Median Sale Price $100
Homes Sold Trendline
200 $50
Sale Price Trendline
0 $0
Mar 2019
Apr 2019
Oct 2019
Mar 2020
Apr 2020
Oct 2020
Feb 2019
May 2019
Feb 2020
May 2020
Jul 2019
Jul 2020
Dec 2018
Jan 2019
Jun 2019
Aug 2019
Sep 2019
Nov 2019
Dec 2019
Jan 2020
Jun 2020
Aug 2020
Sep 2020
Nov 2020
Source: Florida Realtors® Cape Coral-Fort Myers MSA
16Chart 18: Existing Single-Family Home Sales for Collier County
Collier County Existing Single Family Home Sales by Realtors®
700 $600
600
$500
Median Sale Price - Thousands
Number of Homes Sold
500
$400
400
$300
300
$200
200
Collier Homes Sold
Collier Median Sale Price $100
100 Homes Sold Trendline
Sale Price Trendline
0 $0
Feb 2019
Mar 2019
Apr 2019
Oct 2019
Feb 2020
Mar 2020
Apr 2020
Oct 2020
May 2019
May 2020
Jul 2019
Jul 2020
Dec 2018
Jan 2019
Jun 2019
Aug 2019
Sep 2019
Nov 2019
Dec 2019
Jan 2020
Jun 2020
Aug 2020
Sep 2020
Nov 2020
Source: Florida Realtors® Naples-Immokalee-Marco Island, Florida MSA
Chart 19: Existing Single-Family Home Sales for Charlotte County
Charlotte County Existing Single Family Home Sales by Realtors®
600 $300
500 $250
Median Sale Price - Thousands
Number of Homes Sold
400 $200
300 $150
200 $100
Charlotte Homes Sold
Charlotte Median Sale Price
100 Homes Sold Trendline $50
Sale Price Trendline
0 $0
Mar 2019
Apr 2019
Oct 2019
Mar 2020
Apr 2020
Oct 2020
Feb 2019
May 2019
Feb 2020
May 2020
Jul 2019
Jul 2020
Dec 2018
Jan 2019
Jun 2019
Aug 2019
Sep 2019
Nov 2019
Dec 2019
Jan 2020
Jun 2020
Aug 2020
Sep 2020
Nov 2020
Source: Florida Realtors® Punta Gorda, Florida MSA
17Realtor® Active Listings
Beginning in January 2021, the RERI will start tracking active listings. Active listings are provided
by the Realtors® residential listings database and provides a look into the number of properties
for sale on the market. These figures include single-family residential homes, condominiums and
townhomes, and exclude pending listings where a pending status is available.
Active listings in the three coastal counties continued to fall in November 2020. The coastal
counties had 10,481 residential properties listed for sale, down 6 percent from October 2020, as
well as a 39-percent decline from November 2019.
Active listings in Lee County dipped to 4,804 units in November 2020, a 6-percent decrease from
October 2020, and a 42-percent fall from November 2019 (Chart 20). Collier County reported
4,364 units listed for sale in November 2020, down from both the previous month (6 percent) and
same month last year (36 percent) (Chart 21). Charlotte County active listings fell to 1,313 units
in November 2020, a decrease of 3 percent from October 2020, and a 36-percent slip from
November 2019 (Chart 22).
Chart 20: Active Listings for Lee County
Lee County Active Residential Listings
14,000
12,000
10,000
Active Listings
8,000
6,000
4,000
2,000
0
Mar 2019
Apr 2019
Oct 2019
Mar 2020
Apr 2020
Oct 2020
Feb 2019
May 2019
Feb 2020
May 2020
Jul 2019
Jul 2020
Nov 2018
Dec 2018
Jan 2019
Jun 2019
Aug 2019
Sep 2019
Nov 2019
Dec 2019
Jan 2020
Jun 2020
Aug 2020
Sep 2020
Nov 2020
Source: Realtor.com residential listings database
18Active Listings Active Listings
500
10,000
0
1,000
1,500
2,000
2,500
3,000
0
1,000
2,000
3,000
4,000
5,000
6,000
7,000
8,000
9,000
Nov 2018 Nov 2018
Dec 2018 Dec 2018
Jan 2019 Jan 2019
Feb 2019 Feb 2019
Mar 2019 Mar 2019
Apr 2019 Apr 2019
May 2019 May 2019
Jun 2019 Jun 2019
Jul 2019 Jul 2019
Source: Realtor.com residential listings database
Source: Realtor.com residential listings database
Aug 2019 Aug 2019
Sep 2019 Sep 2019
19
Oct 2019 Oct 2019
Nov 2019 Nov 2019
Dec 2019 Dec 2019
Jan 2020 Jan 2020
Feb 2020 Feb 2020
Mar 2020 Mar 2020
Apr 2020 Apr 2020
Collier County Active Residential Listings
May 2020 Charlotte County Active Residential Listings May 2020
Jun 2020 Jun 2020
Chart 21: Active Listings for Collier County
Jul 2020 Jul 2020
Chart 22: Active Listings for Charlotte County
Aug 2020 Aug 2020
Sep 2020 Sep 2020
Oct 2020 Oct 2020
Nov 2020 Nov 2020Consumer Sentiment Index
Charts 23 and 24 shows monthly data and linear trend lines over the last six years for both the
Florida Consumer Sentiment Index (“CSI”) reported by the University of Florida Bureau of
Economic and Business Research (BEBR) and for the United States Index of Consumer Sentiment
(“ICS”) reported by Thomson Reuters/University of Michigan.
The U.S. Index of Consumer Sentiment improved in December 2020, rising 3.8 points from the
previous month to 80.7. Richard Curtin, chief economist for the Surveys of Consumers, noted that
the improvement was partially due to a partisan shift. “The largest change was in long term
business prospects, as twice as many Democrats as three months ago expected a continuous
expansion over the next five years (54% up from 27%), while that same favorable expectation was
nearly cut in half among Republicans (32% down from 60%),” noted Curtin.
As reported last month, Florida’s Consumer Sentiment Index dipped for the second consecutive
month in November 2020, falling 3.5 points to 80.9 from the revised figure of 84.4 in October
2020. “Despite the positive news about the efficacy of several coronavirus vaccine frontrunners,
bringing hope that economic activity can bounce back next year, Floridians’ views about future
economic conditions plunged in November,” Hector H Sandoval, director of the Economic Analysis
Program at the University of Florida’s Bureau of Economic and Business Research, said in the
December 1, 2020 edition of Florida Consumer Sentiment Index. “Looking ahead, as the cases of
coronavirus increase and restrictions are reimposed across the country, limiting social and
economic activity, we can expect continued low levels of consumer confidence in the following
months.”
20Chart 23: U.S. Index of Consumer Sentiment
Source: Thomson Reuters/University of Michigan
Chart 24: Florida Consumer Sentiment Index
Source: Bureau of Economic and Business Research, University of Florida
21Consumer Price Index
As reported last month, Chart 25 shows that year-to-year changes in consumer price indices
(“CPI”) through October 2020 continue to be lower than a year ago. All three measures are below
1.5 percent. The October 2020 Miami/Ft. Lauderdale CPI change decreased by 0.5 percent from
August 2019, while the CPI change for the US South Region was the same as the October 2019
figure. For the same period, CPI growth for the nation was 0.6 percent below the 1.8 percent
growth experienced for the 12 months ended October 2019.
Chart 25: CPI Annual Percentage Change
Consumer Price Index - Percentage Change From Year Earlier
8%
Miami / Ft. Lauderdale
6%
Change From Year Earlier
US South Region
4% US National
2%
0%
-2%
-4%
-6%
Oct-11 Oct-12 Oct-13 Oct-14 Oct-15 Oct-16 Oct-17 Oct-18 Oct-19 Oct-20
Source: U.S. Bureau of Labor Statistics
Components of the Miami-Fort Lauderdale Consumer Price Index for the 12 months ending
October 2020 are shown in Chart 26. Increases in food and beverage and medical care costs could
be considered an expected outcome of this pandemic. Similarly, decreases in transportation
expenses are largely due to quarantining and working-at-home scenarios.
22Chart 26: Miami-Fort Lauderdale CPI Component Percentage Change
Miami - Fort Lauderdale CPI Components
12 month change ending October 2020
Food and beverages +6.8%
Recreation +2.3%
Medical care +2.2%
Apparel +1.7%
Housing +1.5%
* Other goods and
Education and communication +0.3% services:
Tobacco and smoking
products, personal care
Other goods and services * -1.3%
products and services, and
miscellaneous personal
Transportation -5.0%
-15% -13% -11% -9% -7% -5% -3% -1% 1% 3% 5% 7% 9% 11% 13% 15%
12 Month Percentage Change
Source: U.S. Bureau of Labor Statistics
Appendix
The data presented in this appendix are not released on a monthly basis. The first two charts,
Charts A1 and A2, show historic population growth through 2019, as well as projections updated
annually by the state of Florida’s Office of Economic and Demographic Research, working in
conjunction with the University of Florida’s Bureau of Economic and Business Research. These
data have been revised since our last report. The second two charts, Charts A3 and A4, depict
historic measures of U.S. GDP growth rates and unemployment as well as projections by the
Federal Reserve’s Federal Open Market Committee and are updated quarterly. Charts A5 through
A8 show regional GDP for the coastal counties (published annually), while Chart A9 depicts the
FGCU Industry Diversification Index for Southwest Florida and the state, which is updated
quarterly.
Regional Population
Last Updated: August 2020
From 1990 to 2019, regional population grew at a compound average rate of 2.6 percent per year.
The compound average annual rates of growth were 2.8 percent in Lee County, 3.2 percent in
Collier County, 1.7 percent in Charlotte County, 1.9 percent in Glades County, and 1.5 percent in
Hendry County.
23The right-hand sections of Charts A1 and A2 show projected population increases from 2020 to
2045, at substantially lower rates than those experienced between 1990 and 2019. Projected
growth for the five-county region averages 1.3 percent per year, resulting in a population increase
of 38.6 percent from 2019 to 2045. This would add over 520,000 residents to the region, and
bring the total to 1,867,600. Lee County’s population is projected to grow an average of 1.4
percent per year, Collier County at 1.2 percent, and Charlotte County at 1.0 percent. Projected
growth rates for the inland counties are substantially lower; Hendry County’s population is
projected to grow at an average of 0.6 percent per year and Glades County at 0.3 percent per
year.
Chart A1: Coastal Counties Population, 1990 to 2045
Historic and Projected Population
Charlotte, Collier, and Lee Counties
1200
Historic Projected
1000
2019 2045
Population - Thousands
800 735 1,057
Lee 2045
600 517
1990 2019
335 377
400 Collier 2045
233
1990
152 2019
182
200
1990 Charlotte
111
0
1990 1995 2000 2005 2010 2015 2020 2025 2030 2035 2040 2045
Source: Office of Economic and Demographic Research
24Chart A2: Inland Counties Population, 1990 to 2045
Historic and Projected Population
Glades and Hendry Counties
50
45 2019
40.1
40 2045
Hendry 46.4
35
Population - Thousands
30 Historic Projected
25
1990
25.8 2045
20 2019 14.2
13.1
15 1990
7.6
10
5 Glades
0
1990 1995 2000 2005 2010 2015 2020 2025 2030 2035 2040 2045
Source: Office of Economic and Demographic Research
National GDP and Unemployment
Last Updated: January 2021
Charts A3 and A4 depict both historical trends and the Federal Open Market Committee’s
projections for national Gross Domestic Product (“GDP”) and Unemployment. The FOMC’s
projections are released quarterly and reflect the assessments of the Federal Reserve Board of
Governors and of Federal Reserve District Bank presidents, with the December 2020 figures shown
in the following charts. The dotted lines depict the highest and lowest projections—or the range
of all projections—while the darker blue area within the dotted lines depict the central tendency
forecast within those projections.
Chart A3 illustrates the uncertainty in GDP projections from the COVID-19 pandemic, with both
ranges and central tendencies fluctuating erratically from 2020 to long-run trend (“LR”). Real
GDP growth rates are based on the change from the fourth quarter of one year to the fourth
quarter of the next year.
GDP growth for 2019 measured 2.2 percent, a decline from the 3.0 percent measured in 2018.
The overall high and low projections (shown as ranges below and denoted by the dotted lines) for
2020 show that all members of the FOMC expecting GDP to fall, with some members predicting
GDP to fall as much as 5.5 percent. While FOMC members project that 2021 will show an
improvement in GDP growth, uncertainty surrounding the pandemic makes it difficult to project
precisely where GDP growth will be next year, resulting in projections that predict GDP will fall
25somewhere between 0.5 and 5.5 percent. In 2022, the board members believe that GDP growth
will range from 2.5 to 4.0 percent, and project that in the long-run, GDP growth will remain
somewhere between 1.6 percent and 2.2 percent.
Chart A3: Historic and Projected GDP Growth, 2009 to Long Run
U.S. Growth of Real GDP
6.0
5.0
4.0
3.0
2.0
Percentage
1.0
0.0
-1.0
-2.0
Range
-3.0
Central Tendency
-4.0
Source: Historical data obtained from Bureau of Economic Analysis. Projected data obtained from Federal Reserve Open
Market Committee Meeting Statement, December 16, 2020.
Chart A4 depicts unemployment trends since 2009. Unemployment expectations from FOMC
board members were tempered in the latest projections, ranging between 6.6 and 6.9 percent for
2020. FOMC members believe unemployment will continue to improve in 2021, with predictions
ranging from 4 percent to 6.8 percent. Unemployment in 2022 is projected to range somewhere
between 3.5 percent and 5.8 percent, and in the long run, the unemployment rate is expected to
range between 3.5 percent and 4.5 percent. Compared to these national numbers,
unemployment rates in Florida and Southwest Florida tend to be more volatile, falling lower when
national unemployment is falling and rising higher when national unemployment is rising.
26Chart A4: Historic and Projected Unemployment, 2009 to Long Run
U.S. Unemployment Rate
11.0
Range
10.0 Central Tendency
9.0
8.0
Percentage
7.0
6.0
5.0
4.0
3.0
Source: Historical data obtained from Bureau of Economic Analysis. Projected data obtained from Federal Reserve Open
Market Committee Meeting Statement, December 16, 2020.
The next quarterly release of projections for GDP and Unemployment will be released following
the FOMC meeting scheduled in March 2020. These projections will be updated in the April 2021
edition of Regional Economic Indicators.
27Regional GDP
Last Updated: January 2021
Charts A5 shows GDP growth by industry for the Southwest Florida coastal counties. Most
industries in the coastal counties continued to grow in 2019, with the transportation and
warehousing industry (7.3 percent increase from 2018 to 2019), finance, insurance, real estate,
rental and leasing industry (5.6 percent increase), educational services, health care, and social
assistance industry (5.1 percent increase), and professional and business services industry (4.9
percent increase) making the largest gains. Mining, quarrying, and oil and gas extraction (4.3
percent decline), and utilities (4.3 percent decline) were the only industries to retract from 2018
to 2019.
Chart A5: Regional Gross Domestic Product for Coastal Counties
Source: U.S. Bureau of Economic Analysis
28Charts A6 shows GDP by industry for Lee County. The transportation and warehousing industry
(6.3 percent increase from 2018 to 2019), educational services, health care, and social assistance
industry (5.9 percent increase), professional and business services industry (5.2 percent increase),
and information industry (4.5 percent increase) made the largest gains over the 12-month period.
Meanwhile, utilities (4.7 percent decline), agriculture, forestry, fishing and hunting (3 percent
decline), and construction (0.8 percent decline) all retracted over the same period.
Chart A6: Regional Gross Domestic Product for Lee County
Source: U.S. Bureau of Economic Analysis
29Charts A7 shows GDP by industry for Collier County. The transportation and warehousing industry
(7.3 percent increase from 2018 to 2019), information industry (6.5 percent increase), agriculture,
forestry, fishing and hunting industry (5.9 percent increase), and manufacturing industry (5.7
percent increase) made the largest gains over the 12-month period. Meanwhile, mining,
quarrying, and oil and gas extraction (45.4 percent decline) and utilities (2.3 percent decline) were
the only industries to retract over the same period.
Chart A7: Regional Gross Domestic Product for Collier County
Source: U.S. Bureau of Economic Analysis
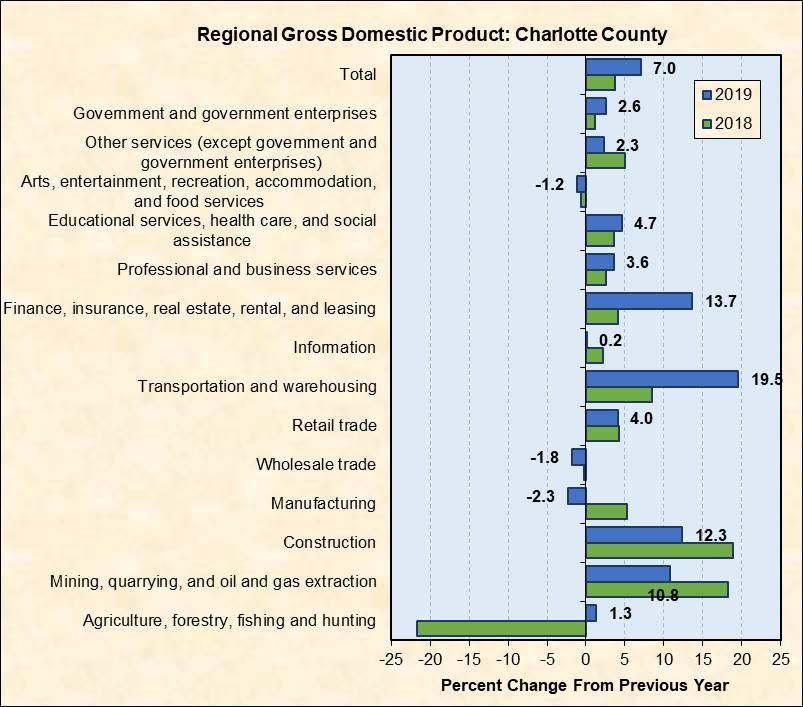
30Charts A8 shows GDP by industry for Charlotte County. The transportation and warehousing
industry (19.5 percent increase from 2018 to 2019), finance, insurance, real estate, rental and
leasing industry (13.7 percent increase), construction industry (12.3 percent increase), and
mining, quarrying, and oil and gas extraction industry (10.8 percent increase) made the largest
gains over the 12-month period. Meanwhile, manufacturing (2.3 percent decline), wholesale
trade (1.8 percent decline), and arts, entertainment, recreation, accommodation, and food
services (1.2 percent decline) all declined over the same period.
Chart A8: Regional Gross Domestic Product for Charlotte County
Source: U.S. Bureau of Economic Analysis
Industry Diversification Index
Last Updated: January 2021
The FGCU Industry Diversification Index (IDI) measures the degree to which a region’s workforce
is concentrated in few industries or dispersed into many. The IDI is computed quarterly by the
Regional Economic Research Institute’s Industry Diversification Project, which tracks industry
diversification by Metropolitan Statistical Area, workforce region, and state. (For more details,
please go to fgcu.edu/cob/reri/idp).
31The IDI can be between 0 and 10, with a higher index denoting a more diverse workforce and a
lower one denoting a less diverse workforce. Industry diversification is an important factor
explaining our state and region’s tendency to overheat during expansions in the business cycle
and overcorrect during contractions in the business cycle.
Chart A9 shows the industry diversification index for the Southwest Florida workforce region and
the state of Florida. During the second quarter of 2020, the IDI for Southwest Florida measured
at 5.36, ranking it as the 9th most industrially diverse workforce region in the state of Florida (out
of 24). Meanwhile, the state of Florida had an IDI of 5.24, ranking Florida as the 20th highest state
in the nation in industry diversification, although below the national average of 5.27.
Chart A9: Industry Diversification Index, 2005 to 2020
Source: FGCU Industry Diversification Project, Calculated by the RERI, using data from the Quarterly Census of
Employment and Wages
32You can also read