An Update to the Economic Outlook: 2020 to 2030
←
→
Page content transcription
If your browser does not render page correctly, please read the page content below
July 2020
An Update to the Economic Outlook: 2020 to 2030
This report presents the baseline economic forecast that social distancing, those measures include reducing social
the Congressional Budget Office is using as the basis for activities and travel, curtailing the activity of schools and
updating its budget projections for 2020 to 2030. The business, and working from home. In the first quarter of
agency currently plans to release those budget projections 2020, the pandemic and associated social distancing ended
later this summer. the longest economic expansion and triggered the deepest
downturn in output and employment since World War II.
This economic forecast provides CBO’s first complete set
of economic projections through 2030 since January and CBO projects that if current laws governing federal taxes
incorporates information available as of June 26.1 The and spending generally remain in place, the economy will
baseline forecast is being published now, rather than later grow rapidly during the third quarter of this year.
with the budget projections, to provide the Congress
with CBO’s current assessment of the economic out- • Real (inflation-adjusted) gross domestic product
look in a rapidly evolving environment. This economic (GDP) is expected to grow at a 12.4 percent annual
forecast updates the interim forecast that CBO published rate in the second half of 2020 and to recover to its
in May, which focused on 2020 and 2021.2 It is similar prepandemic level by the middle of 2022.
to the May forecast for those two years, except that the
projection of growth in the second half of 2020 has been • The unemployment rate is projected to peak at over
revised downward. 14 percent in the third quarter of this year and then
to fall quickly as output increases in the second half
The 2020 coronavirus pandemic has brought about of 2020 and throughout 2021.
widespread economic disruption. To mitigate the con-
tagion, governments, businesses, and households in the Following that initial rapid recovery, the economy con-
United States and around the world have taken measures tinues to expand in CBO’s projections, but it does so at a
to limit in-person interactions. Collectively referred to as more moderate rate that is similar to the pace of expan-
sion over the past decade:
1. See Congressional Budget Office, The Budget and Economic
Outlook: 2020 to 2030 (January 2020), www.cbo.gov/ • By 2028, real GDP reaches its long-run level relative
publication/56020. to potential GDP (the maximum sustainable output
2. See Congressional Budget Office, Interim Economic Projections for of the economy) and grows at the same rate as
2020 and 2021 (May 2020), www.cbo.gov/publication/56351. potential GDP thereafter.
Notes: Unless this report indicates otherwise, all years referred to are calendar years. Numbers in the text and tables may not add
up to totals because of rounding. Supplemental data are posted on the Congressional Budget Office’s website (www.cbo.gov/
publication/56442). On July 22, CBO will post additional supplemental material that discusses details of this forecast, including the
components of the projected growth of gross domestic product (GDP), key inputs in CBO’s projections of potential GDP, and com-
parisons with previous projections and with those of other forecasters. Later this summer, the agency will produce a report examining
the effects that federal policies adopted in response to the pandemic and recession are expected to have on economic outcomes.2 An Update to the Economic Outlook: 2020 to 2030 July 2020
• The unemployment rate remains above its prepandemic of fiscal and monetary policy actions are expected to
level through the end of the projection period. take hold. Real GDP and employment are projected
to rebound quickly in response. In CBO’s projections,
• Interest rates on federal borrowing throughout the strong GDP growth continues through 2024 but at a
decade remain well below the average rates in recent slower pace (see Figure 1). Meanwhile, the unemploy-
decades (see Table 1). ment rate decreases from a peak of over 14 percent in the
third quarter of 2020 to 5.9 percent by the end of 2024.
CBO’s projections reflect an average of possible out-
comes. For example, the pace projected for the initial Low-income families have borne the brunt of the eco-
rapid recovery could continue until GDP returned to its nomic crisis, partly because the hardest-hit industries
potential, or the economy could grow much more slowly. employ low-wage workers. African American, Hispanic,
The projections are subject to an unusually high degree and female workers have been hit particularly hard, in
of uncertainty, which stems from many sources, includ- part because they make up a disproportionate share of
ing incomplete knowledge about how the pandemic will the workforce in certain industries with jobs that involve
unfold, how effective monetary and fiscal policy will be, elevated risks of exposure to the coronavirus. Although
and how global financial markets will respond to the the labor market is expected to improve, in CBO’s pro-
substantial increases in public deficits and debt. jections, the unemployment rate remains higher through
2030 than it was before the pandemic.
The Economic Outlook for 2020 to 2024
One major driver of CBO’s forecast of the economy for Inflation, as measured by the growth rate of the price
the next several years is the agency’s projections about index for personal consumption expenditures (PCE), is
how the pandemic and social distancing will unfold. projected to be 0.4 percent in 2020 and to nearly reach
CBO projects that the degree of social distancing will 2.0 percent—the Federal Reserve’s long-run objective for
decline by about two-thirds from its April 2020 peak inflation—by 2024. CBO expects the Federal Reserve to
during the second half of this year, leading to an increase keep its target for the federal funds rate (the interest rate
in social activities and commerce. That projection is in that financial institutions charge each other for overnight
the middle of the distribution of possible outcomes, in loans of their monetary reserves) at 0.1 percent through-
CBO’s assessment. It allows for regional and seasonal out that period. In CBO’s projections, the interest rate
variation, and it accounts for the possibility of multiple on 10-year Treasury notes gradually rises from an average
waves of increased transmission of the virus and retight- of 0.9 percent in 2020 to 1.6 percent by 2024.
ening of social distancing measures, as well as other steps
people might take to protect their health while engaging The Economic Outlook for 2025 to 2030
in economic activity. The economy continues to expand during the sec-
ond half of the decade in CBO’s projections. Output
Another major factor underlying the economic forecast grows at an average annual rate of 2.1 percent over the
is the agency’s projections of the economic effects of 2025–2030 period—faster than the 1.8 percent average
the four laws enacted in March and April to address the annual growth of potential output. The unemployment
public health emergency and to directly assist affected rate continues to drift downward, reaching 4.4 percent
households, businesses, and state and local governments. by the end of 2030. Inflation is stable during the 2025–
Those laws—which together are projected to increase the 2030 period. For example, PCE price inflation averages
federal deficit by $2.2 trillion in fiscal year 2020 and by 1.9 percent, close to the Federal Reserve’s long-term
$0.6 trillion in 2021—will, in CBO’s assessment, par- objective of 2 percent. Interest rates are higher in the sec-
tially mitigate the deterioration in economic conditions ond half of the projection period than in the first: From
and help spur the recovery. 2025 to 2030, the federal funds rate averages 1.1 per-
cent; the rate on 3-month Treasury bills, 1.0 percent; and
From the third quarter of 2020 through the third quarter the rate on 10-year Treasury notes, 2.6 percent. Labor
of 2021, the degree of social distancing is projected to income as a share of GDP averages 58.1 percent, which
gradually diminish to zero (even though social distanc- is low compared with its historical average and reflects
ing may increase at times in some areas), and the effects trends that were under way before the pandemic.July 2020 An Update to the Economic Outlook: 2020 to 2030 3
Table 1 .
CBO’s Economic Projections for Calendar Years 2020 to 2030
Percent
Annual Average
Actual, 2023– 2025–
2019 2020 2021 2022 2024 2030
Change From Fourth Quarter to Fourth Quarter
Gross Domestic Product
Reala 2.3 -5.9 4.8 2.2 2.2 2.1
Nominal 4.0 -5.7 6.2 4.1 4.2 4.2
Inflation
PCE price index 1.4 0.4 1.3 1.7 1.9 1.9
Core PCE price indexb 1.6 0.6 1.3 1.7 1.8 1.9
Consumer price indexc 2.0 0.4 1.6 2.0 2.2 2.2
Core consumer price indexb 2.3 1.0 1.5 1.9 2.2 2.2
GDP price index 1.6 0.2 1.3 1.8 2.0 2.0
Employment Cost Indexd 3.0 1.7 2.6 2.3 2.6 3.0
Fourth-Quarter Level
Unemployment Rate 3.5 10.5 7.6 6.9 5.9e 4.4f
Change From Year to Year
Gross Domestic Product
Reala 2.3 -5.8 4.0 2.9 2.2 2.1
Nominal 4.1 -5.1 4.8 4.6 4.2 4.2
Inflation
PCE price index 1.4 0.8 1.0 1.6 1.9 1.9
Core PCE price indexb 1.6 1.0 0.9 1.5 1.8 1.9
Consumer price indexc 1.8 0.9 1.2 1.9 2.2 2.2
Core consumer price indexb 2.2 1.5 1.2 1.7 2.1 2.2
GDP price index 1.8 0.7 0.8 1.7 2.0 2.0
Employment Cost Indexd 3.0 2.4 2.1 2.4 2.5 3.0
Annual Average
Unemployment Rate 3.7 10.6 8.4 7.1 6.3 4.8
Payroll Employment (Monthly change, in thousands)g 174 -1,094 490 177 158 107
Interest Rates
3-month Treasury bills 2.1 0.4 0.2 0.2 0.2 1.0
10-year Treasury notes 2.1 0.9 0.9 1.1 1.5 2.6
Tax Bases (Percentage of GDP)
Wages and salaries 43.4 44.3 43.8 43.7 43.7 43.7
Domestic corporate profitsh 7.2 7.5 7.4 7.7 8.0 8.2
Sources: Congressional Budget Office; Bureau of Economic Analysis; Bureau of Labor Statistics; Federal Reserve.
GDP = gross domestic product; PCE = personal consumption expenditures.
a. Real values are nominal values that have been adjusted to remove the effects of changes in prices.
b. Excludes prices for food and energy.
c. The consumer price index for all urban consumers.
d. The employment cost index for wages and salaries of workers in private industries.
e. Value for the fourth quarter of 2024.
f. Value for the fourth quarter of 2030.
g. The average monthly change, calculated by dividing the change in payroll employment from the fourth quarter of one calendar year to the fourth
quarter of the next by 12.
h. Adjusted to remove distortions in depreciation allowances caused by tax rules and to exclude the effects of changes in prices on the value of inventories.4 An Update to the Economic Outlook: 2020 to 2030 July 2020
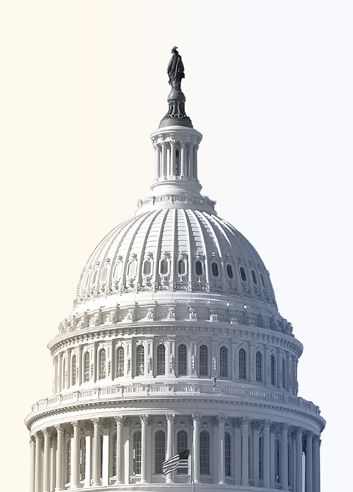
Figure 1 .
Growth of Real GDP and Real Potential GDP, and the Output Gap
Percent
6 Projected
4 In the second quarter of
Real GDP Growth 2020, the coronavirus
pandemic and associated
2
social distancing triggered a
Real Potential GDP Growth
sharp contraction in output,
0 ending the longest economic
expansion since World War II.
In CBO’s projections, real GDP
−2 grows rapidly in the second
half of 2020 and the first half
of 2021. Strong GDP growth
−4 continues thereafter but at a
slower pace.
−6
2000 2005 2010 2015 2020 2025 2030
Percentage of Potential GDP
2
Output Gap
0 Real GDP recovers rapidly
over the next several quarters
in CBO’s projections, rising
−2 from more than 6 percent
below its potential at the end
of 2020 to less than 4 percent
below its potential at the end
−4
of 2021. The growth of real
GDP then slows, and output
remains far below its potential
−6 for several more years.
−8
2000 2005 2010 2015 2020 2025 2030
Sources: Congressional Budget Office; Bureau of Economic Analysis.
Real values are nominal values that have been adjusted to remove the effects of changes in prices. Potential GDP is CBO’s estimate of the maximum
sustainable output of the economy. Growth of real GDP and of real potential GDP is measured from the fourth quarter of one calendar year to the fourth
quarter of the next.
The output gap is the difference between GDP and potential GDP, expressed as a percentage of potential GDP. A positive value indicates that GDP
exceeds potential GDP; a negative value indicates that GDP falls short of potential GDP. Values for the output gap are for the fourth quarter of each year.
The shaded vertical bars indicate periods of recession, which extend from the peak of a business cycle to its trough. The National Bureau of Economic
Research (NBER) has determined that an expansion ended and a recession began in February 2020. Although the NBER has not yet identified the end
of that recession, CBO estimates that it ended in the second quarter of 2020.
GDP = gross domestic product.July 2020 An Update to the Economic Outlook: 2020 to 2030 5
Uncertainties in the Economic Outlook Similarly, the annual level of real GDP in those years is
Like the interim projections that CBO published in May, now projected to be 3.4 percent lower, on average, than it
the agency’s latest economic projections are surrounded was projected to be in January. Forthcoming supplemen-
by an unusually high degree of uncertainty. Some of that tal materials will provide more detailed comparisons of
uncertainty results from the nature of the pandemic and the current projections with the agency’s previous projec-
the behavioral and policy responses intended to contain tions and with those of other forecasters.
its spread. The severity and duration of the pandemic are
subject to significant uncertainty. In particular, several
This document is one of a series of reports on the state
important epidemiological characteristics of the corona
of the economy that the Congressional Budget Office
virus remain unclear: Much still needs to be learned
issues each year. In keeping with CBO’s mandate to
about its transmissibility and lethality and about the
provide objective, impartial analysis, this report makes
immunity conferred on people who have recovered from
no recommendations.
it. Moreover, the severity and duration of the pandemic
will be affected by how various mitigation measures
CBO consulted with members of its Panel of Economic
reduce the spread of the virus and by when vaccines and
Advisers during the development of this report. Although
additional treatments become available—outcomes that
CBO’s outside advisers provided considerable assistance,
remain highly uncertain. Further uncertainty surrounds
they are not responsible for the contents of this report.
the effects of the pandemic and social distancing on eco-
nomic activity and on the pace of economic recovery.
Robert Shackleton wrote the report. Leigh Angres,
Sebastien Gay, Theresa Gullo, Deborah Kilroe, John
In addition, it is not clear how individuals, businesses,
McClelland, Ryan Mutter, Matthew Schmit, Chad
and state and local governments will respond to recent
Shirley, and Emily Stern provided helpful comments. The
fiscal and monetary policy actions taken by the federal
economic forecast and related estimates were prepared
government. International conditions may also change in
by Aaron Betz, William Carrington, Yiqun Gloria Chen,
unanticipated ways as the pandemic works its way through
Erin Deal, Daniel Fried, Edward Gamber, Ronald Gecan,
the rest of the world. A further contributor to the overall
Mark Lasky, Junghoon Lee, Michael McGrane, Jaeger
uncertainty is that the speed and intensity of the recent
Nelson, Sarah Robinson, Jeffrey Schafer, John Seliski,
downturn have greatly increased the difficulty of recording
Robert Shackleton, and Christopher Williams. Many
and compiling reliable economic data; CBO’s projections
other analysts at CBO contributed information about the
are based on data that may later be substantially revised.
pandemic and the effects of actions taken in response to
it. Erin Deal and Sarah Robinson fact-checked the report.
The agency’s longer-run projections reflect the additional
The writing of the report and the preparation of the
uncertainty of the underlying trends of key variables,
forecast were supervised by Jeffrey Werling, John Kitchen,
such as the size of the potential labor force, the average
Robert Arnold, and Devrim Demirel.
number of labor hours per worker, capital investment, and
productivity. Another source of uncertainty is the global
Mark Doms, Jeffrey Kling, and Robert Sunshine reviewed
economy’s longer-term response to the substantial increases
the report. Bo Peery was the editor, and Casey Labrack
in public deficits and debt that are occurring as govern-
was the graphics editor. An electronic version is available
ments spend significant amounts to attempt to mitigate
on CBO’s website (www.cbo.gov/publication/56442).
the impact of the pandemic and the economic downturn.
CBO continually seeks feedback to make its work
Comparisons With Previous Forecasts
as useful as possible. Please send any comments to
Overall, CBO’s projections for 2020 and 2021 are sim-
communications@cbo.gov.
ilar to those it published in May, except that economic
growth in the second half of 2020 is now projected to
be slower. The economic outlook for 2020 to 2030 has
deteriorated significantly since the agency last pub-
lished its full baseline economic projections in January.
For instance, the annual unemployment rate averages
Phillip L. Swagel
6.1 percent over those 11 years in the current projections,
Director
whereas it averaged 4.2 percent in the January projections.You can also read