Planning for 2019: Economic and Print Market Outlook and Implications for Printers Center for Print Economics and Management Sponsored by
←
→
Page content transcription
If your browser does not render page correctly, please read the page content below

Planning for 2019: Economic and Print Market
Outlook and Implications for Printers

Dr. Ronnie H. Davis, Senior Vice President and Chief
Economist

Center for Print Economics and Management

Sponsored by:
Planning for 2019: Economic and Print Market Outlook and Implications for
Printers

In this Special Flash Report we provide our assessment of current economic and print market
conditions plus offer our forecast for the 2019 economy and print markets. Specifically, we
address the following topics:
    • An update on current macroeconomic conditions
    • The outlook for the 2019 economy
    • Current print market conditions
    • Printers’ current business models (print processes, product and service offerings)
    • Outlook for print markets in 2019
    • Key issues for PIA members in 2019

Update on the 2018 Macroeconomy

In general, the North American economy is running in high gear during the third quarter of 2018.
However, there are some signs of increasing economic stress.

First, the good news. At the time of this report (August 2018) most of the economic news is
extremely optimistic. The supporting metrics include:
     • Second-quarter GDP increased at a very robust pace of 4.1 percent on an annual basis.
     • Core inflation continues at a low rate, although it is heating up.
     • Consumer and business confidence remain very strong.
     • Business profits are high, driven by strong domestic and global sales plus deregulation
         and lower corporate taxes.
     • Employment growth and an extremely low unemployment rate have resulted in rising
         wages.
     • Stock prices and home prices are growing.
The 4.1-percent growth rate for the economy reported for the second quarter ranks as the highest
mark out of the last ten quarters going back to 2016. The current economic expansion started all
the way back in June 2009, a phenomenal 110 months of sustained growth. This makes this
expansion the second longest in 164 years of record keeping by the National Bureau of
Economic Research, the official scorer of the economy. The only other longer expansion, from
1991 to 2001, commenced a discussion about the “new normal” and an end to the business cycle.
The Great Recession of 2007–2009 put an end to that conversation!

                                              PAGE 2 OF 22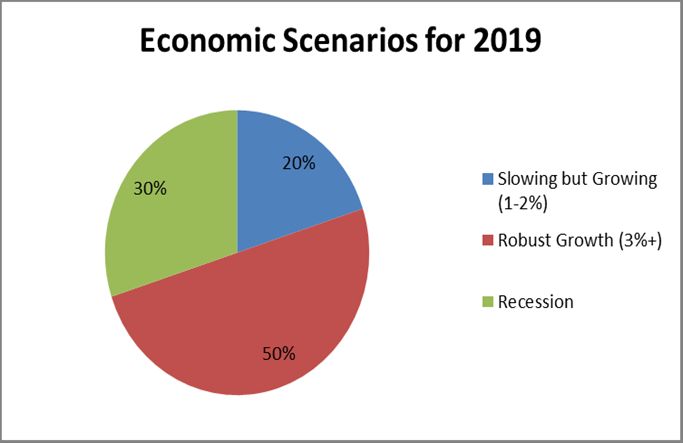
From May through July, U.S. employment growth averaged 224,000 jobs per month or about
double the pace necessary to absorb growth in the working-age population. The economy has
produced 94 consecutive months of steady employment growth. The labor force participation
rate is up to 62.9 percent, while the unemployment rate fell to 3.9 percent from June’s 4.0
percent, close to a 17-year low.
Wages are increasing at a modest pace of 2.7 percent year-over-year. Strong hiring and
consistently low unemployment should add upward pressure to wages throughout the remainder
of the year. Growing wages, boosted by tax cuts and a tight labor market, should keep consumer
confidence elevated throughout 2018.
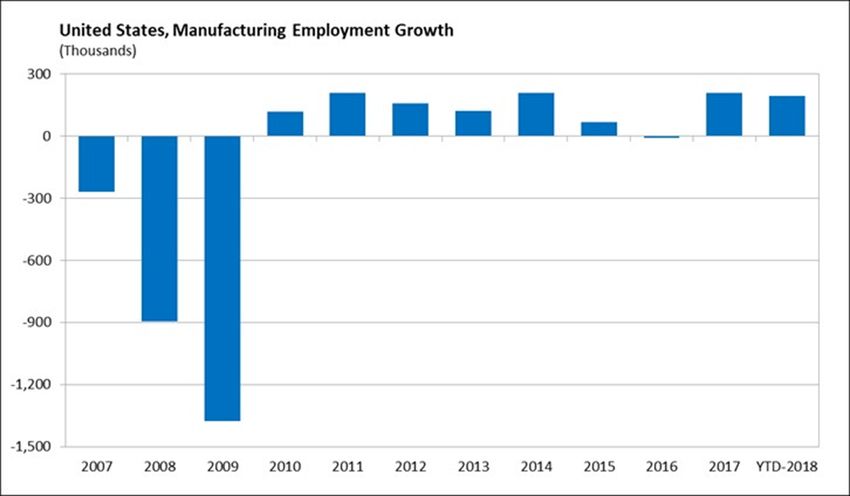
The U.S. manufacturing sector is extremely robust. Manufacturers added 37,000 new jobs in
July, and the sector has enjoyed a full year of continued strong employment growth with about
327,000 new jobs added in the past 12 months. Tax reform and deregulation combined with
sustained growth in global markets are stimulating manufacturing activity and expansion plans.
The Consumer Price Index increased at an annual rate of 2.2 percent in June, and core personal
consumption excluding food and energy prices rose 1.9 percent from a year ago.
PAGE 3 OF 22
The good news on employment extends to the manufacturing sector. As the overall
unemployment rate has declined, the number of manufacturing jobs has increased by
approximately 200,000 since last fall.

Source of Graph: National Association of Manufacturers

On the downside, is too much good news bad news? It certainly can be in terms of the economy.
Here are a few contrarian thoughts:

First, over the longer term, the U.S. economy is slowing. The average annual growth rate of
inflation-adjusted GDP has generally slowed by decade since the 1950s. Indeed, the decline is
more than two percentage points since the 1950s and over one percentage point since the 1970s
and 1980s.

                                             PAGE 4 OF 22
A primary reason for the longer-term decline in growth is that the growth rates achieved during
economic expansions have decreased over the decades. This trend is apparent when the 11
expansions are viewed chronologically since 1949.
There seems to be some correlation between lower-growth expansions and longer-lasting
expansions. Since 1949, the economic expansions have not only been generally weaker but the
good news is they have been generally longer. As this expansion heats up, does that raise an
alarm?
PAGE 5 OF 22With this background we can now provide our forecast of the economy in 2019.
The Economic Outlook for 2019
In our view, the economy will most likely continue on a pace of robust, above-trend growth of
around 3 percent in 2019. However, as always, economic forecasting is fraught with uncertainty.
As usual, we offer two other entirely possible 2019 economic scenarios:
• A “slowing but growing” trend line with GDP retreating back to around 2-percent growth
• A 2019 recession with total GDP down around 1.5 percent
Of course, other outcomes are possible, including higher growth or a more serious recession or
any hybrid combination of our three scenarios. Our percentage likelihood of our three scenarios
is a 50-percent chance for robust growth, 20-percent chance of slowing growth, and 30-percent
chance for a recession. Note that we have increased the likelihood of recession from last year’s
outlook from 25 percent to 30 percent. In our view, the likelihood will increase even more in
2020 if we get by 2019 without one.
PAGE 6 OF 22PAGE 7 OF 22
Let’s look at each of these scenarios.

Robust Growth: This most likely scenario is a continuation of the recent uptick in economic
growth. The two key drivers of this prospect are already in place—deregulation and the cut in
corporate taxes. These both increase the competitiveness of the U.S. economy and raise the
equilibrium annual growth rate by around 0.5 to 1 percent. So far, the economy has been able to
accelerate to this pace by an elastic response in labor force participation and a return to more
“animal spirits” in business investment.

2019 Recession: Historically, most recessions are caused by two primary reasons—external
shocks such as oil shortages or a financial crisis, or excess exuberance leading to over investment
that finally results in cutbacks and downsizing. A variation of the second cause is simply the
recovery dying of old age as new investment opportunities decline. A case can be made for either
of these arising next year or in 2020.

   •   External shocks: There are many possible external shocks, but the most likely at the
       present time is an escalation of trade wars leading to higher tariffs leading to even higher
       tariffs and finally recession.
   •   Excess exuberance: We discussed the possibility of too much of a good thing being a
       bad thing earlier. The excess exuberance could lead to over investment and ultimately
       cutbacks leading to more cutbacks. The likelihood of this may be higher given the fact
       that we are in the second longest recovery in 164 years of tracking the U.S. economy.

Over the past few months the “yield curve” (the spread between short-term and long-term
interest rates) has been rotating toward less slope, and this has been a fairly reliable predictor of a
coming recession. While the yield curve has shifted, it has not yet flipped, so we likely have
some gas left in the economic tank. But, with over 110 months of growth, time may be running
out.

At the present time the downside risks that could lead to a recession include:

       1. Trade restrictions/barriers slow down the U.S. global economy.
       2. Labor shortages restrict growth coupled with immigration restrictions (total number,
          quantity and quality, age). Immigrants—substitute or complement to U.S. labor
          supply?
       3. Bottlenecks—particularly transportation
       4. Costs and price pressures—Both are inherent in the growing economy and as a result
          of possible missteps by the Federal Reserve as it unwinds the bond-buying push of
          the last few years.

                                                 PAGE 8 OF 22
5. Interest rates ramp-up from inflation, and increases in deficit crowd out private
investment.
6. Other wild card issues
Slowing but Growing: A slowing but growing economy would be a return to the economic
trajectory of the past few years. The likely cause of this path is some combination of the six
downside risks listed above. Just two or three of those in combination may not be enough to tip
the economy into recession but certainly could shave a full point from the robust growth scenario
and leave us with sluggish growth.
PAGE 9 OF 22Back to the Present: Current Print Markets
Since the end of the Great Recession in June of 2009, print markets have become increasingly
healthy. This is particularly true for 2018 as the economy has ramped up. As we have previously
pointed out, there are six key reasons why print and printers have largely been healthy since the
end of the recession.
On a nominal basis, print markets are growing around 1 to 2 percent at the present time. For
2016 (the most current data from the U.S. Census), print’s economic footprint totaled $166.3
billion in annual shipments, 42,060 establishments, and over 810,000 employees.
2016 Print and Publishing Market Overview
Commercial Print and Related Support Activities (NAICS 323)
NAICS segment Employment Establishments Shipments ($1,000s)
323111 Commercial print 338,592 18,405 $61,863,993.76
323113 Commercial screen 63,056 5,150 $11,520,933.72
323117 Commercial book 19,886 421 $3,633,362.22
323120 Support activities 24,555 1,545 $4,486,433.13
Total 446,089 25,521 $81,504,722.8
Print-Related Media (Publishing) (NAICS 511)
Employment Establishments Shipments ($1,000s)
511110 Newspaper 180,786 7,496 $22,460,177.20
PAGE 10 OF 22511120 Periodical 90,640 5,584 $24,286,000.00
511130 Book 64,222 2,574 $25,945,054.92
511140 Directory and mailing list 15,410 786 $7,491,545.03
511191 Greeting card 13,076 99 $4,576,600.00
Total 364,134 16,539 $84,759,377.1
Commercial Print and Related Support Activities and Print-Related Media
(NAICS 323 + 511)
Employment Establishments Shipments ($1,000s)
NAICS 323+511 810,223 42,060 $166,264,100.0
Printers’ profits are also generally healthy based on historical trends. The most recent metric
from PIA’s Ratios progam shows profits as a percent of sales at 2.7 percent.
What about print production processes? The typical business model for a printer includes using
multiple printing processes and providing numerous non-print services. Sheetfed and toner-based
digital continue as the most prevalent printing processes with inkjet capabilities gaining
popularity. However, web and gravure still are viable processes for specialized printers. Over six
out of ten respondents indicated they provide non-print value-added services. In contrast, this
suggests that almost four out of ten printers remain fully focused on print production with little
or no ancillary services. See the data below from our on-going joint research program with the
Jones School of Business of Middle Tennessee State University:
PAGE 11 OF 22What is the relationship between sales and print processes? In our recent joint research with the
Jones School of Business of Middle Tennessee State University we asked our respondents to
provide their perception of sales change related to each of the nine processes they provide.
Here’s the question we used to measure sales change:
“For each printing process that you provide, please indicate the extent sales decreased, were
flat, or increased from 2016 to now for your company. Please select on a 1–5 point scale: 1)
Sales declined drastically; 2) Sales declined modestly; 3) Sales were flat; 4) Sales increased
modestly; and, 5) Sales increased dramatically.”
Based on this scale, digital toner-based print was the fastest growing process followed by
production inkjet and non-print ancillary services. In contrast, heatset web was the laggard with
sales declining slightly based on the scale. This was the only segment with decreased sales based
on the scale.
PAGE 12 OF 22W
eb
of
2.50
2.70
2.90
3.10
3.30
3.50
3.70
3.90
4.10
fs
et
he
at
se
t
2.85
W Sh
Di eb ee
gi tfe
ta of d
li fs
3.19
nk et
je no
tw n-
id he
e
& at
se
su t
3.21
pe
rw
No id
-p e
r fo
in rm
t an at
3.52
cil
la Fle
ry
v al
xo
ue gr
ap
Di
gi
ad h ic
ta de
3.63
li d
nk se
je rv
2016-17 Sales Change
th ice
ig sa
h -s le
s
PAGE 13 OF 22
pe
3.63
ed
pr
od
uc
Di ti o
gi n
ta
3.67
lt
on
er
-b
as
e d
3.94What products are being printed? There is a wide variety and diversity in printed products. When
we surveyed printers some 28 specific print products were identified.
PAGE 14 OF 22The demand for these products was also quantified in the same metrics as used above for print
processes. The ratings generally ranged from stable to modest growth reflecting the generally
healthy print markets as discussed above.
PAGE 15 OF 22What ancillary services are printers providing? Our research demonstrates that there are twelve
fairly common ancillary services currently offered by printers. Of these, fulfillment and mailing
management are provided by a majority of printers.
PAGE 16 OF 22In terms of demand, ancillary services generally are more in demand than print products
according to survey respondents. Indeed, all twelve ancillary services score at least a “moderate”
in terms of increases in demand.
PAGE 17 OF 22Back to the Future: Print Outlook for 2019
So how will the three 2018 economic scenarios impact print? In our view:
• In the most likely robust-growth scenario (50% likelihood), overall print shipments
increase by 2-plus percent next year. In terms of industry profitability, the average
printer’s profit rate would likely increase by about 0.5 percent over trend to around 3.5
percent of sales.
• The recession scenario (up to 30% likelihood) would reduce total print and print-related
shipments by around 2 to 4 percent next year. The typical printer’s profits would dip
significantly into negative territory until the recovery is underway.
• The slowing-but-growing scenario (20 % likelihood) would result in stable or slightly
growing overall print sales in 2019. In this scenario, printers’ profits dip slightly to
around 2.5 percent of sales.
PAGE 18 OF 22Printers’ Profit Outlook: Printers’ profits will trend by significantly different paths depending
on the economic scenarios:
• In the robust-growth scenario, profits would jump significantly to historic highs of 3.4
percent of sales in 2018 and 3.5 percent of sales in 2019.
• If the economy falls into a recession, in 2018 printers’ profits would be wiped out and
turned into losses for both 2018 and 2019.
• In the trend scenario, profits would remain at 3 percent of sales for both 2018 and 2019.
PAGE 19 OF 22Of course, within each of these three scenarios profit leaders will do much better and profit
challengers much worse.
• Profit leaders will be profitable in any of the three scenarios, although the level of profits
will vary. The largest impact is on the downside with profits dipping substantially in a
recession.
• The trends for profit challengers are not respectable even in good times, and in bad times
they are even worse. In the best case, profit challengers will average only around one
percent of sales. In contrast, they drop to a negative one percent in a recession.
PAGE 20 OF 22Outlook by Print Processes: The current trends regarding print processes will continue in all
three economic and print market scenarios. Print processes that will grow relatively fastest over
the next one to two years include:
• Inkjet—both wide-format and production
• Wide-format—particularly digital and inkjet
• Digital toner-based
Outlook by Print Market Segments: The current trends for specific print market segments will
also likely carry over for the next year in all three scenarios. These print market segments will
likely grow at a relatively higher rate than other sectors:
• Packaging and specialty packaging
• Labels and wrappers
• Signage
• Direct mail
• Point-of-purchase
Key Issues for PIA Members in 2019
Given the above economic and print scenarios, there are two key issues PIA members need to
address in the immediate future. One issue is outside the plant and the other issue is inside the
plant.
1. Outside the Plant: An increasingly variable and risky economic and industry environment
Although we are not forecasting a recession, the likelihood of one is increasing, especially
looking out over a two-year horizon. However, at the same time there is a strong chance of
robust economic growth. The resulting range in outlooks for printers goes from revenue growth
of 2 percent or more to revenue decline of 4 percent or more—a significant range. Members need
to be prepared for both ends of the spectrum next year. While the risks are high, the rewards are
also high. Printers need to do their homework to objectively evaluate investment opportunities to
determine the ROI while also developing a “what if” plan for the downside.
2. Inside the Plant: Increasing need for competitive advantage strategies and tactics to become
an industry profit leader
Strategic thinking is always important for success but it is even more important in a changing
environment. When it comes to strategy in the printing industry, printers first of all should
address the dual issues of product/service focus and value-added ancillary services. Financial
PAGE 21 OF 22performance typically correlates with specialization by a printed product or vertical market.
Also, diversification into various ancillary services also generally correlates with higher profits.
This dual strategy works by lowering costs from specialization and increasing revenues from
diversification. Printers need to re-think where they are in this process and make new conscious
decisions about what they are doing.
PAGE 22 OF 22You can also read