RELEVANT INFORMATION - Public now
←
→
Page content transcription
If your browser does not render page correctly, please read the page content below
RELEVANT
      INFORMATION

May 2020

                Argos kick off RESET, its strategy to mitigate the COVID-19 impacts
            ▪ The first quarter results of 2020 in terms of revenues and EBITDA were very similar to the
              same period last year, despite the impacts regarding to the operation closure in Colombia
              and in some countries of the Caribbean and Central America that began during the last two
              weeks of March.
            ▪ The position of Argos’ cash flow, which accounted for around 615 billion pesos up to April
              30, reaffirms its sustainable economy and its capability to executive actions in order to
              protect its financial liquidity.
            ▪ In the midst of challenging market conditions, the Colombian Region reported an increase
              of 15 percent in EBITDA.

           Update of the operations statements:

           The USA Region, which, in 2019, represents 39 percent of the cement volumes
           and close to 55 percent of Argos’ EBITDA, continues operating under strict
           protocols. In Colombia, for the infrastructure sector, the mandatory isolation
           was lifted in April 13 and for commercial construction on April 27, which allows
           the company to gradually reactivate its operations.

           On the other hand, the Caribbean and Central America Region continues with
           regular dispatches in Haiti, and it also shows positives signs of recovery in
           Honduras, since the market opening on April 16. There is slight impact on demand
           in Suriname and French Guiana. Levels are still below 40 percent of the usual
           volumes in the Dominican Republic, Puerto Rico and the Antilles. Panama still is
           not operating due to government restrictions, but there are signs of some
           reopening by mid-May.

           In order to mitigate the risks associated with the coronavirus pandemic, Argos
           has implemented an integral action plan called RESET: Re-start safe and
           healthy to boost the economy, bring hope and transform lives. This plan takes
           into account the safe re-start of our operations to protect our people, our
           finances and our society in line with local regulations.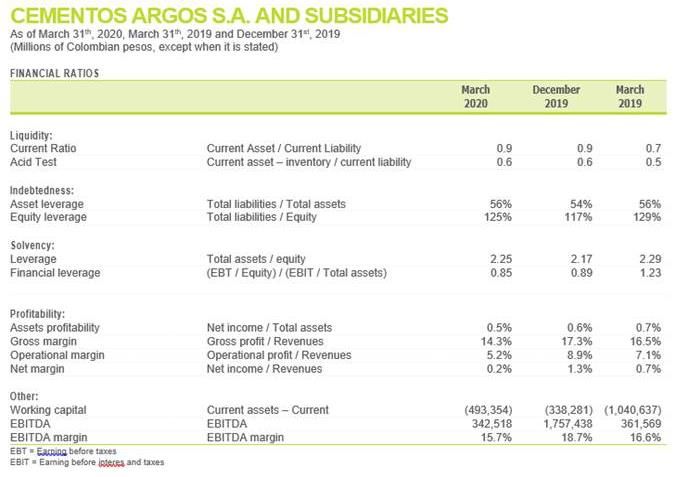
The main pillars of the RESET plan are:

▪   Health and safety: Implementation of strict protocols and new measures
    with a goal of operating safely, under the guiding premise of protecting the
    lives, health and well-being of employees, customers, suppliers and
    neighboring communities.
▪   Financial liquidity: Cash flow conservation initiatives include capex
    reduction by USD $40 million in 2020 and centralize all payment-related
    decisions. Likewise, the company has disbursed around USD $110 million in
    credits in order to increase the liquidity position. As a result, Argos’ cash
    flow in April was around 615.000 million pesos, an amount significantly
    higher than the amount at the beginning of the year. As for capturing savings
    and efficiencies, they are projected to be between USD $75 and $90 million.
    Argos expects to achieve around 84 percent of these efficiencies through a
    fixed costs reduction and the remaining 16 percent left through adjustments
    in administration and sale expenses.
▪   Operational excellence: redesign of the operating model to adapt to new
    market premises that will overrides once all the isolation measures are
    lifted.

                         “With the company's strong cash flow position, the
                         savings initiatives within RESET, the support of our
                         stakeholders and the passionate commitment of our
                         more than 7,000 employees, we firmly believe that
                         Argos is prepared to face the current challenging
                         conditions of the market to continue building dreams
                         that boost development and transform lives," said
                         Juan Esteban Calle, Argos’ CEO.
Consolidated Results:

In the first three months of 2020, Argos, a cement and ready mix company of
Grupo Argos, reported revenues of 2.2 trillion pesos, a figure that remains stable
when compared to 2019. The EBITDA*, including the effect of IFRS16, was 343
billion pesos, decreasing 1 percent when compared to the same quarter of the
previous year. During the period, the total volume of cement dispatched reached
3.6 million tons, 6.1 percent less, and ready mix volumes* decreased 10.7
percent, reaching 2.1 million cubic meters.

In general, the results were impacted mainly because of the closure of
operations in Colombia and in some countries of the Caribbean and Central
America and, to a lesser extent, by the poor weather conditions experienced in
some areas of the United States.
Performance of business by regions:
In the USA Region, Argos obtained revenues of USD $350 million, with a decrease
of 6.1 percent when compared to the same period in 2019. Likewise, EBITDA*
closed at USD $38 million, experiencing a decrease of 6.1 percent, mainly due to
the higher maintenance costs at Argos’ Martinsburg and Newberry Plants, which,
in order to achieve operational efficiencies, were carried out during the first
months of 2020.
During the first quarter, cement volumes decreased slightly by 1.2 percent,
which shows resilience when facing the COVID-19 crisis in the states where the
company has operations. On the other hand, ready mix dispatches* decreased
5.5 percent, affected by the aforementioned weather conditions.
Argos is expecting demand to slowdown in the United States for employment,
consumption, and residential and commercial construction starts between the
end of the second quarter and the beginning of the third quarter. For its part,
in infrastructure, the organization forecasts short-term impacts from liquidity
shortages both on state and federal levels. According to discussions currently
taking place within government, this segment could be key for reactivation the
economy in the medium term, based on the stimulus measures that are
expected.
In the Colombia Region, revenues reached 523 billion pesos, which represents a
decrease of 6.1 percent when compared to the same period in 2019. EBITDA* had
an increase of 15 percent in comparable terms and totaled 122 billion million
pesos. This improvement was mainly due to a significant reduction in
maintenance costs and the efficiencies implemented starting in the second half
of 2019, which led to a decrease in energy costs of 8.8 percent, when compared
to the same quarter last year.
Cement dispatches were located at more than 1 million tons, with a decrease of
13.9 percent, and ready mix shipments totaled 554,000 cubic meters, 19.5
percent less. Both were impacted by the closure of operations towards the end
of March, as a result of the government-mandated isolation.
At the end of April, the retail segment had experienced a 50 percent recovery
in its daily volumes, while the industrial segment started slower because of the
strict protocols that must be followed to reopen its projects.

*Adjustment in the volume of ready mix and EBITDA in 2019 excludes the impact of divested assets in the United States in
the fourth quarter of 2019. EBITDA also excludes 10 billion pesos for land valuation in Colombia.
Regarding the prospects for this year, Argos recognizes the need for compliance
on the measures adopted by the government to successfully contain the spread
and flatten the curve With this in mind, Argos expects a quick recovery of the
economy and are closely monitoring how low oil prices and the devaluation of
the peso will challenge the return of the economy.

On the other hand, in the Caribbean and Central America Region, the general
results were equally impacted to a large extent by the slowdown in the markets
due to the COVID-19 and by the lower price pull in Honduras and Panama.

In accordance with the dynamics described above, revenues and EBITDA
decreased 16.9 percent and 33.5 percent respectively, including the effect of
IFRS16. For its part, shipments reached 1.2 million tons of cement, with a
decrease of 4.1 percent, and those of ready mix stood at 61,000 cubic meters,
34.1 percent less compared to the same period of the previous year.

During January and February 2020, Honduras and the Dominican Republic had
better market dynamics when compared to the last quarter of 2019. For its
part, Haiti continued with constant growth. Lastly, the Panamanian government
has demonstrated its drive to boost the local economy and protect national
production by imposing a 30 percent tariff rate on cement imports into the
country.

“It is time to renew hope and join efforts to allow the reactivation of our
industry under two non-negotiable principles: collective well-being of our
people and the implementation of strict personal hygiene measures. We
return with greater strength and conviction. We are prepared, and we
want to instill confidence in all our stakeholders,” mentioned Juan Esteban
Calle, Argos CEO.

In the current context, the company expects a greater migration towards Argos
ONE, its digital tool that allows customers to reserve, order and track their
cement and ready mix dispatches. During March, Argos ONE represented 70
percent of Colombia's cement shipments, 41 percent in the United States, 35
percent in Honduras, and 23 percent in Panama. On the ready mix side, it
represented 49 percent in Colombia, 3 percent in the United States, and 33
percent in Panama.

For more information you can contact:
Piedad Monsalve, Communications Manager | pmonsalve@argos.com.co
Remember to visit our virtual press room: saladeprensa.argos.co
Cementos Argos S. A. and subsidiaries
CONSOLIDATED STATEMENT OF INCOME
For the three months ended 31 March | Million of Colombian pesos or million dollars

                                                                                            Period (1Q)
                                                                            2020                2019          Variation

Continuing operations
Income from operations                                               $     2,180,452 $         2,175,025             0.2
US$ dollar                                                                            617              693         (10.9)
Cost of sales                                                              1,869,736           1,815,126             3.0
 Cost of sales                                                               1,673,922          1,641,158             2.0
 Depreciation and amortization                                                 195,814            173,968            12.6
Gross profit                                                         $       310,716 $           359,899           (13.7)
Administrative expenses                                                      133,769             142,972            (6.4)
Selling expenses                                                              58,354              53,569              8.9
Depreciation and amortization                                                 32,495              32,578            (0.3)
Other expenses from operations, net                                           28,111              24,243             16.0
Operating profit                                                     $       114,209 $           155,024           (26.3)
 EBITDA                                                                       342,518            361,569            (5.3)
 US$ dollar                                                                        97                115           (15.9)

Financial expenses, net                                                      111,365             101,027             10.2
Foreign currency exchange (loss) gains, net                                   12,830               2,023            534.1
Share of profit of associates and joint ventures                                  140                574           (75.6)
Profit before income tax                                             $        15,814 $            56,594           (72.1)
Income tax                                                                    (2,499)             17,573          (114.2)
Net income                                                           $        18,313 $            39,021           (53.1)

Income for the period attributable to:
Owners of the parent company                                                    4,168             15,409           (73.0)
Non-controlling interest                                                       14,145             23,612           (40.1)
Net income for the year                                              $         18,313 $           39,021           (53.1)
US$ dollar - Owners of the parent company                                              1                  5          (76)

Additional Information:
Gross margin                                                                   14.3%              16.5%
Operating margin                                                                5.2%               7.1%
Net margin                                                                      0.2%               0.7%
EBITDA                                                                        342,518            361,569
EBITDA margin                                                                  15.7%              16.6%
Cementos Argos S. A. and subsidiaries
CONSOLIDATED STATEMENT OF FINANCIAL POSITION
For the three months ended 31 March and December 31 | Millions of Colombian pesos or million dollars
2020 2019 Variation
ASSETS
Cash and cash equivalents $ 717,497 $ 353,211 103.1
Derivative financial instruments 96,853 355 27,182.5
Other financial assets 24,304 - 100
Trade receivables and other accounts receivable, net 1,208,901 1,028,622 17.5
Tax receivable 312,419 324,356 (3.7)
Inventories 1,111,967 899,542 23.6
Other non-financial assets 68,390 76,282 (10.3)
Assets held for sale 30,801 31,944 (3.6)
Total current assets $ 3,571,132 $ 2,714,312 31.6
7.8
159,410
Trade receivables and other accounts receivable, net 147,825
Investments in associates and joint ventures 55,086 47,415 16.2
Derivative financial instruments - 3,675 (100)
Other financial assets 590,923 982,630 (39.9)
Other intangible assets, net 918,467 833,014 10.3
Assets by right of use of leases 924,676 964,860 (4.2)
Biological assets 20,638 20,638 -
Property, plant and equipment, net 12,891,577 11,135,945 15.8
Investment property 220,103 205,370 7.2
Goodwill 2,124,301 1,718,298 23.6
Deferred tax assets 463,854 420,368 10.3
Total non-current assets $ 18,369,035 $ 16,480,038 11.5
TOTAL ASSETS $ 21,940,167 $ 19,194,350 14.3
US$ dollar 5,398 5,857 (7.8)
LIABILITIES
Financial liabilities 1,513,304 1,035,254 46.2
Lease liability 149,841 148,753 0.7
Trade liabilities and accounts payable 1,734,180 1,220,127 42.1
Taxes, liens and duties 213,287 215,992 (1.3)
Employee benefits 177,452 155,269 14.3
Provisions 87,044 83,886 3.8
Other financial liabilities 27,417 16,030 71.0
Derivative financial instruments 5,787 16,310 (64.5)
Outstanding bonds and preferred shares 30,424 30,937 (1.7)
Prepaid income and other liabilities 125,750 130,035 (3.3)
Total current liabilities $ 4,064,486 $ 3,052,593 33.1
Financial liabilities 3,053,189 2,370,149 28.8
Lease liability 784,575 805,354 (2.6)
Trade liabilities and accounts payable 1,407 1,159 21.4
Employee benefits 294,396 289,800 1.6
Derivative financial instruments 113,345 48,719 132.7
Provisions 258,316 167,365 54.3
Outstanding bonds and preferred shares 3,280,869 3,281,633 0.0
Other liabilities 1,587 1,634 (2.9)
Deferred tax liabilities 350,755 323,497 8.4
Total non-current liabilities $ 8,138,439 $ 7,289,310 11.6
TOTAL LIABILITIES $ 12,202,925 $ 10,341,903 18.0
US$ dollar 3,002 3,156 (4.9)
Equity 8,775,991 8,037,698 9.2
Non-controlling interest 961,251 814,749 18.0
EQUITY $ 9,737,242 $ 8,852,447 10.0
US$ dollar 2,395 2,701 (11.3)TOTAL EQUITY AND LIABILITIES $ 21,940,167 $ 19,194,350 14.3
Separated Financial Statements
In compliance of the letter 24 of 2017 and the article 5.2.4.1.5 of decree 2555 of 2010,
is important to highlight that to have a better understanding of the financial
information published by the company, both the consolidated and separated financial
statements must be analyzed in conjunction including its respective appendixes and the
solvency, profitability, liquidity and indebtedness are detailed in the respective
document transmitted to the Superintendencia Financiera de Colombia.
The separated financial statements of Cementos Argos S.A. reflect a similar trend to
the one reported in the analysis of our Colombian operation in the consolidated
financial statements and complementary analysis published to the stock market and
reported to the Superintendencia Financiera de Colombia. In the same way, the
separated financial statements include the corporate expenses of the operation that
supports all the geographies. In this sense, and in order to have an appropriate
understanding of the solvency, profitability, liquidity and indebtedness of the company,
it is suggested to analyze the consolidated financial statements.
Volumes and market performance
Cement and concrete dispatches decreased 13.9% and 19.5%, respectively, in annual
terms. These results were affected by the value recovery strategy carried out
successfully during the first quarter of the year, as well as by the quarantine decreed
by the Colombian Government as of March 25, reducing our working days by 8% during
the quarter.
During the quarter, imports of Clinker and cement decreased by 35.3% and 56.1%
respectively compared to 1Q19, which, together with the growth of the market during
January and February, allowed us to continue with the improvement in prices in the
segment of cement, ending with an increase of around 13.5% compared to 1Q19.
The closure measure for infrastructure was lifted on April 13, and for the residential
and commercial sector on April 27, which allowed us to begin the restart of our
operations. At the date of this report, the massive business shows a positive trend with
a recovery in volumes of around 50%. The industrial business, as expected, is
experiencing a slower recovery given the strict protocols that must be followed to
reopen its construction sites. In general, dispatches made during April have doubled our
initial market expectations, significantly improving our scenarios in the region.
Additionally, the devaluation of the Colombian peso generated an increase in the
import parity price of 17% between March and April, adding more space for our value
recovery strategy amid the gradual recovery of the market.
Regarding the outlook for this year, we recognize the early measures adopted by the
government to successfully contain the contagion curve and, in that sense, we expect a
rapid recovery of the economy, recognizing the challenge that this represents in a
scenario of low oil prices and currency devaluation.
Financial results
Revenues in Colombia reached 523 billion pesos, which represents a 6.1% decrease
compared to 1Q19, mainly due to the lower volumes presented during the quarter.
EBITDA, on the other hand, had a 15% increase in comparable terms. This improvement
was mainly due to a significant decrease in maintenance costs because of the
reprogramming of some of the major plant maintenance shutdowns, in addition to cost
efficiencies implemented since the second half of 2019, resulting in a decrease in
energy costs of 8.8% compared to the same quarter of 2019. The EBITDA margin for the
quarter was 23.2%, an improvement of 4.3% versus the Adjusted EBITDA Margin of 1Q19.
Indebtedness and coverage indicators
As of March 31, 2020, Cementos Argos' financial debt as a separate company amounted
to 4.4 billion, of which 100% is in pesos, taking into account that the company has loans
in USD with coverage in local currency. The annual average cost of debt in pesos closed
at 7.42%.
Cementos Argos S.A.

CONDENSED INTERIM STATEMENT OF THE SEPARATE INTEGRAL
RESULT
For the three-month ended March 31 2020 and 2019 | Millions of Colombian pesos

                                                                                      2020           2019

Income from operations                                                           $    348.868    $    350.427
Cost of sales                                                                         268.966         280.010
Gross profit                                                                     $      79.902   $      70.417
Administrative expenses                                                                 57.350          69.865
Selling expenses                                                                        17.999          14.983
Other (revenues) expenses from operations, net                                         (3.243)           1.033
Operating profit (loss)                                                          $       7.796   $    (15.464)
Financial expenses, net                                                                 63.355          53.574
Foreign currency exchange gains, net                                                     2.373           3.354
Share of net gains of investments                                                       43.299          61.199
Loss before income tax                                                           $     (9.887)   $     (4.485)
Income tax                                                                            (14.038)          19.894
Net income                                                                       $       4.151   $      15.409

OTHER COMPREHENSIVE INCOME, NET OF TAXES

Items that will not be reclassified to profit or loss
Gains on new measurements of defined benefits obligations                                 1.002             -
Losses (gains) from equity investments measured at fair value                        (386.442)        127.057
Income tax on items that will not be reclassified to profit or loss                     (2.264)             -
Total items that will not be reclassified to profit or loss                      $     387.704 $      127.057

Items that will be reclassified to profit or loss
Net loss of cash-flow hedging instruments                                              (48.873)       (11.842)
Gains (losses) from foreign currency translation differences                         1.522.381       (163.497)
Income tax on items that will be reclassified to profit or loss                        (11.857)            400
Total items that will be reclassified to profit or loss                          $   1.461.651 $     (174.939)
Other comprehensive income, net of taxes                                         $   1.073.947 $      (47.882)

TOTAL COMPREHENSIVE INCOME FOR THE PERIOD                                        $   1.078.098 $      (32.473)
Cementos Argos S.A.
SEPARATE CONDENSED INTERIM STATEMENT OF FINANCIAL
POSITION
As of March 31, and December 31 | Millions of Colombian pesos
2020 2019
ASSET
Cash and cash equivalents $ 379.639 $ 42.678
Derivative financial instruments 96.853 355
Trade receivables and other accounts receivable, net 777.428 525.514
Tax receivable 135.247 190.254
Inventories 193.696 164.887
Other non-financial assets 22.130 27.539
Assets held for sale 30.434 31.626
Total current assets $ 1.635.427 $ 982.853
Trade receivables and other accounts receivable, net 139.759 130.174
Investments in subsidiaries 9.917.079 8.606.865
Investments in associates and joint Ventures 25.197 22.749
Other financial assets 573.415 967.959
Other intangible assets, net 277.516 286.184
Right-to-use assets to lease 284.353 294.570
Biological assets 20.638 20.638
Property, plant, and equipment, net 2.331.582 2.349.104
Investment property 95.775 95.775
Deferred tax asset 155.294 145.749
Total non-current assets $ 13.820.608 $ 12.919.767
TOTAL ASSETS $ 15.456.035 $ 13.902.620
LIABILITIES
Financial liabilities 1.277.827 767.084
Lease liability 36.240 41.900
Trade liabilities and accounts payable 766.618 541.175
Taxes, liens and duties 39.387 72.142
Employee benefits 77.751 79.001
Provisions 13.023 18.719
Derivative financial instruments 5.787 16.021
Outstanding bonds and preferred shares 30.424 30.937
Prepaid income and other liabilities 57.052 68.858
Total current liabilities $ 2.304.109 $ 1.635.837
Financial liabilities 306.256 151.957
Lease liability 194.636 199.100
Trade liabilities and accounts payable 1.407 1.137
Employee benefits 247.061 248.182
Provisions 35.157 36.524
Outstanding bonds and preferred shares 3.280.869 3.281.633
Prepaid income and other liabilities 17.417 17.464
Total non-current liabilities $ 4.082.803 $ 3.935.997
TOTAL LIABILITIES $ 6.386.912 $ 5.571.834
Issued capital 2.142.313 2.142.313
Treasury shares (113.797) (113.797)
Reserves 597.996 816.910
Retained earnings 2.152.105 2.260.710
Other comprehensive income 4.290.506 3.224.650
EQUITY $ 9.069.123 $ 8.330.786
TOTAL EQUITY AND LIABILITIES $ 15.456.035 $ 13.902.620FINANCIAL RATIOS – Consolidated Financial Statements
FINANCIAL RATIOS – Separated Financial Statements
CEMENTOS ARGOS S.A.
As of March 31, 2020, and 2019.
(Millions of Colombian pesos, except where otherwise indicated)

FINANCIAL INDEXES
                                                                                             March           March
                                                                                             2020            2019

Liquidity:
Current ratio - times                     Current assets / current liabilities                       0,71            0,52
Acid test                                 Current assets - inventory / current liabilities           0,63            0,45

Indebtedness:
Asset indebtedness                        Total liabilities / Total Assets                           0,41            0,42
Equity indebtedness                       Total liabilities/equity                                   0,70            0,74

Solvency:
Leverage                                  Total Assets / equity                                      1,70            1,74
Financial leverage                        (UAI / Equity) / (UAII / Total Assets)                     0,24            0,05

Profitability:
Net return on assets                      Net Profit / Total Assets                             (0,02)%         0,99%
Gross Margin                              Gross profit / operational income                     22,90%         20,09%
Operational margin                        Operating profit / Operating income                     2,23%       (4,41) %
Net Margin                                Net Profit / Operating income                         (1,19)%         4,40%

Others:
Working capital                           Current assets - current liabilities                (668.679)     (1.040.910)
EBITDA                                    EBITDA                                                 52.186          23.465
EBITDA Margin                             EBITDA Margin                                         14,95%           6,70%

UAI = Profit before taxes

UAII = Profit before taxes and interest
INFORMATIVE SUMMARY
Indicator Formula Meaning
Liquidity:
Current ratio– Current assets / current liabilities Indicates the Company's ability to meet its short-term
number of times debts by committing its current assets.
Acid Test- Current assets - inventory / Indicates the Company's ability to meet its short-term
number of times Current liabilities debts by committing its current assets without
considering its inventories.
Indebtedness:
Asset Total liabilities / Total Assets Reflects the leverage degree corresponding to the
indebtedness participation of creditors in the Company's assets.
Equity Total liabilities/equity Reflects the relationship between the own funds of the
indebtedness Company compared to the creditors.
Solvency:
Leverage Total Assets / equity Represents the degree at which the assets have been
obtained from own funds.
Financial (Profit before taxes / equity) / (
Leverage Profit before taxes and interest / Represents the return on equity over the return on assets.
Total assets)
Profitability:
Net return Net Profit / Total Assets Represents the ability of the total asset to generate profit,
on assets regardless of how it has been financed.
Gross Margin (Net sales - cost of goods sold) / For each peso received, how many pesos are generated in
Operating income gross profits.
Operational Operating profit / Operating For each income in pesos, how many pesos are generated
margin income in operational profits.
For each income in pesos, how many pesos are generated
Net
Net Profit / Operating income in profits, regardless of whether or not they correspond
Margin
to the development of the Company's corporate purpose.
Net return Net Profit / Total Assets Represents the ability of the total asset to generate profit,
on assets regardless of how it has been financed.
Others:
Represents the excess or defect of the Company's current
Working capital Current assets - current liabilities
assets to meet its short-term liabilities.
Operating profit + depreciation Represents the cash generated by the Company's
EBITDA
and amortization operations.
It represents the amount that, for each peso of income,
EBITDA Margin EBITDA / Operating income becomes the cash for paying taxes, supporting
investments, covering debt and distributing profits.You can also read