Tiger Brands Interim Results presentation - 20 May 2021
←
→
Page content transcription
If your browser does not render page correctly, please read the page content below
Tiger Brands
Interim Results presentation
20 May 2021
Index

Executive summary

Financial and operational review

Strategic update and outlook       Picture to be confirmed

                                                             2
Disclaimer

Forward-looking statement

This document contains forward looking statements that, unless otherwise indicated, reflect the company’s expectations as at
20 May 2021. Actual results may differ materially from the company’s expectations if known and unknown risks or uncertainties affect the business,
or if estimates or assumptions prove to be inaccurate. The company cannot guarantee that any forward-looking statement will materialise and,
accordingly, readers are cautioned not to place undue reliance on these forward-looking statements. The company disclaims any intention and
assumes no obligation to update or revise any forward-looking statement even if new information becomes available as a result of future events or
for any other reason, save as required to do so by legislation and/or regulation.

                                                                                                                                                     3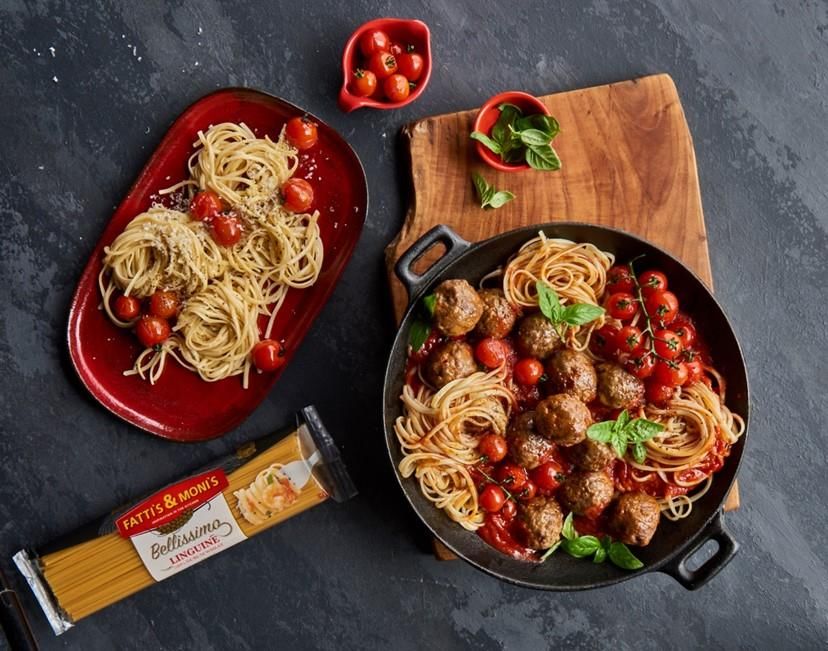
UNAUDITED GROUP RESULTS
for the six months ended 31 March 2021

Executive summary
Noel Doyle | CEO
                                         We nourish and nurture more lives every day
Market volumes decline as current economic climate impedes consumer
demand
With consumer demand declining it becomes a battle for share

Market Growth (%)                                           2021 vs. 2020                                  2021 vs. 2019

                                                  12MM             3MM       Mar 21 vs. Mar 20    6MM             3MM       Mar 21 vs. Mar 19
Defined basket                                      (5.9)           (14.2)               (24.7)    (4.9)            (4.4)                (7.5)
Grains                                              (6.9)           (15.2)               (26.2)    (6.2)            (5.0)                (8.2)
 Staples*                                           (8.2)           (14.8)               (24.7)    (7.4)            (6.8)                (9.8)
 Bakery                                             (7.0)           (12.5)               (17.0)    (5.3)            (5.3)                (6.6)
 Milling                                            (7.6)           (16.4)               (28.2)    (8.5)            (7.3)               (10.4)
 Cereals                                            (0.0)           (11.5)               (24.8)     2.8              1.9                 (2.6)
 Rice                                               (9.1)           (16.5)               (28.2)    (5.7)            (1.9)                (6.8)
 Dry Pasta                                          (0.2)           (15.7)               (36.1)     3.3              2.4                 (3.4)
Culinary                                            (0.8)           (14.4)               (28.9)    (1.1)            (2.1)                (5.0)
 Condiments                                          2.1             (8.3)               (18.5)     2.3              1.7                 (2.9)
 Canned                                             (3.9)           (18.8)               (35.6)    (5.3)            (7.4)                (9.9)
 Ingredients                                        (0.4)           (14.5)               (33.7)     1.5              2.0                 (0.0)
 Spreads                                             0.5            (16.2)               (28.4)     1.8              0.8                  0.7
Sweet Treats                                        (0.2)            (4.2)                (9.2)    (1.7)             1.2                 (0.7)
 Chocolate                                           0.8             (3.5)                (7.2)     1.1              4.5                  5.0
 Candy                                              (0.9)            (4.8)               (13.4)    (5.6)            (3.7)               (11.0)
 Healthy Bars                                      (21.0)           (18.0)               (13.8)   (15.5)           (14.0)                (9.1)
Beverages                                           (7.8)           (11.1)               (11.8)    (4.9)            (6.1)                (6.8)
Home care                                            3.4            (10.5)               (29.0)     7.8              3.4                 (6.5)
Personal Care                                       (2.2)           (10.9)               (17.1)    (0.2)            (1.4)                (6.6)
Baby                                                (0.9)            (7.1)               (17.7)     5.5              1.5                 (9.6)
* Aggregate of bread, maize, rice and dry pasta
                                                                                                           SOURCE: IRI VOLUME SHARE MARCH 2021
EXECUTIVE SUMMARY
                                                                                                                                                 5
Tiger grows long term volume ahead of the market while private label loses to
branded players
Marginal share loss in the short-term driven by volume losses as competitors respond with pricing

                    Total data set – volume share of basket                   12MM TY vs LY           3MM TY vs LY

                                                              All Other      -0,6             -0,7               All Other
             20,3            19,7        20,6        19,9
                                                              Competitor 8          0,0                  0,0     Competitor 8
              0,3            0,3                      0,3
              2,9            3,0         0,3                                        0,1
              0,6
              1,4            0,7
                             1,5         2,8          2,8     Competitor 7                               0,0     Competitor 7
                                         0,6          0,6
                                                      1,5
                                         1,4
              9,5            9,9                                                    0,0
                                         9,3          9,3     Competitor 5                               0,0     Competitor 5
              0,7            0,7
                                         0,6          0,8
                                                                                     0,4                 0,0
                                                              Competitor 4                                       Competitor 4
             21,8            22,1
                                         20,8        22,4                           0,1                  0,0
                                                              Competitor 3                                       Competitor 3
                                                                                    0,0                  0,1
             14,1            13,4                             Competitor 2                                       Competitor 2
                                         14,1
                                                                                    0,1                  0,1
                                                     13,7
                                                              Competitor 1           0,4                   1,6   Competitor 1

             27,6            27,8                             Own Brands     -0,7              -0,4              Own brands
                                         20,6        19,8

                                                              Tiger brands           0,3      -0,6               Tiger Brands
           12MM LY         12MM TY      3MM LY      3MM TY

SOURCE: IRI VOLUME SHARE MARCH 2021
EXECUTIVE SUMMARY
                                                                                                                                6
Tiger grows long term value ahead of the market while private label loses to
branded players
Marginal share loss in the short-term driven by volume losses as competitors respond with pricing

                    Total data set – value share of basket                  12MM TY vs LY           3MM TY vs LY

                                                             All Other      -0,3                             1,0   All Other
             23,7           23,0         22,3        22,2
                                                             Competitor 8           0,0       -0,1                 Competitor 8
                            0,6          0,7          0,7                           0,1
              0,7
                            2,3          2,2          2,2    Competitor 7                              0,0         Competitor 7
              2,2
              4,8           4,6          4,7          4,7
                            4,6          4,6          4,6                           0,0                0,1
              4,9                                            Competitor 5                                          Competitor 5
                            6,3          6,2          6,3
              6,2                                                                   0,1                0,0
              7,4           7,2          7,5          7,6    Competitor 4                                          Competitor 4
                                                                                     0,3               0,0
             12,8           12,8         13,0        12,7    Competitor 3                                          Competitor 3
                                                                                    0,0                  0,6
                                                             Competitor 2                                          Competitor 2
             10,8           12,6         13,2        13,0                    -0,2            -0,3
                                                             Competitor 1           0,1                  0,5       Competitor 1

             26,4           26,0         25,6        26,1    Own Brands     -0,4             -0,4                  Own brands

                                                             Tiger brands           0,2      -0,3                  Tiger Brands
           12MM LY        12MM TY      3MM LY       3MM TY

SOURCE: IRI VALUE SHARE MARCH 2021
EXECUTIVE SUMMARY
                                                                                                                                  7
Strong performance from majority of Billion Rand Brands over the long-term
& compared to 2019
Maize, Rice & Condiments face aggressive price-led promotional activity
                               12mm         3mm                                       12mm         3mm                              12mm         3mm
                                share       share                                      share       share                             share       share
                     Total                                                Total                                           Total
                               change      change                                     change      change                            change      change
                             ‘20 vs. ‘21 ‘19 vs. ‘21                                ‘20 vs. ‘21 ‘19 vs. ‘21                       ‘20 vs. ‘21 ‘19 vs. ‘21
          Volume      25,2       -2,0       -1,4             Volume        37,6          4,1       7,1          Volume     52,5       -1.6       -0,4

          Value       29,3       -2,8       -2,3             Value         41,5          2,9       5,6          Value      59,6       -1,2       -0,5

          Volume      10,3        0,1       -0,5             Volume        89,3          0,8       0,0          Volume     34,9       -3.0       3,4

          Value       11,2       -0,1       -0,5             Value         88,7          1,2       1,0          Value      36,8       -2,8       1,6

          Volume      25,5       -0,6       2,2              Volume        37,5          4,3       3,7          Volume     60,5        4.2       4,9

          Value       24,8       -1,1       1,2              Value         45,3          6,3       4,1          Value      65,3        3,8       3,9
                                                                                                                                             SOURCE: IRI

          Volume      32,9        1,7       0,2              Volume         7,7         -1.0       0,7

          Value       33,9        1,3       0,5              Value          6,3         -0,6       1,6

Share change        >5%         5% – 3%            3% – 2%      2% – 1%           1% – -1%         -1% – 2%   -2% – -3%   -3% – -5%          >-5%
EXECUTIVE SUMMARY
                                                                                                                                                            8
Gaining underlying momentum in increasingly challenging environment

                                               Clear prioritisation helps self-help initiatives gain traction

      Challenging environment                                     Pleasing momentum                                          Not quite there yet
• Q2 sees marked weakening in consumer demand           • Recovery in Other Grains, Groceries, S&T, Baby,         • Identification & execution of fewer, bigger
                                                          Exports (off low base) & International                    innovation opportunities
  - Decline in total market volumes
                                                        • Top line performance driven by strong Q1                • Private label opportunities slower than anticipated
• Price is the predominant tool driving competitor's
  response to market share gains                          - Despite high inflation, naked margin decline          • On-the-ground executional & insights capability in
                                                            remedied at gross margin by greater efficiencies        key export markets
• Currency impact on Deciduous Fruit                      - Volume challenges in OOH & Grains
                                                                                                                  • Deciduous Fruit (LAF) – another complex
                                                        • Positive operating leverage                               transaction
                                                          - Cost savings & efficiency initiatives gain traction
                                                            across all segments                                   • External market focus & confidence to take more
                                                                                                                    & bigger calculated risks (reticence to commit to
                                                        • Good management of working capital despite                capex)
                                                          stock build
                                                        • Proactive management of Covid-19 2nd wave
                                                          minimised disruption

EXECUTIVE SUMMARY
                                                                                                                                                                          9
UNAUDITED GROUP RESULTS
for the six months ended 31 March 2021

Financial and operational review
Deepa Sita | CFO
                                         We nourish and nurture more lives every day
Momentum achieved allows for long-term focus
Supply chain efficiencies & cost saving initiatives deliver ahead of expectations; IT rollout accelerated
Highlights Lowlights
• Gross margins steady at 30,6% • Capex disbursement behind expectations
• Effective cost control R250m - R381m
- Improved efficiencies and reduced waste - Business cases reviewed
• Good Working Capital trends • Soft commodity cost push resulting in
• IT rollout gaining traction naked margin compression & volume
pressure
- Embedding and enhancing the new IT
operating model
FINANCIAL AND OPERATIONAL REVIEW
11Improved financial performance driven by revenue growth & positive
operating leverage
HEPS & EPS in prior period impacted by VAMP losses & significant impairments, respectively
Revenue
Pricing 9% Volumes 1%
Revenue 8% to Gross profit 7% to Operating income* 16% at
R16,4bn R5,0bn R1,6bn
Total gross margin 0,3% to Total operating margin 0,7% at Effective tax rate 0,6% to
30,6% 9,6% 30,0%
Income from associates
12% to R177m
EPS >100% to HEPS 21% to Interim DPS
755cps 741cps 320 cps
From continuing operations | *Group operating income from continuing operations before impairments, abnormal items and IFRS2 charges
FINANCIAL AND OPERATIONAL REVIEW
12Rand strength leads to adverse period-on-period forex swing
Negatively impacting the translation of foreign currency cash balances
Rm H1 FY21 H2 FY20 % change
Operating income before impairments & abnormal items 1 579 1 334 18%
Impairments - (557) -
Abnormal items 43 (19) 326%
Operating income after impairments & abnormal items 1 622 758 114%
Net finance costs (29) (80) 64%
Foreign exchange (loss) / profit (56) 84 (167%)
Income from investments 13 12 9%
Income from associated companies 177 158 12%
Profit before taxation 1 726 931 85%
Taxation (461) (366) (26%)
Profit for the period from continuing operations 1 265 565 124%
Discontinued operations
Contribution from discontinued operations 135 (205) 166%
Profit for the period 1 400 360 289%
Basic EPS from continuing operations (cents) 754.9 333.3 126%
HEPS from continuing operations (cents) 740.8 612.7 21%
FINANCIAL AND OPERATIONAL REVIEW
13Cost saving initiatives are being tracked and monitored with clear lines of
accountability resulting in positive operating leverage
Largest contributors include improved procurement, material usage & waste reduction at Groceries, improved factory
performance in Jungle, reduction in distribution costs
Rm
(47) 81
51 77
55
1 575
1 358
H1 FY20*
Group Operating Income
OEE & factory efficiencies
Material usage variance
Procurement savings
Covid-related costs
Operational performance
H1 FY21*
Group Operating Income
*Group operating income from continuing operations before impairments, abnormal items and IFRS2 charges
FINANCIAL AND OPERATIONAL REVIEW
14Solid recovery across the portfolio
Driven by improved performances in Exports and International, solid demand in S&T and improved profitability
in Groceries
Grains Consumer Brands Home and Personal Care Exports and International
H1 FY21
7 464
6 777 H1 FY20
6 042 5 820
1 838 1 551
1 102 1 036
619 532 640 538 252 237 85 54
Revenue Operating Profit Revenue Operating profit Revenue Operating profit Revenue Operating profit
o Volumes muted by challenging market conditions
o Grains particularly impacted by adverse market conditions in Maize, while Rice and Pasta outperform
o Cost savings in Groceries benefited margins, Snacks & Treats showing signs of post-COVID-19 recovery
o Exports recover; resumption of trade into Nigeria improves demand
FINANCIAL AND OPERATIONAL REVIEW
15Grains
Cost savings across segments & recovery in Other Grains partly offset input cost inflation;
o Operating income up 16%
10% 16% 50 bps
• Albany grows market share over the period despite aggressive
price-led promotional activity in Q2
R7,5bn R619m 8,3% • Maize impacted by cost push & unfavourable mix
Revenue Operating profit Operating margin
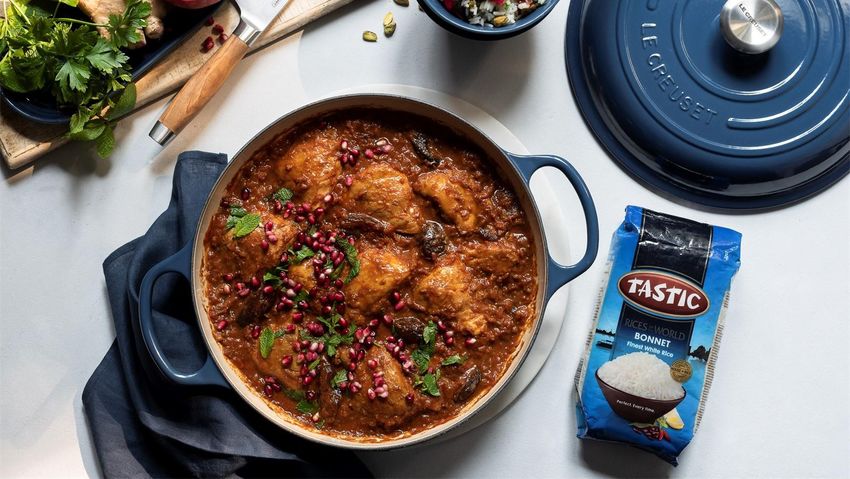
o Improved performance in Rice off a low base
• Driven by revenue growth
• Competitor pricing impacting category margins
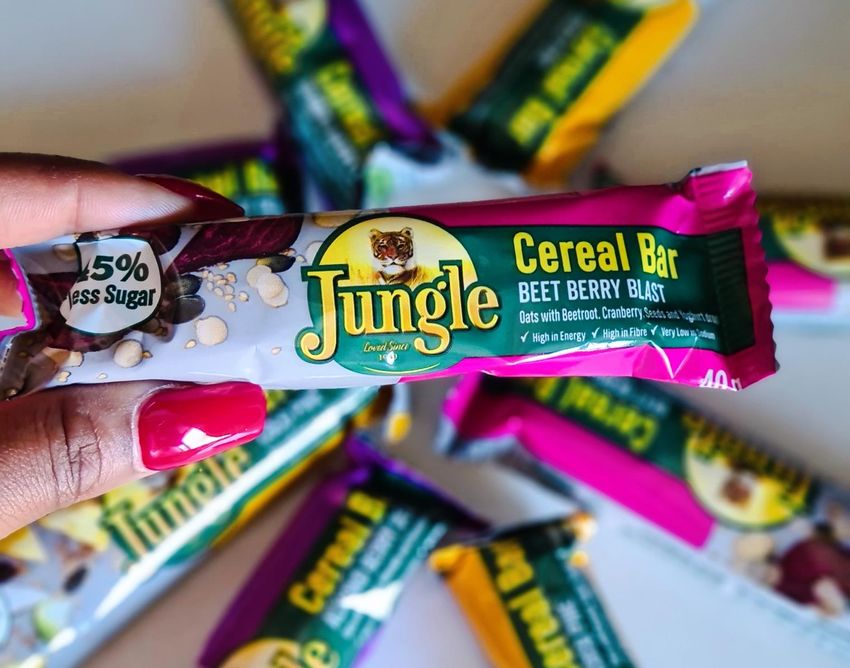
o Jungle continues to outperform
• Volumes growing ahead of market due to increased awareness
and better brand positioning
• Promotional activity (larger box size) helped volumes
• Focus on recent innovations (cereal bars, Jungle Plus) to drive
consumer awareness continues
o EBIT recovery in Pasta driven by improved factory performance
• Better service levels
FINANCIAL AND OPERATIONAL REVIEW
16Groceries
Significant margin uplift due to improved factory efficiencies
o Volume growth ahead of market
2% 31% 160bps
• Market share growth in Beans, Peanut Butter, Jams and
Spreads
R3,1bn R222m 7,2%
o Factory performance turnaround (OEE and waste improvement)
Revenue Operating profit Operating margin ahead of plan
• Resulting in significantly improved operating margin
o Launched KOO pilchards in Feb 2021
• Leverage strength of KOO to disrupt pilchard's category
• Strong in-store and market activations
• Well-received by customers & consumers
- Global fish shortage temporary interrupts momentum
FINANCIAL AND OPERATIONAL REVIEW
17Snacks & Treats
Recovery in volumes supported by chocolate and seasonal consumption
o Revenue increase driven by recovery in demand post lockdown
10% 32% 180 bps restrictions
• Supported by chocolate volumes in particular
R1,2bn R136m 11,1% • Long-term market share gains across segments
Revenue Operating profit Operating margin
o Margin improvement underpinned by:
• Optimal promotional activity and
• Improved factory efficiencies on the back of higher volumes
o Effective response to consumer demand
• Beacon Easter Eggs – optimal pack size architecture
FINANCIAL AND OPERATIONAL REVIEW
18Beverages
Core brands continue to show strong performance
o Back-to-School and Easter festivities bolstered growth across core
-% 5% 80bps brands
R948m R175m 18,5% o Market share gains driven by momentum in liquid concentrates
• Benefitting from core offering & innovation
Revenue Operating profit Operating margin
o Sports drinks volume recovery post lockdown slower than
anticipated
o Muted Black Friday volumes adversely impact Q2
o Operating profit increase driven largely by distribution efficiencies
FINANCIAL AND OPERATIONAL REVIEW
19Baby
Strong volume performances across segments
o Volume growth driven by strong performances in cereals, pouches
14% 21% 60 bps and medicinals
R544m R56m 10,3% o Strong market share growth in pouches
Revenue Operating profit Operating margin o Material costs and conversion well contained
o Positive operating leverage
• Favourable product mix and tight cost control
o Launch of Purity Junior
• Positive traction in Junior Smoothies
FINANCIAL AND OPERATIONAL REVIEW
20Home and Personal Care (HPC)
Sustained strong performance in Home Care offset by supply chain issues in Personal Care
o Home Care performance driven by good start to pest season
6% 6% 10 bps
• Increased demand for hygiene solutions
R1,1bn R252m 22,8% • Good factory performance – focused cost management and
solid OEE result
Revenue Operating profit Operating margin
o Personal Care performance impacted by supply chain issues
• Low opening stock levels
- Slow recovery due to COVID-19 related shut-downs
• Compounded by weak consumer demand offset in part by
successful Ingram’s campaign
• Increased costs and factory under-recoveries negatively impact
profitability
FINANCIAL AND OPERATIONAL REVIEW
21Exports and International
Recovery after resumption of trade in Nigeria
o Exports top line growth driven by resumption of sales into Nigeria
18% 58% 110bps
• Profitability improved despite adverse impact of industrial action
in Q2
R1,8bn R85m 4,6%
o Deciduous Fruit adversely impacted by soft post COVID-19 demand
Revenue Operating profit Operating margin in Asia, inability to take price increases in hard currency and
ongoing restrictions in Cape Town’s harbour
o Strong performance from Chococam despite challenging economic
environment
• Driven by improved distribution to neighbouring countries
• Successful trade and consumer activations in chocolate spread
o Low demand and customer credit challenges pose a risk to Exports
performance in the short-term
FINANCIAL AND OPERATIONAL REVIEW
22Creditors remain a focus area while debtor collections are well controlled
Inventory impacted by stock building initiative in anticipation of third wave
3 days Rbn
1H FY21 3,7
32 o Strong collections across the portfolio
1H FY20 3,9
Debtor days
7 days
1H FY21 2,5
o Impacted by payment terms on imports &
29 timing of purchases
1H FY20 2,6
Creditor days
6 days
1H FY21 6,0
o Building stock in anticipation of a third
95 COVID-19 wave
1H FY20 5,3
Inventory days
FINANCIAL AND OPERATIONAL REVIEW
23Progress on key deliverables
Significant progress on cost management and working capital; capex requires focus
Systematic and Continued Adoption of Continuous Improved capex
continuous cost working capital alternative solutions assessment of approval and
management optimisation to actively manage category fit execution process
forex exposures
• Cost savings of R257m • Strong debtors' • Work in progress with • Deciduous Fruit • Accelerate submission
achieved to date collections resulted in a banking partners to disposal/evaluation of of delayed business
strong net cash position develop a more flexible alternative options cases (where possible)
• Strong improvements in at period-end forex policy in terms of
Material Usage and period and instruments • Ongoing review of UAC • Full year capex ~R1bn
Waste metrics • Higher stock levels of
both raw materials and • Received approval from
finished goods due to Audit Committee
deliberate stock build in chairman to run a
anticipation of COVID-19 proposed pilot on one
3rd wave; in turn category
impacting creditors days
due to payment terms on • Pilots for additional
imports & timing of categories to be scoped
purchases
FINANCIAL AND OPERATIONAL REVIEW
24UNAUDITED GROUP RESULTS
for the six months ended 31 March 2021
Strategic update and outlook
Noel Doyle | CEO
We nourish and nurture more lives every dayThe honeymoon is over
Hard work for the longer-term lies ahead
Clear priorities
• Resolve remaining category value chain conundrums
• Conclude Deciduous Fruit transaction
• Over-index on innovation to reduce dependence on price as market share recovery tool
− Excel in communication and response to digital environment
• Have the foundation in place by year end for high growth in the rest of Africa in FY22
• Operationalise VC Fund - early access to growth opportunities
• Work on a more courageous culture (organic & inorganic growth)
STRATEGIC UPDATE AND OUTLOOK
26UNAUDITED GROUP RESULTS
for the six months ended 31 March 2021
Q&A
We nourish and nurture more lives every dayUNAUDITED GROUP RESULTS
for the six months ended 31 March 2021
Appendix
We nourish and nurture more lives every dayTotal revenue increased 8% to R16,4 billion underpinned by price increases
Volumes impacted by Out of Home and some volume pressure in Grains
Rm Price inflation 9% Volume (1%) Rm
Total Price Volume Forex
Grains 10% 15% (5%) -
Consumer Brands 4% 6% (2%) -
16,4
15,2 HPC 6% 1% 5% -
Domestic operations 7% 10% (3%) -
Exports & International 19% 3% 12% 4%
Total cont. operations 8% 9% (1%) -
H1 FY20 Price Volume H1 FY21
APPENDIX
29Grains hold steady, with growth in bread and pasta offset by declines in flour
and rice
50%
44,4%
45% 41,5%
39,0% 39,6%
40%
33,9%
35% 32,6%
30% 27,2% 27,2%
25,8% 24,8%
25% 21,5% 21,1%
20%
15% 11,3% 11,2%
10%
5%
0%
Grains Maize Flour Cereals Rice Dry Pasta Bread
12MM LY 12MM TY
SOURCE: IRI 12MM TIGER VALUE SHARE MARCH 2021
APPENDIX
30Spreads & canned beans experiencing growth; condiments impacted by
price-led competition
70% 65,3%
61,5% 61,0% 59,7%
60%
50%
39,6% 39,4% 39,6%
40% 36,8%
31,1% 31,8%
30%
20%
10%
0%
Groceries Beans Tomato Sauce Peanut Butter Mayo & Salad Cream
12MM LY 12MM TY
SOURCE: IRI 12MM TIGER VALUE SHARE MARCH 2021
APPENDIX
31Snacks & Treats
Visible market share gains attributable largely to Chocolate (in particular moulded slabs) and Candy
50%
44,1%
45% 42,0%
40%
35%
29,1% 30,2%
30%
25% 21,5%
20,9%
20%
15% 12,5% 12,6%
10%
5%
0%
Snacks & Treats Chocolate Candy Novely & Speciality
12MM LY 12MM TY
SOURCE: IRI 12MM TIGER VALUE SHARE MARCH 2021
APPENDIX
32Overall beverages share growth driven by continued momentum in liquid
concentrates
Benefitting from core offering & innovation
60%
53,0%
50,3%
50% 45,6%
47,3% 47,1%
44,5%
40%
30%
18,6%
20% 16,1%
10%
0%
Beverages Dilutables Sports Drinks RTD Juice
12MM LY 12MM TY
SOURCE: IRI 12MM TIGER VALUE SHARE MARCH 2021
APPENDIX
33Market shares maintained across all categories
70%
59,2% 58,6% 59,3% 59,8%
60%
50%
40%
30%
20%
9,6% 9,1%
10%
0%
Home Care (Pest) Personal Care Baby Nutrition
12MM LY 12MM TY
SOURCE: IRI 12MM TIGER VALUE SHARE MARCH 2021
APPENDIX
34Contribution to revenue and operating income
Revenue Operating income before IFRS 2
32% 37%
31%
30%
20%
19%
15% 17%
16%
13% 14%
11% 13% 12%
10% 11%
7% 7% 6% 9% 9%
6% 7% 7% 8%
5%
3% 3% 3% 3% 4% 3% 4%
2% 2% 3%
1H FY21 1H FY20 1H FY21 1H FY20
Milling and Baking Other Grains Groceries
Snacks & Treats Beverages Out of Home
Baby Home and Personal Care (HPC) Exports and International
APPENDIX
35You can also read