Sheffield Housing Market Bulletin - April - June 2018 - Sheffield City Council
←
→
Page content transcription
If your browser does not render page correctly, please read the page content below
Sheffield
Housing Market Bulletin
       April – June 2018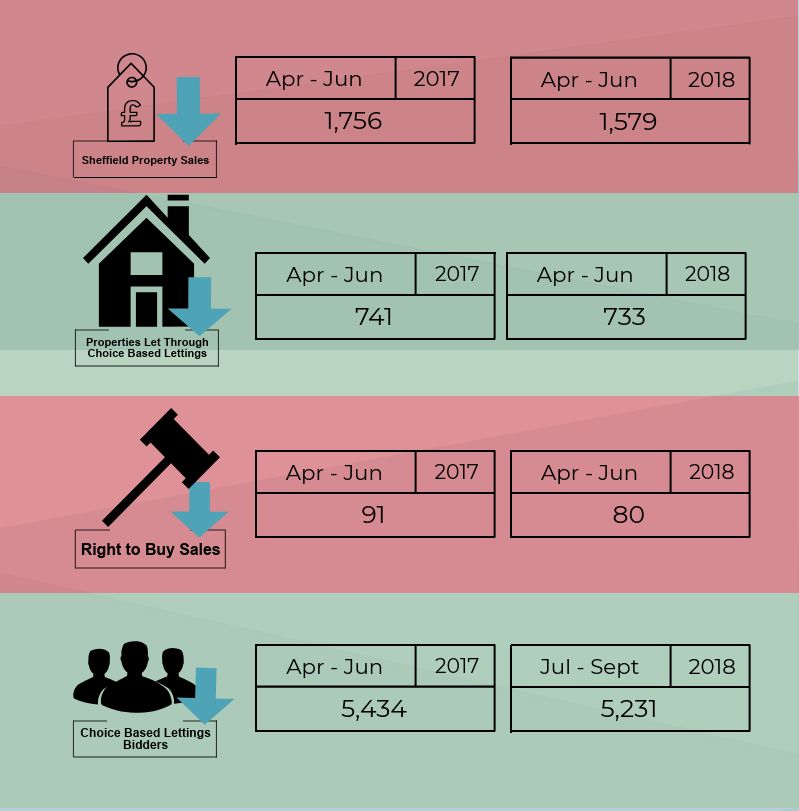
What’s been in the news? Expanding supply and supporting home ownership
This section describes some of the main stories reported in the media Effective resolution of complaints
about the national and local housing market, and other recent related
Empowering residents and strengthening the regulator
housing issues.
Ensuring homes are safe and decent
National News The Government also announced that it no longer intends to implement
the forced sale of higher value council properties or the requirement on
Revised National Planning Policy Framework councils to grant future tenants fixed-term tenancies proposed under
The National Planning Policy Framework (NPPF), which sets out the the Housing and Planning Act 2016.
Government’s Planning policies for England, was revised in July and Consultation on the Green Paper is open to everyone and Sheffield City
included some important changes which will potentially impact on the Council will be providing its response to the specific consultation
delivery of new housing. These include: questions, which can be found here.
A direction to approve sustainable development plans without delay
if they are in line with an up-to-date development plan. English Housing Survey 2016/17
A new Housing Delivery Test that, from 2020, will require local A series of reports from the English Housing Survey 2016-17 covering a
planning authorities to implement an action plan if housing delivery range of topics were published by the Government. Some of the key
has fallen below 95% of the area’s housing requirement over the findings included:
previous 3 years. The proportion of owner occupiers under 35 halved from 18% in
Major housing developments should provide at least 10% of the 1996/7 to 9% in 2016/17.
homes to be available for affordable home ownership unless this The private rented sector increased from 2.1 million households in
would exceed the level of affordable housing required in the area, 1996-7 to 4.7 million households in 2016-17, and now accounts for
with some exceptions applicable. 20% of households in England.
A new Affordable Housing definition which includes Starter Homes The number of private renters has increased across all age groups
and build-to-rent, discounted market sale housing and “other with the exception of those aged 75+.
affordable routes to home ownership”.
The social rented sector is the smallest tenure in England and
The revised Framework can be downloaded from here. accounts for 17% of all households, with 10% renting from housing
associations and 7% from local authorities.
Social Housing Green Paper
The proportion of social renters in work has increased over the last
The Government issued its social housing green paper – A new deal for decade.
social housing – in August, which set out proposals for reforming social
housing based around five core themes: The full reports can be downloaded here.
Tackling stigma and celebrating thriving communitiesLocal News were some of the reasons mentioned by local letting agents for this
popularity.
New Strategic Housing Market Assessment for Sheffield The article published by the Sheffield Star can be accessed here.
Almost one in ten Sheffield households were asked to complete a
household survey to help the Council understand current and future
housing needs in the city. Market Housing
The survey is an essential element of the Strategic Housing Market Table 1: Market housing information
Assessment (SHMA), which the Council has a statutory duty to 3 12
undertake. A key aim of the assessment is to determine the affordable 3 month 12 month
Current months months
housing requirements for the city, including the different sizes and types change change
ago ago
of affordable housing needed. Sheffield
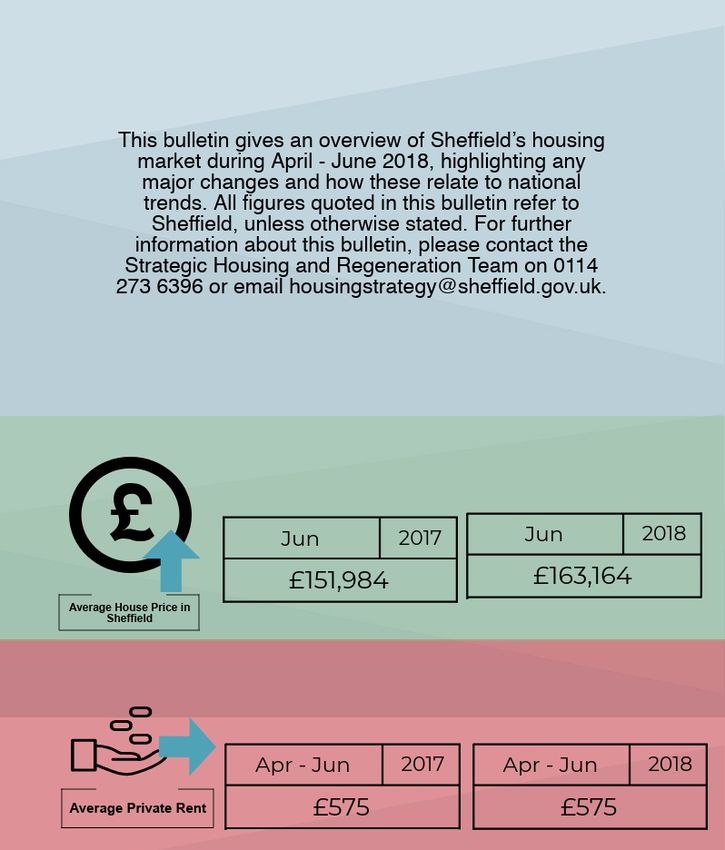
property 1,579 1,604 1,756 -1.56% -10.08%
The assessment includes both Sheffield and Rotherham local authority
sales
areas, and is being carried out by the Centre for Regional Economic
and Social Research (CRESA) at Sheffield Hallam University. Only Sheffield
average time 68 days 89 days 73 days -16 days +5 days
households who received a letter from CRESR were able to take part in
on the market
the survey. The households were chosen at random using a method
designed to cover all areas of the city and all types of housing. Sheffield
average £163,164 £160,498 £151,984 +1.66% +7.36%
The new Sheffield SHMA report will be available early in 2019 and more house price
details about it can be found here. Average
house price – £245,076 £240,513 £238,595 +1.90% +2.72%
Sheffield postcodes in Yorkshire’s top 10 property spots England
Six of Sheffield’s postcodes were included in Yorkshire’s top ten Average price
property hotspots. They included neighbourhoods in the south east and by first time
£142,227 £140,085 £132,936 +1.53% +6.99%
buyers -
south west of the city, as well as areas closer to the city centre.
Sheffield
The Sheffield postcodes were: S10 (Ranmoor, Fulwood and Crookes), Average price
S7 (Nether Edge, Abbeydale), S8 (Beauchief, Norton, Woodseats), S20 by existing
£180,689 £177,507 £167,791 +1.79% +7.69%
(Mosborough), S11(Sharrow, Brincliffe and Whirlow), and S6 owners -
(Hillsborough). S10 was listed as number one, with S7 and S8 in Sheffield
second and third places respectively. Sheffield
average £575 £575 £575 0.00% 0.00%
The findings were published by the TheAdvisory website, which private rent
provides information for house sellers, and were reported by the Median time
Sheffield Star. Sheffield’s relative affordability, closeness to open on market 46 days 44 days 46 days +2 days 0 days
countryside, high graduate retention rates and number of big employers PRS
Source: Land Registry and RightmoveProperty Sales House Prices
Property sales fell in Sheffield during April – June compared to both the Sheffield’s average house price increased by 7.36% to £163,164 in the
previous quarter (-1.56%) and one year earlier (-10.08%). Falling sales twelve months, to June. This growth was well above the national
are likely to reflect issues with supply rather than demand however, in average (2.72%), which was dampened by stagnating house prices in
light of the growth in house prices that occurred in Sheffield during this London, where the average house price increased by just 0.39% during
period. The Royal Institution of Chartered Surveyors reported that June this period.
saw the 16th consecutive fall in agreed house sales in the UK, with the The increase in Sheffield’s average house price was also higher than
lack of available second hand stock continuing to be a key factor. the regional increase for Yorkshire and Humber (3.2%). Sheffield’s
The average time on the market for unsold properties in June was increase was driven by the growth in prices for detached, semi-
sixteen day less on average compared to three months earlier but this detached and terraced properties, which all increased by more than 7%
varied significantly by property type. While detached properties were over the previous year. The increase in the average price for flats was
typically spending just 46 days on the market, flats were spending more significantly lower at 4.2% (Chart 2).
than two and half times this length of time (119 days) before being sold.
Evidence of this being part of a longer term trend is shown in Chart 1, Chart 2: Change (%) in average price by property type June 2013 – June
which shows that unsold detached, semi-detached and terraced 2018
properties had typically been on the market for a much shorter period in 9.0%
June compared to five years earlier. In contrast, unsold flats had 7.9%
typically spent 13% longer on the market compared to June 2013. 8.0% 7.5%
7.2%
7.0%
Chart 1: Change (days) in median time on market June 2013 - June 2018
6.0%
5.0%
4.2%
4.0%
3.0%
2.0%
1.0%
0.0%
Detached Semi Terraced Flat
Source: Land Registry
The high proportion of flats among city centre sales figures is likely to
be one of the reasons why this housing markets area was one of the
few areas that did not see an increase in its average house price over
Source: Home.co.uk
the year to June 2018. The only other housing market area which saw afall in its average house price was Chapeltown and Ecclesfield, where Social Housing and Housing Need
prices fell on average by 3.4%.
Table 2: Social housing/housing need information for Sheffield
Private Rent Levels
3 12 12
3 month
The median monthly private rent for properties advertised in Sheffield Current months months month
change
between April and June remained unchanged at £575. The typical two ago ago change
bedroom property was being advertised for £650 but for properties with Choice based
733 878 741 -16.51% -1.09%
four or more bedrooms the median rent was £1,000. Shared properties lettings (SCC)
were typically being advertised for £275 per person. Choice based
943 1135 972 -16.92% -2.98%
lettings (All*)
Rents for student properties, which made up 22% of the properties Average
advertised during this quarter, were typically around £390. The majority 20 29 -9 -3
waiting time – 23 months
(59%) of these were in the City Centre West housing market area, months months months months
non priority
which is one of the main rental areas for students. Average minus
no
waiting time – 2 months 2 months 4 months two
The City Centre West HMA was one of just three areas to see a fall in priority
change
months
the median private rent over the past year, which could suggest falling
demand from students. The only other housing market areas to see a Active bidders 5,231 4,947 5,434 +5.74% -3.74%
fall in their median rents during this period were the Peak District and Right to Buys 80 98 91 -18.37% -12.09%
Rural Upper Don Valley. Both of these areas are on the rural fringes of Mortgage
the city and their median rents still remained well above the city repossession 29 32 52 -9.38% -44.23%
average, at £725 and £625 respectively. court claims
Mortgage
repossession 13 17 21 -23.53% -38.10%
court orders
Actual
mortgage 9 9 12 0.00% -25.00%
repossessions
*Includes Registered Providers. Source: Sheffield City Council and Gov.UK
Choice Based Lettings
The number of social rented properties let through choice based lettings
fell by nearly 3% compared to the same quarter in 2017. The fall was
mainly due to 10% fewer lettings to housing association properties.
Over half (55%) of the lettings were made to flats, and 5% were for
sheltered properties. Nearly half (46%) of lettings were for one bedroom
properties but there were just seven lets to properties with fourbedrooms, reflecting the limited supply and small turnover of these Mortgage Repossessions
larger properties.. The number of mortgage repossession court claims and orders both fell
The number of active bidders grew in comparison to the previous significantly compared to the same quarter in the previous year. During
quarter but the average waiting time for applicants without a priority fell this period nine homes were repossessed in Sheffield, representing a
by nine months. Average waiting time for priority applicants remained fall of 25% compared to the same period in 2017.
unchanged from the previous quarter at two months and was lower than The number of UK homeowner mortgages in arrears are at their lowest
in the same period in 2017. since records began in 1994, which according to UK Finance was
helped by low interest rates and lenders supporting borrowers through
Right to Buy Sales periods of temporary financial difficulty wherever possible.
The number of Right to Buy fell this quarter in comparison to the
previous three month period and to the same period one year earlier.
There were no obvious reasons for this fall and the Council is still Economics and Benefits
expecting its forecast of 350 sales over 2018 to be achieved.
Table 3: National interest and inflation rates
Although the Government has committed to extend the Right to Buy to 3 12 12
assured tenants of housing associations, the announcement in the 3 month
Current months months month
recent Green Paper that it does not intend to implement the forced sale change
ago ago change
of higher value council properties to help fund this extension has left
National Base Rate 0.50% 0.50% 0.25% 0.00 -0.25
questions about how the commitment will be funded.
Average Standard
4.06 4.14 4.28 -0.08 -0.22
Homelessness Variable Rate
The implementation of the Homeless Reduction Act in April 2018 made Average 5 year
2.03 2.02 1.99 0.01 0.04
significant changes to the way housing authorities must tackle fixed rate, 75% LTV
homelessness, and also to the way homelessness figures are recorded. Average 5 year
4.38 4.44 4.74 -0.06 -0.36
It has therefore not been possible to include accurate figures for fixed rate, 95% LTV
homelessness presentations and acceptances for this quarter, and 12 month inflation
these figures have consequently been omitted from Table 2. 2.3% 2.3% 2.6% 0.0 -0.3
rate (CPIH)
The Act modified or extended existing homelessness protection in a *n/a – not available at present. Source: Bank of England
number of key areas, including new duties on housing authorities to
prevent and relieve homelessness for all eligible people. More Interest Rates
information about the changes introduced by the Homeless Reduction The Bank of England voted to hold the national base rate at 0.5%. It
Act can be found here. had been expected to raise the rate in May but weaker economic
New indicators will be used in future editions of the bulletin to identify conditions at the start of the year, partly due to harsh weather
trends in homelessness. These will include an indicator for the number conditions, helped to deter this. The Governor of the Bank of England
of homeless preventions being achieved in Sheffield to reflect the new confirmed, however, that there will be further interest rate rises although
duties being placed on local authorities. these will be “limited and gradual”.The Libor rate – the interest rate at which banks lend to each other – is Table 4: National mortgage lending information
no longer published by the Bank of England will no longer be reported
3 12 12
in the bulletin. The Bank of England and Financial Conduct Authority 3 month
Current months months month
are currently looking at a replacement interest rate benchmark to change
ago ago change
sterling Libor. Average %
15.0% 16.6% 17.1% -1.62 -2.1
deposit - FTBs
Mortgage Rates Average %
There were only slight changes to the main types of mortgage interest deposit - home 26.4% 27.0% 27.0% -0.6 -0.6
rates during this quarter, reflecting the Bank of England’s decision not movers
to change its base rate. Average income
3.65 3.60 3.59 +0.05 +0.06
multiple – FTBs
The typical Sheffield homeowner on the average standard variable rate
Average income
mortgage would have monthly mortgage payments of £653, around £15 multiple – home 3.43 3.41 3.39 +0.02 +0.04
less than one year ago. Mortgage payments for the typical Sheffield movers
homeowner with a 5 year fixed rate, 75% loan to value mortgage are Total new
likely to be paying just £2 more than one year ago. mortgages for 199,900 173,500 201,700 15.22% -0.89%
house purchase
Inflation Rates New FTB
93,800 79,800 91,400 17.54% 2.63%
The Consumer Price Index including owner occupiers housing costs mortgages
(CPIH) 12-month rate remained unchanged from the previous quarter. New Buy-to-let
15,900 16,300 18,100 -2.45% -12.15%
The rate has fallen steadily from 2.8% in autumn 2017 and housing and mortgages
household services were contributing a slightly lower proportion to the Source: UK Finance
overall rate in comparison to one year earlier. A falling inflation rate
helps to ease pressure on the Bank of England to raise interest rates. Deposits
The CPIH is the most comprehensive measure of inflation. It extends The average deposit paid by first time buyers fell to 15.0% of the
the CPI to include a measure of the costs associated with owning, property value in May. This would mean first time buyers in Sheffield
maintaining and living in one’s own home, known as owner occupiers’ paying a typical deposit of £21,334, and suggests that the Help to Buy
housing costs (OOH), along with Council Tax. Both of these are Equity Loan scheme and the increased number of 95% loan to value
significant expenses for many households and are not included in the mortgages that banks are now offering are likely to remain an important
CPI. enabler for many local first-time buyers to access home ownership.
The average deposit percentage paid by home movers also fell in May,
although by a smaller amount than for first-time buyers. In Sheffield, a
typical home mover would have been paying a deposit of £43,075 in
June but due to house price inflation this was still £2,040 more than
twelve months earlier.Mortgages
Figures published by the ONS2 in April also showed the growing
First time buyers made up a larger proportion of the mortgage market in
April-June compared to twelve months earlier and analysis by Savills1 unaffordability of home ownership for Sheffield’s first time buyers. In
2017 lower quartile house prices (£109, 950) in Sheffield were 5.57
showed that the number of first time buyers has been steadily
times the lower quartile annual earnings (£19,731), which was the
increasing since 2008. The report by Savills identified a series of
highest ratio since 2010.
government-led initiatives such as Help to Buy as a key factor in the
increasing number of new build homes sold to first time buyers.
Table 5: Jobseeker’s Allowance & Universal Credit (UC) due to
Despite this growth, the affordability of home ownership for first time
unemployment claimant information
buyers has actually declined in the UK since 2009. The average
mortgage amount borrowed by first time buyers was 3.1 times the 3 12 3 month 12
average first time buyer income in June 2009, compared to 3.65 in June JSA/ Universal months months change month
Current
2018. For home movers this multiple increased from 2.9 to 3.43 over Credit claimants ago ago change
the same period (Chart 3). A key factor contributing to this is likely to be Claimant rate –
house prices growing faster than earnings during this period. 2.3 2.5 2.5 -0.20 -0.20
Sheffield
Claimant rate –
2.1 2.1 1.9 0.00 0.20
England & Wales
Chart 3: Average mortgage income multiples for FTBs and Home Movers Number of all
claimants – 8,865 9,560 9,340 -7.27% -5.09%
Sheffield
Number of
claimants aged 18- 1,840 2,000 2,050 -8.00% -10.24%
24- Sheffield
Source: ONS experimental dataset.
The claimant rate for Sheffield arising from unemployment fell in June
compared to three months earlier, although the national rate remained
unchanged over the same period. There were 695 fewer claimants in
June compared to May, including 160 fewer claimants among younger
people aged between 18 and 24.
Source: UK Finance / Council of Mortgage Lenders
1 2
Market in Minutes: New homes and first time buyers, June 2018 (Savills) House price to workplace=based earnings ratio, April 2018 (ONS)Table 6: Housing Benefit claimant information
3 12 3 12 Technical notes
Current months months month month
1. The average house price is based on the last month within the given quarter e.g.
ago ago change change for April-June the house price is taken from June.
Total number of 2. The sales information for Sheffield is gathered from the Land Registry,
45,883 46,013 46,970 -0.28% -2.31%
HB claimants 3. Average price paid by first time buyers and previous home owners is now
Number of social included as it allows us to further understand the market and affordability.
37,422 37,479 38,052 -0.15% -1.66%
HB claimants 4. Some of the figures from 3 and 12 months ago may look different to those
published as ‘current’ in previous bulletins. This is because many of the data
Number of private
8461 8530 8,915 -0.81% -5.09% sources used to compile the bulletin are continuously updated and revised
HB claimants retrospectively.
Source: Department of Works and Pensions 5. The private rented data is gathered from the Right Move database, which is
based on data from the majority of the United Kingdom’s estate agents.
The number of people claiming Housing Benefit remained steady, with 6. Actual repossessions are now included in the bulletin as they show the actual
numbers of people that lose their homes. Not all court claims and court orders
only a slight reduction of 0.28% in May compared to three months
lead to repossession.
earlier. The most significant fall has been among private claimants,
7. Housing Benefit claimants are included in the bulletin as they give an indication of
whose number reduced by 5.09% over the year to May. the changes in the economy and will help us measure the impact of Welfare
Although the fall among claimants in the private sector could be Reform. This is collected from the Housing Benefits service and has a 1 month
delay.
indicative of a reduced need for support with rent, a survey featured in a
8. Lettings information for Registered Providers’ properties is included now that it is
recent report by Shelter and the National Housing Federation3 found
available from Abritas, the Choice Based Lettings software application which is
that almost a third of people receiving housing benefit said they hadn’t being used by the Council.
been able to rent a home in the private sector due to a ‘No DSS’ policy
in the last five years.
3
Stop DSS Discrimination: Ending prejudice against renters on housing benefit, August 2018
(Shelter & National Housing Federation)You can also read