Auckland Airport Interim Results December 2010 - 24 February 2011
←
→
Page content transcription
If your browser does not render page correctly, please read the page content below
24 February 2011

Auckland
Airport

Interim Results
December 2010

Notes
This interim results presentation dated 24 February 2011 provides
additional comment on the media and financial materials released at
the same date. As such, it should be read in conjunction with, and
subject to, the explanations and views provided in that release.   2

Simon Moutter
Chief Executive

Simon Robertson
Chief Financial Officer

                          3
Transformation is paying off
Recent results confirm the
successful business change to a
sales-led driver of growth.
Increased airline capacity and
connectivity from world-class
route development and
promotional activity.
Expanded airport footprint in
Australasia increasing influence
with airlines.
Substantial benefits for our
markets from the stimulus to
travel, trade and tourism.
Increased profits flowing.

                                   4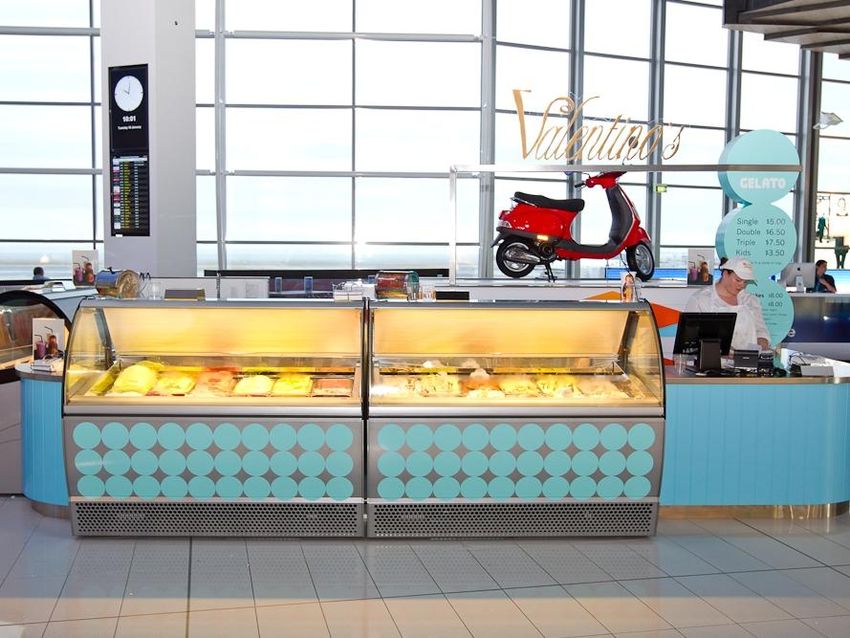
Changing shape of travel markets
Our Flight-path for Growth strategy
launched in March 2009 had a
significant emphasis on Asia
passenger growth.
“Rapidly developing markets are
shifting the industry’s centre of
gravity to the East” - Giovanni Bisignani,
Director General of the International Air
Transport Association (“IATA”).
Asian passenger growth to NZ was
20% in the six months to December
2010.
Exposure to high growth markets is
essential and the link between air
services development and economic
growth is clear.

                                             5
Strategy translating to profits
Air services development and                              6 months    6 months
route promotional activity                               31 Dec 2010 31 Dec 2009
underpin international passenger     Total Income
                                                          198,270     182,371      Up 8.7%
volume increase – our key value      ($'000)
driver.
                                     EBITDAFI ($'000)     151,001     138,300      Up 9.2%
Improved passenger services,
facilities and products have         Underlying Profit
                                                           61,536      53,964      Up 14.0%
grown retail yield.                  ($'000)

Disruption of duty-free model,       Interim Dividends
                                                           52,720      48,838      Up 7.9%
aeronautical price path and retail   ($’000)
construction inherent in FY2010
is clearing in FY2011.
Operating leverage delivering
uplift to the bottom line and
dividends to shareholders.

                                                                                         6
Further evolution of growth strategy
Our vision is to build a great New Zealand business
recognised as a world leader in creating value from
modern airports
Vision statement refined to reflect
our clear airport focus in line with
our core competencies.
                                                              CORE
Reflects today’s reality of our                    Adding value to and enabling
                                                efficient movement of people and
interests in four airports.                           goods between land and
                                                       air side at our airports
Core competencies enable the
business to add value to the                            ADJACENCIES
movement of people and goods at        Business activities closely related to, or leveraging off,
                                           our core airport business, such as investment
our airports and to further               property, accommodation, tourism, transport,
leverage this through adjacent                              advertising, etc
business activities.

                                                                                                    7
Delivering on the growth plan
To grow value in our airports for investors we will:
Further increase investment in air services
and market development to grow passenger
volumes faster than the market organic rate.
Expand and actively market the range of
products and services that benefit
passengers.
Strive for even more efficient passenger
processes.
Provide stimulus for property development
opportunities that create value in our land
holdings.
Leverage off revenue growth to deliver
increasing earnings per share.

                                                       8
Financial results in detail

                              9
Results overview
                                                 6 months        6 months
                                                                                % Change
                                                31 Dec 2010     31 Dec 2009
                                                    $m              $m
Income                                                  198.3           182.4       8.7%
Expenses                                                 47.3            44.1       7.3%
EBITDAFI (Earnings before interest, taxation,
depreciation, fair value adjustments and                151.0          138.3        9.2%
investments in associates)
Share of profit of associates                             0.8             0.5      69.3%
Gain on sale of associates                                1.2               -          -
Investment property fair value increases                  2.3               -          -
Derivative fair value change                              1.4               -          -
Depreciation                                             28.7            27.2       5.5%
Interest                                                 35.8            35.0       2.1%
Taxation                                                 26.8            22.6      18.5%
Reported net profit after tax                            65.5            54.0      21.4%

                                                                                           10
Passenger volume growth
International passengers grew 5.0% in
the six months to December 2010
compared with prior year.
Modest domestic passenger growth of
2.6% in the six months to December
2010, but with declining volumes
evident post the withdrawal of Pacific
Blue.
International passenger growth remains
strong with January 2011 up 6.2%.
The reducing growth trend in domestic
passengers continued with January
2011 down 7.8% reflecting lack of
capacity replacement for Pacific Blue
services.
11Market shift in international arrivals
Arrivals from Asia increased 20.0%
in the six months to December
2010 over pcp, with significant
growth from China (39.3%), Japan
(24.1%) and India (26.1%).
New Zealand passengers still a
key market at 48.4% of total
arrivals and also showing growth.
Australia remained stable, making
up 18.9% of total arrivals.
Arrivals from Europe and North
America both decreased 9.1% and
2.8% respectively. Source: Statistics New Zealand
12Aircraft movement trends
International flight movements increased 2.3% in the 6 months to December 2010. The use
of A330 and B767 aircraft decreased, however an increase in the use of heavier B777 led to
an overall increase in international MCTOW of 3.3%.
Domestic flight movements increased 0.3% in the 6 months to Dec 2010. The departure of
Pacific Blue was the main contributor to an overall decrease in domestic MCTOW of 4.1%.
13Growth strategy evident in revenue
Airfield income increased 11.7% 6 months 6 months
on the back of increased volumes 31 Dec 2010 31 Dec 2009
$m $m % change
and reversion to the pricing
schedule post the GFC Airfield income 36.7 32.8 11.7%
discounted landing charge Passenger service charge 39.4 36.5 8.2%
period.
Terminal services charge 13.9 13.9 -0.3%
Retail revenue grew significantly Retail income 54.8 48.5 12.9%
through both volume and yield
Rental income 25.6 24.5 4.5%
from successful initiatives across
a range of retail activities. Car park income 17.1 15.9 7.6%
Interest income 0.6 0.9 -40.6%
Property development set for
future growth from developments Other revenue 10.2 9.3 10.1%
currently underway and soon to Total revenue 198.3 182.4 8.7%
be earning rents.
Car park revenue boosted by new
online booking system and
marketing approach.
14Expenses controlled
Expenses grew by only $3.2m
relative to income increase of
$15.9m
Major component of expenditure
increase is $1.5m increase in
marketing and promotional
activities associated with
aeronautical route development.
Aeronautical marketing and
promotions is an essential part of
the sales process to assist with
the success of new or expanded
routes.
15Underlying profit increased
6 months 6 months
31 Dec 2010 31 Dec 2009
$m $m % change
Reported net profit after tax 65.5 54.0 21.4
Gain on investment property revaluation (2.3) - -
Gain on derivative fair value changes (1.4) - -
Gain on sale of associates (1.2) - -
Tax effect 0.9 - -
Underlying Profit 61.5 54.0 14.0
Included in the net profit after tax for the six months ended 31 December
2010 is a gain on investment property revaluations, a gain on derivative
financial instruments and a gain on the sale of Auckland Airport’s share
in the joint venture HMSC-AIAL. There were no fair value changes or
other one-off items in the net profit after tax for the six months ended 31
December 2009.
16Extended debt maturity profile
Finalised agreement on
refinancing for US$150 million in
the US Private Placement (USPP)
market in December 2010 to
replace debt maturing in March
and July 2011.
This issuance into a new
international debt market
achieved:
• attractive pricing;
• delayed draw downs to match the
debt repayments; and
Debt is based on contractual maturities at par excluding interest rate swap valuations.
• tenors of 10 and 12 years to
Commercial Paper maturities are less than three months but are supported by extend Auckland Airport’s
committed bank facilities that mature in March 2013. average debt maturity to 4.56
The above graph shows debt maturities assuming the repayment of $125 million of the
Bank Facility – Syndicate in February 2011 and $75 million Bonds in July 2011 which
years.
have been refinanced with USPP debt issuance which has maturities of February 2021
($64.8m), July 2021 ($65.6m) and February 2023 ($64.8m).
17Debt ratios improved
31 Dec 2010 31 Dec 2009
Average Interest Rate 6.63% 6.92%
EBITDAFI interest cover ratio 4.06 3.78
Average debt maturity (years) 4.56 3.50
Debt to Debt + Equity 35.8% 36.3%
Percentage Fixed 67.8% 86.0%
Reduced percentage of fixed rate debt enables benefits from lower floating
interest rates, reducing the average interest rate whilst managing interest
rate risk.
Increased EBITDAFI and stable interest costs lead to improved interest
cover.
The issuance of longer tenor USPP in December 2010 has extended
Auckland Airport’s average debt maturity.
18NQA financial results
Key outcomes in Auckland 6 months 6 months 31
% change
Airport’s business case for the Passenger movements 31 Dec 2010 Dec 2009
first 12 months in the acquired International – Cairns
360,428 277,507 29.9
(excluding transits)
stake:
Domestic – Cairns 1,727,937 1,613,343 7.1
Completed the domestic
terminal on time, scope and
Domestic – Mackay 535,459 471,082 13.7
budget
Turnaround international 6 months 6 months 31
passenger volumes underway 31 Dec 2010 Dec 2009 % change
Achieved aeronautical pricing Financial Performance1 $m $m
uplift on domestic operations to Revenue A$ 53.4 A$ 45.7 16.8
recover investment
On track to establish a plan for Expenses A$ 21.1 A$ 19.6 7.8
the refinancing of NQA debt
EBITDA A$ 32.3 A$ 26.1 23.5
Received strong cash returns in
first year by way of dividends Net profit after tax2 A$ 0.2 A$ 2.4 -89.7
(NZD 8.6m received for first
year) 1. Sourced from non-audited interim financial statements of North Queensland Airports for the six
months ended 31 December 2010. The financial results have not been apportioned for the 24.55%
Published milestones on track ownership interest. The results disclosed for the previous corresponding period are for
information purposes as they do not relate to a period of ownership by Auckland International
Airport Limited
2. Depreciation and higher interest costs relating to the recently completed domestic terminal at
Cairns are the major drivers of the decrease in net profit after tax
19Queenstown financial results
Exceptional passenger growth 6 months 6 months
% change
Passenger movements 31 Dec 2010 31 Dec 2009
in the six month period.
International 91,371 66,719 36.9
Local and global campaigns
Domestic 384,213 342,707 12.1
launched to promote services
to the region. 6 months 6 months
31 Dec 2010 31 Dec 2009 % change
New Jetstar services to Financial Performance1 $m $m
Melbourne and Gold Coast Revenue 7.7 6.4 20.9
commenced in December
Expenses 1.9 1.4 29.6
2010.
EBITDA 5.9 5.0 18.4
Legal case by Air New
Net profit after tax 3.0 2.0 45.8
Zealand and QSAG a
distraction from growing 1. Sourced from non-audited interim financial statements of Queenstown
Airport for the six months ended 31 December 2010. The financial
tourism in the region. results have not been apportioned for the 24.99% ownership interest.
The results disclosed for the previous corresponding period are for
information purposes as they do not relate to a period of ownership by
Auckland International Airport Limited
20Interim dividends
Interim dividend of 4.00 cps, a
6.7% increase from 3.75 cps in
FY10, and the first increase in
interim dividends since 2005.
Total interim dividend of
$52.7m an 7.9% increase on the
$48.8m interim dividend in
FY10.
Record date for dividend is 18
March 2011 to be paid on 1
April 2011.
DRP is in place with the price
set at the 5 day VWAP
following the record date.
21Momentum on growth continues
22Growing air services at our airports
Significant route development commencing in the six months to 31 December 2010:
Annual
Airline Service Airport Route Start Date Capacity
Emirates Up-gauge Auckland Melbourne Aug-10 72,000
Jetstar New service Auckland Melbourne Dec-10 130,000
Jetstar Increase frequency Auckland Queenstown Dec-10 74,000
Jetstar New service Queenstown Melbourne Dec-10 37,000
Jetstar New service Queenstown Gold Coast Dec-10 37,000
Qantas New service Cairns Port Moresby Jul-10 92,000
Tiger New service Cairns Melbourne Sep-10 131,000
Cathay Pacific Increase frequency Cairns Hong Kong Nov-10 27,000
Pacific Blue announced their departure from New Zealand domestic services from mid-October
2010. Pacific Blue flew direct flights from Auckland to Christchurch, Wellington, Queenstown and
Dunedin with a total annual capacity of 748,000.
23Growing air services at our airports
Significant route development announced to start from January 2011:
Annual
Airline Service Airport Route Start Date Capacity
China Airlines New service Auckland Brisbane - Taipei Jan-11 96,000
Emirates Up-gauge Auckland Brisbane Jan-11 72,000
Malaysia Airlines Increase frequency Auckland Kuala Lumpur Mar-11 29,000
Jetstar New service Auckland Singapore Mar-11 220,000
China Southern New service Auckland Guangzhou Apr-11 68,000
Jetstar New service Auckland Cairns Apr-11 56,000
Thai Airways Increase frequency Auckland Bangkok July-11 60,000
Air NZ Increase frequency Auckland Beijing, Shanghai Dec-11 17,000
Continental New service Auckland Houston 2012 138,000
Jetstar Increase frequency Cairns Brisbane Jan-11 55,000
Jetstar Increase frequency Cairns Gold Coast Jan-11 74,000
Jetstar Increase frequency Cairns Sydney Apr-11 129,000
Jetstar Increase frequency Cairns Melbourne Apr-11 129,000
24Car parking yield management
Online parking tool enables
sale of the right car park to the
right customer for the right
price at the right time.
Yield and revenue in long term
car parks outstripping
passenger growth.
Long term car parking volume
(International terminal)
increased by 24.8% for the
period July 10 to Dec 10
compared to passenger growth
(excluding transits) of 4.5%
over prior period.
25Outstanding retail performance in
refurbished offering
Highly confident of surpassing aspirational goal of $105m for FY11.
Significant uplift in spend evident as stores are established in new locations.
Focus is on refining the offering and increasing quality dwell time.
New tenants opened in the six months to December 2010 include Icebreaker, Moet, Apple, Swatch,
MAC cosmetics, and a new temporary Rugby World Cup store.
New tenants opening in the next six months include Zarbo in airside Food & Beverage and KFC,
Silk Road and new bars in an expanded landside Food & Beverage range.
26Property pipeline
All property development projects are
on time, budget and scope:
Hotel developments on target for
June and August openings (prior to
RWC 2011).
Announcement expected soon on
warehouse/office development with
approximately $10m capital
expenditure.
Property strategy gaining traction and
poised to capitalise when market
recovers.
Aspirational target is to grow property
segment revenues from $30m FY09
base to rent roll of $50-60m in FY14
27Regulatory Update
Commerce Commission final determinations on disclosure and input
methodologies issued on 23 December 2010.
Majority of decisions in line with original draft determinations:
• Non-land assets as included in 2009 disclosures plus annual increase at
CPI
• Land assets in the initial RAB established using Market Value
Alternative Use ("MVAU")
• Future development land, assets under construction and land
conversion costs excluded from RAB
• Still information disclosure regime, dual till, and pricing not regulated
Auckland Airport is appealing the Commerce Commission’s final
determination on input methodologies for airport information disclosure
regulation.
28The case for investment
Now invested in four airports all with considerable
upside potential.
Growth strategies are succeeding in growing
passenger volumes, aero revenues, retail yields and
property rents.
First half results are stronger than expected and long-
term prospects for our airports and the markets they
serve are strengthening
Upgrading FY2011 profit guidance to the top end or a
little above the previous guidance range of $112 to
$118 million (excluding any fair-value changes and
other one-off items), with a degree of caution around
the potential impact on travel demand relating to the
Christchurch earthquake and rising fuel prices.
Capital expenditure forecast of $80 million to $85
million is on track, including property development.
2930
You can also read