Market environments shape the first quarter of FY19 - Q1 FY19 Earnings Release (unaudited figures) - OSRAM Group

Page created by Katherine Berry
 
CONTINUE READING
Market environments shape the first quarter of FY19 - Q1 FY19 Earnings Release (unaudited figures) - OSRAM Group
www.osram.com

Market environments shape the first quarter of FY19

Q1 FY19 Earnings Release (unaudited figures)

OSRAM Licht AG | February 7, 2019
Light is OSRAM
Market environments shape the first quarter of FY19 - Q1 FY19 Earnings Release (unaudited figures) - OSRAM Group
Disclaimer

This presentation as well as other reports, presentations, materials delivered to shareholders and press releases may contain forward-looking
statements that are subject to risks and uncertainties, including those pertaining to the anticipated benefits to be realized from the proposals
described herein. In addition, our representatives may from time to time make oral forward-looking statements. Forward-looking statements
may include, in particular, statements about future events, future financial performance, plans, strategies, expectations, prospects,
competitive environment, regulation and supply and demand. OSRAM Licht AG has based these forward-looking statements on its current
views and expectations and on certain assumptions of which many are beyond OSRAM Licht AG's control. These are subject to a number of
risks, uncertainties and factors, including, but not limited to those described in disclosures, in particular in the sub-chapter Risks in the Annual
Report. Actual financial performance could differ materially from that projected in the forward-looking statements due to the inherent
uncertainty of estimates, forecasts and projections, and financial performance may be better or worse than anticipated. Given these
uncertainties, readers should not put undue reliance on any forward-looking statements. The information contained in this presentation is
subject to change without notice and OSRAM Licht AG does not undertake any duty to update the forward-looking statements, and the
estimates and assumptions associated with them, except to the extent required by applicable laws and regulations.

This presentation includes references to non-IFRS financial measures, including, but not limited to: FCF, EBITDA, EBITDA margin, capital
expenditure, capital expenditure as percentage of revenue, net financial debt and net working capital. We have provided these measures and
other information in this presentation because we believe they provide investors with additional useful information to assess our performance.
Our use of these supplemental financial measures may vary from others in our industry and should not be considered in isolation or as an
alternative to our results as reported under IFRS.

Due to rounding, numbers presented throughout this and other documents may not add up precisely to the totals provided and percentages
may not precisely reflect the absolute figures.

2   OSRAM Licht AG
    Q1 FY19 Earnings Release (unaudited figures) | February 7, 2019
Market environments shape the first quarter of FY19 - Q1 FY19 Earnings Release (unaudited figures) - OSRAM Group
Pushing ahead in challenging market environments
Statement from the CEO                                                  The market dynamics that we already indicated last quarter further
                                                                        amplified and caused a challenging Q1. All of our business units were
                                                                        impacted by a considerable slowdown of our core markets, especially
                                                                        weak growth in China, continued WLTP ramifications in Europe and
                                                                        ongoing trade conflicts. Visibility for the quarters ahead remains low.
                                                                        In addition to our ongoing performance programs, we implemented
                                                                        further structural measures.

                                                                        We also progressed on our strategic path by streamlining our portfolio
                                                                        towards a high-tech photonics set-up, as we concluded the sale of our
    First quarter highlights                                            service business in the United States (SLS).
    • Revenue of €828m
                                                                        The Consumer Electronics Show in Las Vegas (CES) stood out as a
    • Adjusted EBITDA margin of 11.3%
                                                                        highlight in the first quarter. The showcases of our latest photonic
    • Growth, cost and structural measures
      put in place                                                      products received an overwhelmingly positive feedback from both
    • Strategic execution path on track                                 prospective and existing customers.

3     OSRAM Licht AG
      Q1 FY19 Earnings Release (unaudited figures) | February 7, 2019
Market environments shape the first quarter of FY19 - Q1 FY19 Earnings Release (unaudited figures) - OSRAM Group
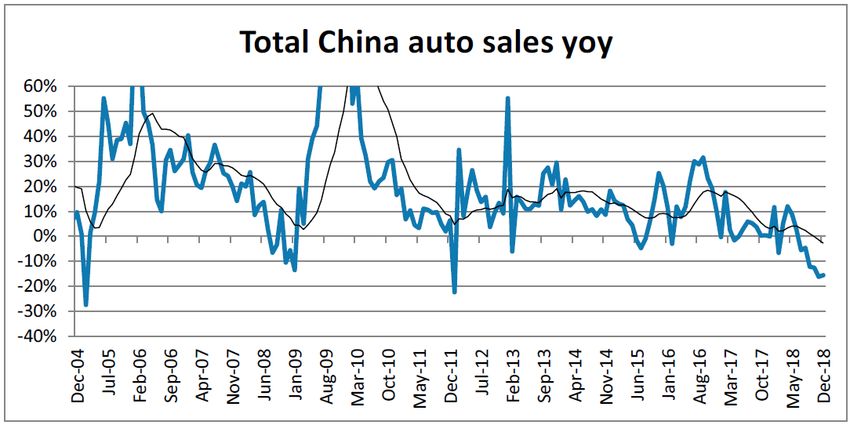
Tough economic and market dynamics shape a challenging Q1 FY19

      Revenue (€m) / comparable growth                                                             Adj. EBITDA (€m) / margin

                                                                -15.0%                                                           -81
                                           939                                            828                         174
                                                                                                                                             93
                                                                                                                     18.5%
                                                                                                                                            11.3%

                                         Q1/18                                            Q1/19                     Q1/18 1)               Q1/19

      Free cash flow (€m)                                                                         Comments

                                                                   +15
                                                                                                   Weakest quarter in Chinese car sales growth since 2005
                                                                                                    (market)

                                                                                          -101     WLTP ramifications still noticeable in Europe
                                           -115
                                         Q1/18                                            Q1/19    Supply chain corrections across industries

1)   Includes positive one-time effect from divestment of small non-strategic activity.

4          OSRAM Licht AG
           Q1 FY19 Earnings Release (unaudited figures) | February 7, 2019
Market environments shape the first quarter of FY19 - Q1 FY19 Earnings Release (unaudited figures) - OSRAM Group
Economic environment showing signs of a slowdown

IFO World economic climate                                                             Global Manufacturing PMI
Ifo economic climate index, Calendar year based                                        Purchasing Manager Index, Calendar year based

30                                                                                    55

25

                                                                                      54
20

15
                                                                                      53
10

5
                                                                                      52
0

-5                                                                                    51
 Q3/17             Q4/17            Q1/18            Q2/18            Q3/18   Q4/18    Oct-17             Jan-18             Apr-18              Jul-18                Oct-18   Dec-18

     Source: ifo World Economic Survey, Nov 2018                                       Source: J.P.Morgan and IHS Markit in association with ISM and IFPSM, Jan 2019

5       OSRAM Licht AG
        Q1 FY19 Earnings Release (unaudited figures) | February 7, 2019
China car sales record weakest quarter since years

IHS – Light vehicle production                                                         China auto sales
(YoY comparison)                                                                       Y/Y-growth in percent, Calendar year based

6%

4%

2%
                                                                            NAFTA
0%

-2%                                                                         EUROPE
-4%
                                                                            CHINA
-6%
   Jan-               Apr-              Jul-             Oct-            Jan-        “China auto sales (…) down 15% yoy - the worst quarter in (…) history back to 2005” 1)
    18                 18               18                18              19

      Source: IHS Jan 2019                                                             Source: CAAM; 1) Morgan Stanley research, Jan 29th, 2019

6      OSRAM Licht AG
       Q1 FY19 Earnings Release (unaudited figures) | February 7, 2019
Volume purchase agreements of key OSRAM customers
(automotive Tier 1) point towards growth in FY19
                                                              2018                                            2019
                          Deviation between agreed-on call value and actual billings 2018                % growth: Act 2018
                                         (calendar year) LED Automotive                         vs contract 2019 (01.01.19-31.12.19)

                                      Customer 1                                +1%                                        +22%

                                      Customer 2                               -12%                                         +9%

                                      Customer 3                                -1%                                        -13%

                                      Customer 4                               -26%                                         -2%

                                      Customer 5                               -28%                                         -6%

                                      Customer 6                               -12%                                        +16%

                                      Customer 7                               -24%                                         +0%

                                      Customer 8                                +9%                                         +6%

                                      Customer 9                               -10%                                        +15%

                                   • 2018 many key customers fell short of their agreed-on purchasing volumes
                                   • 2019 volume purchase agreements point towards an improved order situation

7   OSRAM Licht AG
    Q1 FY19 Earnings Release (unaudited figures) | February 7, 2019
Operational execution programs in implementation                                                                                 Status Q1/19
                                                                                                                Level of completion
                                                                                                                  Define       Detail   Implement
                                        • Divest LS North America business
    OSRAM
                                        • Divest LS European business (Siteco)
                                        • Execute performance programs: Overhead, Footprint
                                        • Permanent Portfolio Mgmt. towards Photonics Champion

                                        • Drive competitiveness in core business
    Opto
                                        • Accelerate growth in new application fields e.g. sensing and µLED
    Semiconductors
                                        • Extend value chain towards Component+
                                        • Fit for the Future OS

                                        • Execute growth plan in OSRAM Continental
    Automotive
                                        • Stay #1 in light sources
                                        • Aftermarket growth with light sources and portfolio extension

                                        • Implement new organizational setup (DI)
    Digital
                                        • Transform lighting electronics into digital infrastructure provider
                                        • Ramp-up digital business in focus applications

8     OSRAM Licht AG
      Q1 FY19 Earnings Release (unaudited figures) | February 7, 2019
OSRAM continues its path to become a leading photonic player

Consumer Electronics Show 2019, Las Vegas

                                                                      • 35 new product showcases
                                                                        • Incl. LIGHTELLIGENCE, Chronogy Eyewear and HCL Lounger

                                                                      • 3,600 new customer leads
                                                                        • +75% vs. 2018

                                                                      • Extensive social media coverage
                                                                        • Global engagement: ~4.8 Mio (2018: 36,600)

9   OSRAM Licht AG
    Q1 FY19 Earnings Release (unaudited figures) | February 7, 2019
OSRAM’s new segment reporting

     Segment reporting structure as of October 1, 20181)

                                                                                             Discontinued
                                                                                              Operation
                    Opto                                                                     European luminaire
                                                                      Automotive   Digital
                Semiconductors                                                                    business
                                                                         (AM)       (DI)
                     (OS)
                                                                                             Sylvania Lighting
                                                                                              Solutions (USA)

1)   Asian luminaire business included in Corporate Items.

10         OSRAM Licht AG
           Q1 FY19 Earnings Release (unaudited figures) | February 7, 2019
Summary Key Financial Performance Q1 FY19
        Revenue (€m) / comp. growth                                                                 Q1 FY19 comparable revenue growth @ -15.0%; IFRS15 impact
                     5.7%
                                                                       -15.0%                        approx. -1%; revenue declined in all segments
                                 939                                      828                       Accelerated market decline, particularly in the core markets Automotive,
                                                                                                     General Lighting and Mobile Devices
                                                                                                    Weak growth in China, ongoing trade conflicts and supply chain
                                Q1/18                                   Q1/19
                                                                                                     corrections had a negative impact
        Adj. EBITDA (€ m) / margin
                     18.5%
                                                                        11.3%                       Q1 FY19 adjusted EBITDA @ 11.3% compared to 18.5% in Q1 FY18
                                 174                                                                EBITDA Special Items in Q1 FY19 at €-24m
                                                                           93

                                Q1/18                                   Q1/19                       Free Cash Flow negative with €-101m; Capex of €105m; Cash flow
        Free Cash Flow (€ m)1)                                                                       from operations slightly positive

                                                                                                    Net income: €-5m from continuing operations; €-80m from discontinued
                                 -115                                     -101                       operation impacted by €-61m impairment in conjunction with the
                                Q1/18                                   Q1/19                        classification of the European luminaire business as discontinued
1)   Defined as net cash provided by (used in) operating activities less capital expenditures.
                                                                                                     operation
11         OSRAM Licht AG
           Q1 FY19 Earnings Release (unaudited figures) | February 7, 2019
Revenue declined in all segments
Revenue (€m)
OSRAM Group: Revenue bridge Q1 FY19 YoY                                                         Comments

                                                                                                 Small positive impact from foreign exchange1)
       939
                        0.8%               2.4%              -15.0%            828               IFRS 15 effect in Q1/19 approx. -1%
                                                                                                 Portfolio effect related to M&A activities (Fluence, BAG,
                                                                                                  Vixar, OSRAM Continental)

     Revenue              FX             Portfolio        Comparable         Revenue
      Q1/18                                                 growth            Q1/19

Revenue growth Q1 FY19 YoY                                                                      Regional split Q1 FY19

                                                Nom.                                 Comp.
                                                               FX       Portfolio                                                                            Comp. growth
                                              growth                                 growth
                                                                                                              30.7%             32.4%             EMEA            -18.1%
Opto Semiconductors                            -14.6%          1.7%         0.6%       -16.9%                                                     APAC            -14.7%
Automotive                                      -9.8%          0.9%         0.4%       -11.0%                                                     Americas        -11.9%
Digital                                         -8.8%          0.0%         7.9%       -16.7%                          36.8%

                                                                                                1)   EUR/USD @ 1.15 in Q1/19 vs. 1.19 in Q1/18.

12    OSRAM Licht AG
      Q1 FY19 Earnings Release (unaudited figures) | February 7, 2019
Operating Leverage impacts profitability as volume declined
Adjusted EBITDA (€m) / Adjusted EBITDA Margin (%)
Adjusted EBITDA1) Q1 FY19 YoY                                                                                                                              Adjusted EBITDA1) Q1 FY19 YoY
                                                                                                                                                                   174
           174
                                   -33                                                                                                                                                     -40
                                                         -25                                                                                                                                                      -20
                                                                                                                              93                                                                                                        -15                         93
                                                                                -32                                                                                                                                                                      -6
                                                                                                        10

     Adj. EBITDA                   OS                     AM                     DI           Other/ Corporate          Adj. EBITDA                           Adj. EBITDA              Volume/             Price erosion Divestment of a                Other   Adj. EBITDA
        Q1/18                                                                                                              Q1/19                                 Q1/18                Degression            & Inflation       small non-                           Q1/19
                                                                                                                                                                                                          vs. Productivity strategic activity
                                                                                                                                                                                                                               in Q1/18

Adjusted EBITDA margin Q1 FY19                                                                                                                           Comments

                                                                                 Adj. EBITDA                    FX impact                                 Negative volume/degression effects particularly for OS and AM
                                                                                      margin                       YoY
                                                                                                                                                              substantially impact profitability; negative profitability of DI
Opto Semiconductors                                                                           19.8%                  -0.1%
                                                                                                                                                              driven by strong decline in electronic ballasts/controls business
Automotive                                                                                    10.8%                  -0.6%
Digital                                                                                        -4.9%                 -0.6%                                Adj. EBITDA in corporate items of €-14m

1)   Adjustment for special items (S.I.) includes a.o. transformation costs, substantial legal and regulatory matters, and costs related to mergers and acquisitions activities including the sale of subsidiaries, investments and other businesses.

13         OSRAM Licht AG
           Q1 FY19 Earnings Release (unaudited figures) | February 7, 2019
Saving targets of performance programs now increased
to €160-180m by 20201)2)

Cross-functional & BU-specific performance programs

 Targeted Gross Savings

                                                  Overhead                                                              Transformation
                                                 productivity                                                              of plants
                                                    global                                                                                                                                   Transformation Costs2)3)

                                                 FY18: € 13m                                                                  FY18: € 5m                                                            FY18: € 69m

                                              FY19: € 35-45m                                                              FY19: € 30-40m                                                          FY19: € 80-90m

                                                € 85-95m1)                                                                  € 75-85m1)

1)   Estimated annualized savings by end of FY2020 compared to FY17 baseline.   2)   Excl. European luminaire business and Sylvania Lighting Solutions (USA).   3) Recorded   as Special Items.

14        OSRAM Licht AG
          Q1 FY19 Earnings Release (unaudited figures) | February 7, 2019
Segments: Key financials Q1 FY19
      Revenue (€m) / Comp. growth (%)                                  Adj. EBITDA1) (€m) / Adj. EBITDA margin (%)
                                                                                                                                                          Comments
                                                                                                                                                           OS
                                                                                                                                                                       Revenue decline in all business lines, due to weakening auto
                                          -16.9%
                                                                                            25.0%                                                                       demand and a slowdown in China. Inventory destocking in the
     OS                                                                                                                19.8%
                               410                       350                                                                                                            supply chains of the General Lighting market as well as with
                                                                                               102                       69                                             distributors for multimarket applications
                              Q1/18                     Q1/19                                 Q1/18                     Q1/19                                          High operating leverage and lower volumes drove profitability down
                                                                                                                                                                       New structural cost measures initiated; restructuring costs of
                                                                                                                                                                        approx. mid-double-digit million € expected (Special Items)
                                          -11.0%
                                                                                                                                                           AM
     AM                        491                                                          14.9%
                                                         443                                                           10.8%                                           Weak demand in China and Europa leading to a decline in both
                                                                                                73                       48                                             traditional and LED volumes
                              Q1/18                     Q1/19                                 Q1/18                     Q1/19                                          Profitability impacted by lower volume

                                                                                                                                                           DI
                                                                                                                                                                       Most segments with moderate to significant revenue decline;
                                                                                            10.0%
                                           -16.7%                                                                                                                       business environment weakened further (US, EMEA); particularly
     DI                                                                                      222)
                                                                                                                        -10                                             for the General Lighting DS business
                               222                       202
                                                                                                                       -4.9%                                           Adj. EBITDA decreased: negative volume, lower utilization as well
                              Q1/18                     Q1/19                                 Q1/18                     Q1/19                                           as cost inflation in electronic components continued to be a
                                                                                                                                                                        headwind
1) Adjustment  for special items (S.I.) includes a.o. transformation costs, substantial legal and regulatory matters, and costs related to mergers and acquisitions activities including the sale of subsidiaries, investments and other businesses.
2)   EBITDA in Q1/18 includes positive one-time effect from divestment of small non-strategic activity.

15        OSRAM Licht AG
          Q1 FY19 Earnings Release (unaudited figures) | February 7, 2019
Negative FCF due to Capex peak in Q1 FY19
Free Cash Flow / Net Debt (€m)
Free cash flow1) bridge Q1 FY19 YoY                                                                   Net debt bridge Q1 FY19

            EBITDA                                                           69                            -51

                                                                                                                            -101
            Trade Receivables                                                                    82
                                                                                                                                            -5                 1                   -16
                                                                                                                                                                                                   -172
            Inventories                                                                      -81         Net debt            FCF       Investments in         Other              Cash flow       Net debt
                                                                                                        Sep 30, 2018                      financial       investing and        from disc. op.   Dec 31, 2018
                                                                                                                                            assets       financial items         and others
            Trade Payables                                                        -19

                                                                                                      Capital expenditure (percent of revenue) Q1 FY19 YoY
            Income taxes paid                                                 -16
                                                                                                                                           -93
                                                                                                                                                                                                 OS
            Capex                                              -105                                                    199 (21.1%)
                                                                                                                                                                                                 AM
                                                                                                                                                                                                 DI
                                                                                                                                                        105 (12.7%)
            Other                                -31                                                                        184                                                                  Others /
                                                                                                                                                                                                 corporate
                                                                                                                                                             88
                                                                                                                                       0                                   0
            FCF 1)                                      -101                                                            7          8                     6         11
                                                                                                                         Q1/18                            Q1/19
1)   Defined as net cash provided by (used in) operating activities less capital expenditures.

16         OSRAM Licht AG
           Q1 FY19 Earnings Release (unaudited figures) | February 7, 2019
Outlook for FY191)

      Revenue                                                                                               Adj. EBITDA margin                                                                           Free Cash Flow

      Flat to moderate2)                                                                                    Adjusted EBITDA margin                                                                       Positive Free Cash Flow,
      comparable revenue growth                                                                             of 12% to 14%                                                                                targeted mid double-digit3)

                                     •      The company has initiated a number of countermeasures.
                                     •      Considerable structural measures have been initiated in the segment Opto Semiconductors.
                                     •      The achievement of the guidance is subject to:
                                                •      the successful implementation of these measures
                                                •      and to a revival of order intake in the months ahead.

1)   based on an exchange rate EUR/USD of 1.15; based on cont. operations, excl. European luminaire business and Sylvania Lighting Solutions (USA).   2) Flat   to moderate represents a growth rate in the range of 0-3%.   3) Excl.   proceeds from possible divestments.

17         OSRAM Licht AG
           Q1 FY19 Earnings Release (unaudited figures) | February 7, 2019
Financial calendar and IR contact information

     Upcoming events

      February 19, 2019
       Annual General Meeting, Munich, Germany

      May 8, 2019
       Earnings release for the 2nd quarter of fiscal year 2019, Munich, Germany

      May 10, 2019
       Interim Report for the first half of fiscal year 2019, Munich, Germany

     Investor Relations contact

                   Telephone                                            + 49 89 6213 4875
                   Internet                                             http://www.osram-group.de/en/investors
                   Email                                                ir@osram.com

18    OSRAM Licht AG
      Q1 FY19 Earnings Release (unaudited figures) | February 7, 2019
Appendix

19   OSRAM Licht AG
     Q1 FY19 Earnings Release (unaudited figures) | February 7, 2019
Key financial metrics continuing operations
(unaudited)
 Group (€m)                                                              Q1 FY18   Q1 FY19    Change (y-o-y)

                                                                                              nom.     -11.9%
 Revenue                                                                     939       828   comp.     -15.0%
 Gross margin                                                             34.8%     27.4%            -740 bps
 R&D                                                                         -92       -98               6.3%
 SG&A                                                                       -138      -138              -0.3%
 EBITDA                                                                     162         69             -57.3%
  EBITDA margin                                                           17.3%      8.4%            -890 bps
 Adj. EBITDA                                                                174        93             -46.4%
     Adj. EBITDA margin                                                   18.5%     11.3%            -720 bps
 Financial result, including at-equity result (continuing operations)         0         -4                  -
 Income (loss) before income taxes (continuing operations)                  107         -7           -106.2%
 Taxes                                                                      -30          2           -105.8%
 Net income (loss) (continuing operations)                                   77         -5           -106.4%
 Diluted EPS in € (continuing operations)                                   0.78     -0.01           -101.3%
 Free cash flow (continuing operations)                                     -115      -101             12.9%
 CAPEX                                                                       199       105            -47.0%
 Net debt                                                                    -51      -172            -236.6%
 Equity ratio                                                             58.2%     56.0%            -220 bps
 Employees (in thousands)                                                   25.1      26.0              3.3%

20     OSRAM Licht AG
       Q1 FY19 Earnings Release (unaudited figures) | February 7, 2019
Segment overview
(unaudited)
  Q1 FY19 (€m)                                                                                      OS      AM        DI     CIE        OSRAM
                                                                                                                                    Licht Group

  Revenue                                                                                          350      443      202    -168            828
  Change % vs. PY reported                                                                       -14.6%    -9.8%    -8.8%                -11.9%
  Change % vs. PY comparable                                                                     -16.9%   -11.0%   -16.7%                -15.0%
  EBITDA                                                                                            58       43       -14     -18            69
  EBITDA margin                                                                                  16.7%     9.7%     -6.7%                 8.4%
  Special items EBITDA                                                                              -11       -5       -4      -4           -24
  therein transformations costs                                                                      -1       -3       -3      -4           -11
  EBITDA before special items                                                                       69       48       -10     -14            93
  EBITDA margin before special items                                                             19.8%    10.8%     -4.9%                11.3%
  Assets1)                                                                                        1,392     844      456    1,957         4,649
  Free cash flow                                                                                    -23      -10      -53     -14          -101

  Additions to intangible assets and property, plant and equipment                                  88       11        6       0            105
  Amortization                                                                                       1        6        6       1             13
  Depreciation                                                                                      43       11        5       0             59

1) Net   assets on segment level; total assets on group level; CIE includes reconciling items.

21         OSRAM Licht AG
           Q1 FY19 Earnings Release (unaudited figures) | February 7, 2019
Consolidated statement of income
(unaudited)
                                                                              Three months Three months ended
                                                                         ended December 31        December 31
                                                                                      2018              2017

 Revenue                                                                               828                939
 Cost of goods sold and services rendered                                             -601               -612
 Gross profit                                                                          227                327
 Research and development expenses                                                     -98                -92
 Marketing, selling and general administrative expenses                               -138               -138
 Other operating income                                                                  8                 18
 Other operating expense                                                                -2                 -8
 Income (loss) from investments accounted for using the equity method,
 net                                                                                     0                 0
 Interest income                                                                         0                 1
 Interest expense                                                                       -2                -3
 Other financial income (expense), net                                                  -1                 2
 Income (loss) before income taxes OSRAM (continuing operations)                        -7               107
 Income taxes                                                                            2               -30
 Income (loss) OSRAM (continuing operations)                                            -5                77
 Income (loss) from discontinued operation, net of tax                                 -80               -16
 Net income (loss)                                                                     -84                60

 Attributable to:
 Non-controlling interests                                                              -4                 1
 Shareholders of OSRAM Licht AG                                                        -81                60

 Basic earnings per share (in €)                                                      -0.83              0.62
 Diluted earning per share (in €)                                                     -0.83              0.61
 Basic earnings per share (in €) OSRAM (continuing operations)                        -0.01              0.79
 Diluted earning per share (in €) OSRAM (continuing operations)                       -0.01              0.78

22   OSRAM Licht AG
     Q1 FY19 Earnings Release (unaudited figures) | February 7, 2019
Net Income OSRAM (continuing operations)
(unaudited)

                                                                                                                                           Three months ended                     Three months ended
                                                                                                                                                  December 31                            December 31
                                                                                                                                                                    2018                                   2017
Net Income (loss) OSRAM (continuing operations)                                                                                                                         -5                                     77
Special Items (Profit)                                                                                                                                                  33                                     13
Tax attributable to Special Items (Profit)                                                                                                                              -9                                      -4
Net Income OSRAM (continuing operations) adjusted1)                                                                                                                     19                                     86
Non-controlling interests                                                                                                                                               -4                                       1
Net Income OSRAM (continuing operations) adjusted, attributable to Shareholders of
OSRAM Licht AG                                                                                                                                                         23                                      85
Diluted earning per share (in €) OSRAM (continuing operations) adjusted                                                                                              0.24                                    0.88
Diluted earning per share (in €) OSRAM (continuing operations)                                                                                                      -0.01                                    0.78

Diluted number of shares                                                                                                                                             96.9                                   96.9
Tax rate                                                                                                                                                             26%                                    28%

1)   Adjustment for special items (S.I.) includes a.o. transformation costs, substantial legal and regulatory matters, and costs related to mergers and acquisitions activities including the sale of subsidiaries, investments and other businesses.

23         OSRAM Licht AG
           Q1 FY19 Earnings Release (unaudited figures) | February 7, 2019
Consolidated statement of financial position
(unaudited)
                                                                    As of        As of                                                                          As of          As of
                                                              December 31 September 30                                                                    December 31   September 30
                                                                    2018         2018                                                                           2018           2018
 Assets                                                                                  Liabilities and equity
 Current Assets                                                                          Current liabilities
 Cash and cash equivalents                                               243       333   Short-term debt and current maturities of long-term debt                 271            233
 Available-for-sale financial assets                                       -         0   Trade payables                                                           618            714
                                                                                         Other current financial liabilities                                       69             40
 Trade receivables                                                       555       614
                                                                                         Contract liabilities                                                      14              -
 Other current financial assets                                           42        45
                                                                                         Current provisions                                                        70             74
 Contract assets                                                           7         -
                                                                                         Income tax payables                                                       97            110
 Inventories                                                             791       743   Other current liabilities                                                328            373
 Income tax receivables                                                   58        49   Liabilities associated with assets classified as held for sale           104             12
 Other current assets                                                    157       151   Total current liabilities                                              1,572          1,555
 Assets held for sale                                                     136       49   Long-term debt                                                           144            152
 Total current assets                                                   1,988    1,984   Pension plans and similar commitments                                    161            162
 Goodwill                                                                 373      369   Deferred tax liabilities                                                  16             14
 Other intangible assets                                                  274      296   Provisions                                                                33             26
 Property, plant and equipment                                          1,555    1,621   Other financial liabilities                                               21             24
 Investments accounted for using the equity method                         61       66   Other liabilities                                                        100            121
 Other financial assets                                                    19       19   Total liabilities                                                      2,048          2,053
                                                                                         Equity
 Deferred tax assets                                                      325      309
                                                                                         Common stock, no par value                                                97            105
 Other assets                                                              55       65
                                                                                         Additional paid-in capital                                             1,669          2,034
 Total assets                                                           4,649    4,730
                                                                                         Retained earnings                                                        687            780
                                                                                         Other components of equity                                                21              3
                                                                                         Treasury shares, at cost                                                  -9           -386
                                                                                         Total equity attributable to shareholders of OSRAM Licht AG            2,465          2,536
                                                                                         Non-controlling interests                                                137            140
                                                                                         Total equity                                                           2,602          2,676
                                                                                         Total liabilities and equity                                           4,649          4,730

24    OSRAM Licht AG
      Q1 FY19 Earnings Release (unaudited figures) | February 7, 2019
Consolidated statement of cash flows
(unaudited)
                                                                           Three months   Three months                                                                                 Three months     Three months
                                                                         ended December ended December                                                                               ended December   ended December
                                                                                     31             31                                                                                           31               31
                                                                                   2018           2017                                                                                         2018             2017
                                                                                                         Cash flows from investing activities
 Cash flows from operating activities
                                                                                                         Additions to intangible assets and property, plant and equipment                      -105             -199
 Net income (loss)                                                                  -84             60
                                                                                                         Acquisitions, net of cash and cash equivalents acquired                                  -               -7
 Adjustments to reconcile net income (loss) to cash provided                                             Purchases of investments                                                                -5               -2
     Income (loss) from discontinued operation, net of tax                           80             16   Proceeds and payments from sales of investments, intangible assets, and
     Amortization, depreciation, and impairments                                     73             56   property, plant and equipment                                                           1                 5
                                                                                                         Proceeds and payments from the sale of business activities                              -                22
     Income taxes                                                                    -2             30
                                                                                                         Net cash provided by (used in) investing activities from continuing
     Interest (income) expense, net                                                  2               1   operations                                                                            -109             -181
     (Gains) losses on sales and disposals of businesses, intangible                                     Net cash provided by (used in) investing activities from discontinued
     assets, and property, plant and equipment, net                                  0             -15   operation                                                                               -4               -2
     (Income) loss from investments                                                  0               0   Net cash provided by (used in) investing activities - OSRAM
                                                                                                         (continuing operations)                                                               -113             -183
     Other non-cash (income) expenses                                                3               4
                                                                                                         Cash flows from financing activities
     Change in current assets and liabilities                                                            Repayment of long-term debt                                                             -8               -2
      (Increase) decrease in inventories                                            -81            -34   Change in debt and other financing activities                                           38                1
      (Increase) decrease in trade receivables                                       82              7   Interest paid                                                                           -1               -1
      (Increase) decrease in other current assets                                                        Net cash provided by (used in) financing activities - OSRAM
                                                                                     -2            -40
                                                                                                         (continuing operations)                                                                 29               -2
      Increase (decrease) in trade payables                                         -19             10   Net cash provided by (used in) financing activities from discontinued
      Increase (decrease) in current provisions                                      0              -4   operation                                                                                -                -
      Increase (decrease) in other current liabilities                              -30              7   Net cash provided by (used in) financing activities - OSRAM Licht
                                                                                                         Group (total)                                                                           29               -2
     Change in other assets and liabilities                                          0              -1   Effect of exchange rates on cash and cash equivalents                                    2               -2
     Income taxes paid                                                              -16            -16   Net increase (decrease) in cash and cash equivalents                                   -90             -105
     Interest received                                                               0               1   Cash and cash equivalents at beginning of period                                       333              609
                                                                                                         Cash and cash equivalents at the end of period                                         243              504
 Net cash provided by (used in) operating activities - OSRAM
 (continuing operations)                                                             5              83   Less: Cash and cash equivalents of assets classified as held for disposal
                                                                                                         and discontinued operation at end of period                                             0                0
 Net cash provided by (used in) operating activities from discontinued
 operation                                                                          -12             -1   Cash and cash equivalents at end of period (consolidated statement
                                                                                                         of financial position)                                                                 243              504
 Net cash provided by (used in) - OSRAM Licht Group (total)                          -7             82

25       OSRAM Licht AG
         Q1 FY19 Earnings Release (unaudited figures) | February 7, 2019
You can also read