SBM Offshore 2020. All rights reserved. www.sbmoffshore.com

Page created by Joyce Gross
 
CONTINUE READING
SBM Offshore 2020. All rights reserved. www.sbmoffshore.com
© SBM Offshore 2020. All rights reserved. www.sbmoffshore.com
SBM Offshore 2020. All rights reserved. www.sbmoffshore.com
Disclaimer

     The companies in which SBM Offshore N.V. directly and indirectly owns investments are separate legal entities. In this presentation “SBM
     Offshore” and “SBM” are sometimes used for convenience where references are made to SBM Offshore N.V. and its subsidiaries in
     general. These expressions are also used where no useful purpose is served by identifying the particular company or companies.

     This presentation contains forward-looking statements concerning the financial condition, results of operations and businesses of SBM. All
     statements other than statements of historical fact are, or may be deemed to be, forward-looking statements. Forward-looking statements
     are statements of future expectations that are based on management’s current expectations and assumptions and involve known and
     unknown risks and uncertainties that could cause actual results, performance or events to differ materially from those expressed or implied
     in these statements. Forward-looking statements include, among other things, statements concerning the potential exposure of SBM to
     market risks and statements expressing management’s expectations, beliefs, estimates, forecasts, projections and assumptions. All
     forward-looking statements contained in this presentation are expressly qualified in their entirety by the cautionary statements contained or
     referred to in this section. Readers should not place undue reliance on forward-looking statements. Each forward-looking statement speaks
     only as of the date of this presentation. Neither SBM Offshore N.V. nor any of its subsidiaries undertakes any obligation to publicly update
     or revise any forward-looking statement as a result of new information, future events or other information. In light of these risks, results
     could differ materially from those stated, implied or inferred from the forward-looking statements contained in this presentation.

     © 2020. This presentation is the property of SBM Offshore N.V. or any of its subsidiaries (together referred as “SBM”) and contains material
     protected by intellectual property rights, including copyrights, owned by SBM. The trademark "SBM Offshore", the SBM logomark and the
     SBM trademark “Fast4ward” which covers a proprietary and patented SBM technology, are registered marks owned by SBM.
     All copyright and other intellectual property rights in this material are either owned by SBM or have been licensed to SBM by the rightful
     owner(s) allowing SBM to use this material as part of this presentation. Publication or other use, explicitly including but without limitation to
     the copying, disclosing, trading, reproducing, or otherwise appropriating of information, illustrations etc., for any other purposes, as well as
     creating derivative products of this presentation, is prohibited without the prior express written consent of SBM.

                                                    © SBM Offshore 2020. All rights reserved. www.sbmoffshore.com                                        2
SBM Offshore 2020. All rights reserved. www.sbmoffshore.com
Highlights

   Effective response              Resilient model                                      Adapting the Company

                        © SBM Offshore 2020. All rights reserved. www.sbmoffshore.com                          3
SBM Offshore 2020. All rights reserved. www.sbmoffshore.com
Effective response

    Health & Safety           Business continuity                                     Mitigating impact

                      © SBM Offshore 2020. All rights reserved. www.sbmoffshore.com                       4
SBM Offshore 2020. All rights reserved. www.sbmoffshore.com
HSSE & ESG
The Market
Our Strategy
HY 2020 Financials
Outlook

                © SBM Offshore 2020. All rights reserved. www.sbmoffshore.com
SBM Offshore 2020. All rights reserved. www.sbmoffshore.com
HSSE / License to operate

                                                  Safety

                                                 Total Recordable Injury Frequency Rate1
                                                      1.20                                                                                                         Oil Majors Benchmark 2

                                                      1.00
                                                                                                                                                                   SBM Offshore

                                                      0.80

                                                      0.60

                                                      0.40

                                                      0.20

                                                      0.00
                                                                2008       2009        2010        2011        2012   2013   2014      2015   2016   2017   2018      2019     1H 2020

                                                                                  Stayed the course in a challenging environment

      (1)   Per 200k man-hours
      (2)   Includes Shell, BP, Total, Chevron, Woodside, ExxonMobil, ENI, Equinor (based on available data)
                                                                       © SBM Offshore 2020. All rights reserved. www.sbmoffshore.com                                                        6
SBM Offshore 2020. All rights reserved. www.sbmoffshore.com
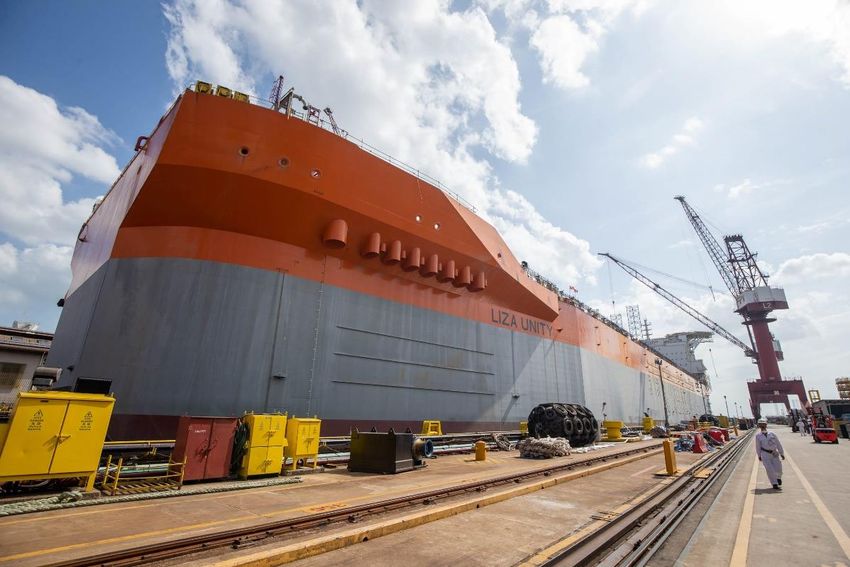
ESG – Prioritizing reduction of GHG emissions
      Transparent and measurable                                                                 Ratings

                                                                                                 DJSI Europe:
                                                                                                 92nd percentile                  1

                                                                                                 Relative position:
                                                                                                                                        2
                                                                                                 #1 amongst peers

                                                                                                 Rating:
                                                                                                     3
                                                                                                 A
         Key targets linked to SDGs
                                                                                                 Rating:
                                                                                                     4

         >40 metrics related                                                                     C
         to ESG performance
                                                                                                           (1)   Maximum score: 100
                                                                                                           (2)   Based on market capitalization / industry
                                                                                                           (3)   Maximum score: AAA
                                                                                                           (4)   Maximum score: A+

                                 © SBM Offshore 2020. All rights reserved. www.sbmoffshore.com                                                               7
SBM Offshore 2020. All rights reserved. www.sbmoffshore.com
HSSE & ESG
The Market
Our Strategy
HY 2020 Financials
Outlook

                © SBM Offshore 2020. All rights reserved. www.sbmoffshore.com
SBM Offshore 2020. All rights reserved. www.sbmoffshore.com
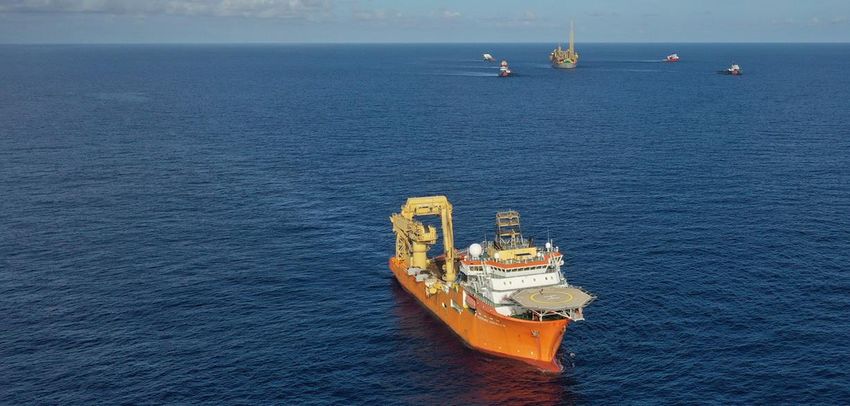
FPSO market - Potential awards 2020-2022

                                                                                                                 Unconventional cycle

                                                                                                                 Uncertain market outlook

                                                                                                                 World-class deepwater resilient

         Potential FPSO awards within target market

         Other potential FPSO awards

         FPSO awards 1H 2020                                                                                     Remaining disciplined and selective

                                                                                                                                 Source: SBM Offshore market intelligence
                                                 © SBM Offshore 2020. All rights reserved. www.sbmoffshore.com                                                              9
SBM Offshore 2020. All rights reserved. www.sbmoffshore.com
HSSE & ESG
The Market
Our Strategy
HY 2020 Financials
Outlook

                © SBM Offshore 2020. All rights reserved. www.sbmoffshore.com
Strategy

           OPTIMIZE                       TRANSFORM                                          INNOVATE

            “SBM Offshore believes the oceans will provide the world with safe,
               sustainable and affordable energy for generations to come.
                      We share our experience to make it happen.”

                             © SBM Offshore 2020. All rights reserved. www.sbmoffshore.com              11
Adapting the business model

        Energy industry trends                                                            SBM Offshore response

                                                                                                  Lower gross cost-base
                                                                                                  by c. US$100 million
              Frequent and short cycles
              Lower oil price
                                                                                                  Enhance flexibility
                                                                                                  Maintain capacity

                                                                                                  Fast4Ward®
                                                                                                  emissionZEROTM
              Energy transition
              ESG and carbon footprint
                                                                                                  Premium ESG partner
                                                                                                  Invest in energy future

                                  © SBM Offshore 2020. All rights reserved. www.sbmoffshore.com                             12
Optimize
                 Projects update                                                             Operational performance

                                                                                                          Fleet uptime
                                             Completion
    FPSO Liza Unity                          > 50% < 75%
                                                                                   99%      99%    99%
                                                                                                           97%    98%    98%    99%     99.5%

                                            Completion
    FPSO Sepetiba                           < 25%                                 2013      2014   2015    2016   2017   2018   2019   1H 2020

                                   © SBM Offshore 2020. All rights reserved. www.sbmoffshore.com                                                 13
Transform – Continuous improvement

                        © SBM Offshore 2020. All rights reserved. www.sbmoffshore.com   14
Innovate – Ambition 2030

                          25% of revenues from Gas & Renewables by 2030

        LNG2WIRE              Tower Loading Unit            Floating Offshore Wind             Wave Energy Converter                   FLNG

                                                                                                     Contribution
         Signing (pre-)FEEDs
                                                                                                           LNG2WIRE----------

                                                                                                           Tower Loading Unit
         Establishing strategic
         partnerships                                                                                        Floating Offshore Wind

                                                                                                                        Wave Energy Converter
         Developing technology
                                                                                                                                                FLNG
         for evolving markets

                                                       2020                                                   2025                                     2030

                                           © SBM Offshore 2020. All rights reserved. www.sbmoffshore.com                                                      15
HSSE & ESG
The Market
Our Strategy
HY 2020 Financials
Outlook

               © SBM Offshore 2020. All rights reserved. www.sbmoffshore.com
Directional overview1
                         Revenue (US$ millions)                                                                                                                     EBITDA (US$ millions)
                                                                  1,179

                   965

                                                                                                                                                                                                   523
                                                                                                                                                             399

               1H 2019                                          1H 2020                                                                                  1H 2019                                 1H 2020

              Pro-forma backlog (US$ billions)                                                                                                                      Net debt (US$ billions)
                   20.7                                            19.7

                                                                                                                                                              3.5                                  3.9

                FY 2019                                         1H 2020                                                                                   FY 2019                                H1 2020

     (1)   Directional view, presented in the Financial Statements under Operating segments and Directional reporting, represents a pro-forma accounting policy, which assumes all lease
           contracts are classified as operating leases and all vessel investees are proportionally consolidated. This explanatory note relates to all Directional reporting in this document.
                                                                            © SBM Offshore 2020. All rights reserved. www.sbmoffshore.com                                                                  17
Financial performance per segment Directional, US$ millions

                     Lease and Operate                                                                                    Turnkey

          Revenue                             EBITDA                                                 Revenue                                  EBITDA

                     829                                   538

 646                                 425                                                                         351
                                                                                            319

                                                                                                                                                         25

                                                                                                                                      5

1H 2019             1H 2020         1H 2019              1H 2020                          1H 2019               1H 2020             1H 2019            1H 2020

                              “Other” EBITDA 1H 2020 US$(40) million vs 1H 2019 US$(30) million

                                                © SBM Offshore 2020. All rights reserved. www.sbmoffshore.com                                                    18
1H 2020 Sources and uses of cash Directional, US$ millions

                                                        Cash from Operations                                                        Debt drawdowns

Sources of cash                                                      480                                                                    496

   Uses of cash                                243                         74     22         150             64                               396                          165         6

                                      Debt repayment                   Interest          Dividend                                           Growth                  Share repurchase   Other
                                 (including lease liabilities)                                                                       (Capex + Fast4Ward®)
                                                                                                      Working capital
                                                                                  Tax

                                                                                                                                                  Cash December 2019              458

                                                                                                                                                  Cash variation1                (148)

                                                                                                                                                  Cash June 2020                  309
         (1)   Includes foreign currency impact of US$ (4) million
                                                                            © SBM Offshore 2020. All rights reserved. www.sbmoffshore.com                                                      19
All debt supporting L&O projects Directional, US$ billions

                                                       Assets                                               Liabilities and net assets

                                        PPE (including ROU assets), 0.2
    Other

                                                                                                   Net working capital, provisions and other, 0.6
                                         Cash and cash equivalents, 0.3

                                               Financial assets, 0.1                                                                                                Group liquidity
                                              Other net liabilities, 0.2                                    Lease Liabilities (IFRS 16), 0.2

                                                                                                            Construction project debt, 0.7                                    0.3
                                         Assets under construction, 1.2
    Lease and Operate

                                                                                                                                                                    0.9

                                                                                                                                                                                  0.9
                                                                                                                          1
                                                                                                            Non-recourse project debt, 3.3
                                                                                                                                                         Net cash   Undrawn RCF         Undrawn project debt

                                                       PPE, 4.5

                                                                                                                  Deferred income, 0.4
                                                                                                                      Hedging, 0.4
                                                                                                                  L&O net assets, 0.9

                        Simplified balance sheet to highlight L&O orientation, not to scale
                        (1) Includes FPSO Liza Destiny project debt which has become non-recourse as of July 31, 2020
                                                                                         © SBM Offshore 2020. All rights reserved. www.sbmoffshore.com                                                         20
Pro-forma net cash flow1 from L&O and BOT Directional, US$ millions
                                                                                                                                                                                                                          L&O and BOT net cash translated in EUR/share2
600
                                                                                                                                                                                                                                       ~18
                                                                                                                                                                                                                                                                    ~17
                                                                                                                                                                                                                                                                                                 ~ 16

500

                                                                                                             25 years of cash flow visibility

400

                                                                                                                                                                                                                                         6%                           7%                           8%
                                                                                                                                                                                                                                                               Discount rate
300

                                                                                                                                                                                                        c. US$240 million average L&O net cash p.a. (excl. BOT)

200
                                                                                                                                                                                                                                                                                         Net cash from L&O

                                                                                                                                                                                                                                                                                         Net cash from BOT Sale

100

  -
            2H20      2021        2022        2023        2024        2025        2026        2027        2028        2029       2030        2031        2032        2033        2034        2035        2036        2037        2038        2039        2040        2041       2042        2043        2044          2045

      (1)   Company estimates based on pro-forma backlog and a variety of other long term assumptions which are subject to change. The pro-forma Directional backlog at half year 2020 reflects assumptions which are in line with full year 2019 assumptions. For more details, refer to 2020 Half Year Management
            Report. Rounding applied to nearest hundred million in the L&O and BOT sale net cash flow which includes pro-forma backlog, operational expenses, debt redemptions, interests, does not include construction costs and tax.
      (2)   EUR/share calculation based on Net Present Value of L&O and BOT sale pro-forma net cash flow discounted at rates commonly used by the financial community. Considering 0.9 US$/EUR exchange rate (YTD average) and 188,671,305 outstanding shares (assuming cancellation of 10 million shares).
            Value excludes future awards, potential contract extensions and Prosperity project cash flow.

                                                                                                                © SBM Offshore 2020. All rights reserved. www.sbmoffshore.com                                                                                                                                                21
HSSE & ESG
The Market
Our Strategy
HY 2020 Financials
Outlook

                © SBM Offshore 2020. All rights reserved. www.sbmoffshore.com
2020 Guidance

  Directional EBITDA1                                       above           900              mln US$

  Directional Revenues                                      around            2.3            bn US$

       Lease & Operate                                        around             1.6         bn US$

       Turnkey                                                around             0.7         bn US$

     (1)   Includes restructuring costs and excludes impact from Deep Panuke contract reclassification

                                                                          © SBM Offshore 2020. All rights reserved. www.sbmoffshore.com   23
Appendix

           © SBM Offshore 2020. All rights reserved. www.sbmoffshore.com
Translating SDGs into targets and actions

                           © SBM Offshore 2020. All rights reserved. www.sbmoffshore.com   25
Pro-forma Backlog1 and borrowings repayment Directional, US$ billions                                                                                                                2

                                Pro-forma Directional L&O and BOT backlog
 TK, 1.0
            3.0

BOT, 2.1

            2.5
                                                                                                                                                       Average of 65% of L&O backlog (excl. BOT)
                                                                                                                                                       represents operating cash flow before tax.
            2.0
                                                                                                                                                       L&O average portfolio duration: 9.2 years3

            1.5
L&O, 16.7

            1.0

                                                                                                                                                                                                                        L&O

            0.5                                                                                                                                                                                                         BOT Sale

             -
                    2H20     2021     2022    2023     2024     2025     2026     2027     2028     2029     2030    2031     2032     2033     2034     2035     2036     2037     2038    2039     2040     2041     2042     2043     2044      2045

                                Pro-forma Directional L&O and BOT borrowings repayment profile4
            2.0
                                                        1.54
            1.6
                             1.10
            1.2

            0.8
                                      0.39     0.42
                    0.24                                        0.30     0.29     0.26                                                                                                                                  L&O + BOT Sale
            0.4                                                                            0.19     0.19     0.12     0.08     0.08    0.08     0.08     0.08     0.09     0.05
             -
                    2H20     2021     2022    2023     2024     2025     2026     2027     2028     2029     2030    2031     2032     2033     2034     2035     2036     2037     2038    2039     2040     2041     2042     2043     2044      2045

             (1)   Backlog is the undiscounted revenue over the confirmed portion of the contract. The pro-forma Directional backlog at half year 2020 reflects assumptions which are in line with full year 2019 assumptions. For more details,
                   refer to 2020 Half Year Management Report.
             (2)   Rounding applied to nearest hundred million in backlog figures and then adjusted from 2023 onwards to reconcile with reported backlog; rounding applied to nearest ten million in the debt redemption profile.
             (3)   Assumes the exercise of all lease extensions and transfer of FPSO Liza Destiny and Liza Unity after a period of two years of operations.
             (4)   The difference between current borrowings and the borrowings repayment profile are attributable to capitalized transaction costs, undrawn portion of FPSO Liza Unity and FPSO Sepetiba project loan assumptions.
                                                                                   © SBM Offshore 2020. All rights reserved. www.sbmoffshore.com                                                                                                          26
Group P&L and underlying items Directional, US$ millions

Group P&L                                                                                  Directional underlying items
US$ millions                          1H 2019    1H 2020       Variance                    US$ millions               1H 2019   1H 2020    Impact P&L

Revenue                                   965       1,179             215                                                                 Depreciation &
                                                                                           SBM Installer impairment         0      (57)
                                                                                                                                           Impairment
Gross Margin                              241        270               28
                                                                                           Subtotal other impact            0      (57)
Overheads                                 (96)      (110)            (14)

Other operating income / (expense)          5         (3)              (8)

Net impairment gain / (loss)                1        (14)            (15)

EBIT                                      151        142               (9)

Depreciation, amortization and
                                         (248)      (380)           (132)
impairment

EBITDA                                    399        523              123

EBITDA                                    399        523              123

Net financing costs                       (76)       (89)            (13)

Share of profit of equity-accounted
                                            2          2                0
investees

Income tax expense                        (17)       (17)               0

Net Income attributable to
                                           61         38             (23)
shareholders

Underlying net income
                                           61         94               33
attributable to shareholders

                                                     © SBM Offshore 2020. All rights reserved. www.sbmoffshore.com                                         27
Turnkey and L&O P&L Directional, US$ millions

  Turnkey                                                                                             Comments
  US$ millions                                1H 2019      1H 2020         Variance                                      Liza Unity, Sepetiba, limited scope Prosperity, Johan
                                                                                                      Ongoing Projects   Castberg and Liuhua turret mooring systems, multiple
  Revenue                                         319            351               32                                    FEEDs and other various business

  Gross Margin                                     40             10             (31)
                                                                                                      D, A & I           SBM Installer impairment in 2020 of US$(57) million
  EBIT                                             (7)          (49)             (42)

  Depreciation, amortization and impairment       (12)          (74)             (62)
                                                                                                                         General ramp-up of Turnkey activities and discipline in
                                                                                                      EBITDA
  EBITDA                                            5             25               20                                    project execution

  Lease & Operate                                                                                     Comments
  US$ millions                                1H 2019      1H 2020         Variance                   Vessels In         FPSO Liza Destiny joining the fleet at the end of 2019
  Revenue                                         646            829              183
                                                                                                                         FPSO Liza Destiny joining the fleet after achieving first oil
  Gross Margin                                    201            260               59                                    at the end of 2019 and additional percentage of ownership
                                                                                                      EBITDA             in the Lease and Operate entities related to the five
  EBIT                                            191            233               42                                    Brazilian FPSO’s in which the Company purchased
                                                                                                                         additional shares in the second half year of 2019
  Depreciation, amortization and impairment      (234)         (304)             (70)
                                                                                                                         1H 2020: 64.9%
                                                                                                      EBITDA Margin
  EBITDA                                          425            538              113                                    1H 2019: 65.8%

                                                         © SBM Offshore 2020. All rights reserved. www.sbmoffshore.com                                                                   28
1H 2020 Sources and uses of cash Directional, US$ millions
                                                      L&O                          538
                                                      Turnkey                        25
                                                      Other                        (40)
                                                      EBITDA                       523
                                                      Deferred income              (43)

                                                        Cash from Operations                                                        Debt drawdowns

Sources of cash                                                      480                                                                    496

   Uses of cash                                243                         74      22        150             64                               396                          165         6

                                      Debt repayment                    Interest          Dividend                                          Growth                  Share repurchase   Other
                                 (including lease liabilities)                                                                       (Capex + Fast4Ward®)
                                                                                                      Working capital
                                                                                   Tax

                                                                                                                                                  Cash December 2019              458

                                                                                                                                                  Cash variation1                (148)

                                                                                                                                                  Cash June 2020                  309
         (1)   Includes foreign currency impact of US$ (4) million
                                                                            © SBM Offshore 2020. All rights reserved. www.sbmoffshore.com                                                      29
Cash Flow Statement Directional, US$ millions
               US$ millions                                                                                        1H 2020
               EBITDA                                                                                                         523

               Changes in operating assets and liabilities                                                                   (164)

               Income taxes paid                                                                                              (22)

               Net cash flows from (used in) operating activities                                                             337

               Capital expenditures                                                                                          (346)

               Other investing activities                                                                                       1

               Net cash flows from (used in) investing activities                                                            (345)

               Addition and repayments of borrowings and lease liabilities                                                    253

               Share repurchase and dividend                                                                                 (315)

               Interests paid                                                                                                 (74)

               Net cash flows from (used in) financing activities                                                            (136)

               Foreign currency variations                                                                                     (4)

               Net increase/(decrease) in net cash and cash equivalents                                                      (148)

               Net cash and cash equivalents as at 31 December 2019                                                           458

               Net cash and cash equivalents as at 30 June 2020                                                               309

                                                   © SBM Offshore 2020. All rights reserved. www.sbmoffshore.com                     30
Balance Sheet Directional, US$ millions
                                                                                                                                         Comments on variation

US$ millions                                                  FY 2019                     1H 2020                     Variance
                                                                                                                                  FPSO Liza Unity, Prosperity and Sepetiba
Property, plant & equipment and Intangibles                        5,849                      5,936                         87    partially offset by depreciation and impairments

Investment in associates and other financial assets                  304                        302                         (2)

Construction contracts                                               125                          74                       (51)   Milestone payments invoiced for Turret projects

                                                                                                                                  Investment in non-allocated MPFs and increase
Trade and other assets                                               677                        771                         94    receivables for FPSO Liza Destiny joining lease
                                                                                                                                  fleet

Cash and cash equivalents                                            458                        309                       (148)   See cash flow statement

Total assets                                                       7,414                      7,392                        (22)

                                                                                                                                  Net income offset by dividends paid, share
Total equity                                                       1,179                        666                       (513)   repurchase program and decrease of hedging
                                                                                                                                  reserves

Borrowings and lease liabilities                                   3,918                      4,188                        270    FPSO Liza Destiny, Liza Unity and RCF

                                                                                                                                  Provision for local content penalty related to
Provisions                                                           428                        456                         28    construction of one FPSO

                                                                                                                                  Hedging instruments (IRS and FX forwards)
Trade payables and derivatives liabilities                         1,403                      1,639                        193    Marked-to-Market decrease

                                                                                                                                  Release of deferred income on lease contracts
Deferred income                                                      486                        443                        (43)   with declining bareboat profile

Total equity and liabilities                                       7,414                      7,392                        (22)

                                                      © SBM Offshore 2020. All rights reserved. www.sbmoffshore.com                                                                  31
Lease qualification and consolidation methods IFRS 10 & 11
Joint Ventures                                                 Lease Contract Type                                    SBM Share %                                    Directional                                           IFRS
FPSO N’Goma                                                                  FL                                              50%                                     Proportional                                          Equity
FPSO Saxi Batuque                                                            FL                                              50%                                     Proportional                                          Equity
FPSO Mondo                                                                   FL                                              50%                                     Proportional                                          Equity
FPSO Cidade de Ilhabela                                                      FL                                              75%                                     Proportional                                   Full consolidation
FPSO Cidade de Maricá                                                        FL                                              61%                                     Proportional                                   Full consolidation
FPSO Aseng                                                                   FL                                              60%                                     Proportional                                   Full consolidation
FPSO Cidade de Paraty                                                        FL                                            63.13%                                    Proportional                                   Full consolidation
FPSO Cidade de Saquarema                                                     FL                                              61%                                     Proportional                                   Full consolidation
FPSO Kikeh                                                                   FL                                              49%                                     Proportional                                          Equity
FPSO Sepetiba                                                                FL                                            64.50%                                    Proportional                                   Full consolidation
FPSO Espirito Santo                                                          OL                                              51%                                     Proportional                                   Full consolidation
FPSO Capixaba                                                                OL                                             100%                                          100%                                      Full consolidation
                1
Deep Panuke                                                                  OL                                             100%                                          100%                                      Full consolidation
Thunder Hawk                                                                 OL                                             100%                                          100%                                      Full consolidation
FPSO Cidade de Anchieta                                                      OL                                             100%                                          100%                                      Full consolidation
FPSO Liza Destiny                                                            FL                                             100%                                          100%                                      Full consolidation
FPSO Liza Unity                                                              FL                                             100%                                          100%                                      Full consolidation
FPSO Serpentina                                                               -                                              60%                                     Proportional                                   Full consolidation
Brasa Yard                                                                    -                                              50%                                         Equity                                            Equity
PAENAL Yard                                                                   -                                              30%                                         Equity                                            Equity
Normand Installer                                                             -                                             49.9%                                        Equity                                            Equity
SBM Installer                                                                 -                                              25%                                         Equity                                            Equity

             (1) Unit redelivered to SBM Offshore in July 2020, under final settlement signed with client, redelivery does not affect contractually agreed amount and timing of the financial considerations to be received by Company as per initial
             charter contract; upon redelivery contract does not qualify as lease contract anymore
                                                                                   © SBM Offshore 2020. All rights reserved. www.sbmoffshore.com                                                                                                        32
Loans and borrowings Directional, US$ millions
Net book value as of June 30, 2020                                            Full Amount                IFRS    Directional
PROJECT FINANCE FACILITIES DRAWN

FPSO Cidade de Paraty                                                                      367            367           232
MOPU Deep Panuke                                                                           104            104           104
FPSO Cidade de Anchieta                                                                    291            291           291
FPSO Cidade de Ilhabela                                                                    617            617           463
FPSO N’Goma                                                                                416              0           208
Normand Installer                                                                           34              0             0
SBM Installer                                                                               70              0             0
FPSO Cidade de Maricá                                                                    1,068           1,068          652
FPSO Cidade de Saquarema                                                                 1,152           1,152          703
FPSO Liza Destiny                                                                          699            699           699
FPSO Liza Unity                                                                            615            615           615
REVOLVING CREDIT FACILITY

Revolving credit facility                                                                   67             67            67
OTHER

Lease liabilities                                                                          154            154           154
NET BOOK VALUE OF LOANS AND BORROWINGS                                                   5,655           5,135         4,188

                                         © SBM Offshore 2020. All rights reserved. www.sbmoffshore.com                         33
Group net debt and borrowings Directional, US$ millions
                                 Net debt                                                                                           Undrawn facilities + cash
   3,500
                                                      3,879
                                                                                                                                                               912
                        3,460

   2,000
                                                                                                                                                               309

     500
                                                                                                                                                                930

   -1,000
                     FY 2019                         1H 2020                                                                                                1H 2020

            Lease liabilities   RCF   Project debt      Net cash                                                                   Undrawn RCF          Net cash       Undrawn project debt

                         Average cost of debt                                                                       1H 2020 borrowings and lease liabilities
                                                                                                                                                              154

                        4.9%                                                                                                                        1
                                                      4.3%                                                                                  1,314

                                                                                                                                                                                 2,653
                                                                                                                                                   67
                     FY 2019                         1H 2020                                                             Non-recourse project debt       RCF     Recourse project debt       Lease liabilities

                                                                                                                   (1)   Includes c. US$700 million related to FPSO Liza Destiny remaining project debt which has
                                                                                                                         become non-recourse as of July 31, 2020

                                                                   © SBM Offshore 2020. All rights reserved. www.sbmoffshore.com                                                                                    34
RCF Covenants

 Key financial covenant                                   Target                           1H 2020                                                                  Definition1

 Solvency ratio                                            > 25%                       ✔ 36%                            IFRS Tangible net worth divided by total tangible IFRS assets

 Interest cover ratio                                      > 4.0                       ✔      7.5                       Directional Underlying EBITDA divided by net interest payable

                                                                                                                        Represents maximum theoretical lending capacity, calculated as
 Lease backlog cover ratio                                 N/A                         ✔ US$ 1.9bn                      net present value of lease backlog divided by 1.5

                                                                                                                                           ✔ All covenants are satisfied

         (1)   Further explanation on definitions and covenant calculations can be found in the Company’s Annual Report 2019 section 4.3.24 borrowings and lease liabilities

                                                                           © SBM Offshore 2020. All rights reserved. www.sbmoffshore.com                                                 35
Lease and Operate portfolio

                                                                                          (1) FPSO Serpentina is owned by the client and is operated by
                                                                                          Gepsing – a subsidiary between SBM Offshore (60%) and
                                                                                          GEPetrol (40%).

                                                                                          (2) In agreement with the client, the unit was shut-down for
                                                                                          approximately four months starting in April 2020. The period has
                                                                                          been added to the charter contract at the end of the current lease
                                                                                          period.

                                                                                          (3) Unit redelivered to SBM Offshore, under the final settlement
                                                                                          signed with the client, the redelivery does not affect the
                                                                                          contractually agreed amount and timing of the financial
                                                                                          considerations to be received by the Company as per the initial
                                                                                          charter contract ending in November 2021.

                                                                                          (4) Expectation is that the client will purchase the unit after a
                                                                                          period of up to two years of operations.

                                                                                           (5) Under these contracts, SBM Offshore will construct, install and
                                                                                          thereafter lease and operate the unit for a period of up to two
                                                                                          years.

                                                                                          * Under construction.

                          © SBM Offshore 2020. All rights reserved. www.sbmoffshore.com                                                                   36
© SBM Offshore 2020. All rights reserved. www.sbmoffshore.com
You can also read