JEWEL-OSCO (Albertsons | Chicago MSA) 12803 Harlem Avenue Palos Heights, Illinois 60463 - NET LEASE INVESTMENT OFFERING - The Boulder Group
←
→
Page content transcription
If your browser does not render page correctly, please read the page content below
NET LEASE INVESTMENT OFFERING

 JEWEL-OSCO (Albertsons | Chicago MSA)
 12803 Harlem Avenue
 Palos Heights, Illinois 60463
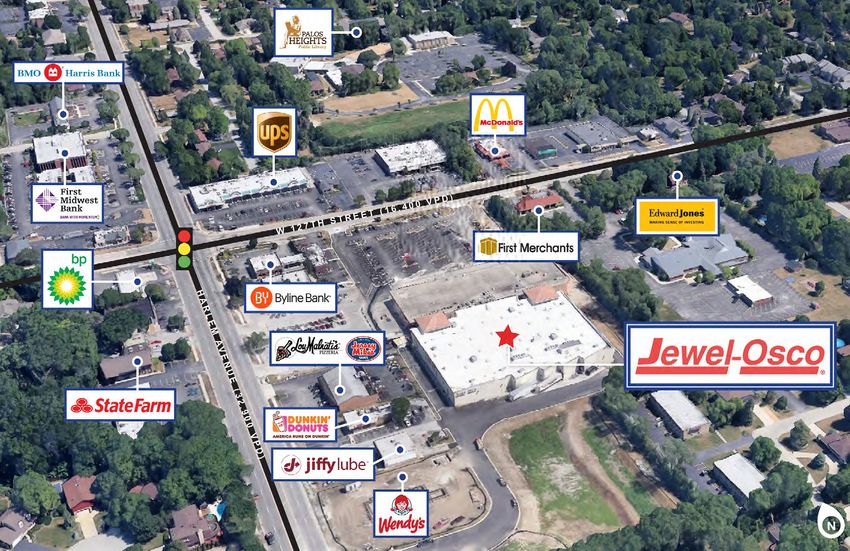
TABLE OF CONTENTS

       TABLE OF CONTENTS

        I. Executive Profile      II. Location Overview   III. Market & Tenant Overview
          Executive Summary          Photographs              Demographic Report
          Investment Highlights      Drones                   Market Overview
          Property Overview          Aerial                   Tenant Overview
          Rent Schedule              Site Plan
                                     Map

NET LEASE INVESTMENT OFFERING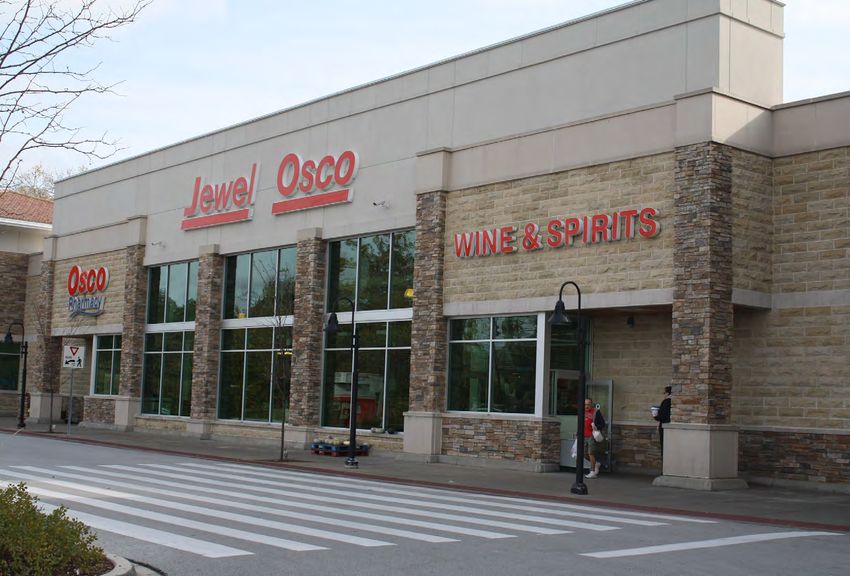
DISCLAIMER STATEMENT

       DISCLAIMER               The information contained in the following Offering Memorandum is proprietary and strictly confidential.
       STATEMENT:               It is intended to be reviewed only by the party receiving it from The Boulder Group and should not be made
                                available to any other person or entity without the written consent of The Boulder Group.

                                This Offering Memorandum has been prepared to provide summary, unverified information to prospective
                                purchasers, and to establish only a preliminary level of interest in the subject property. The information
                                contained herein is not a substitute for a thorough due diligence investigation. The Boulder Group has not
                                made any investigation, and makes no warranty or representation.

                                The information contained in this Offering Memorandum has been obtained from sources we believe to be
                                reliable; however, The Boulder Group has not verified, and will not verify, any of the information contained
                                herein, nor has The Boulder Group conducted any investigation regarding these matters and makes no
                                warranty or representation whatsoever regarding the accuracy or completeness of the information provided.
                                All potential buyers must take appropriate measures to verify all of the information set forth herein.

NET LEASE INVESTMENT OFFERING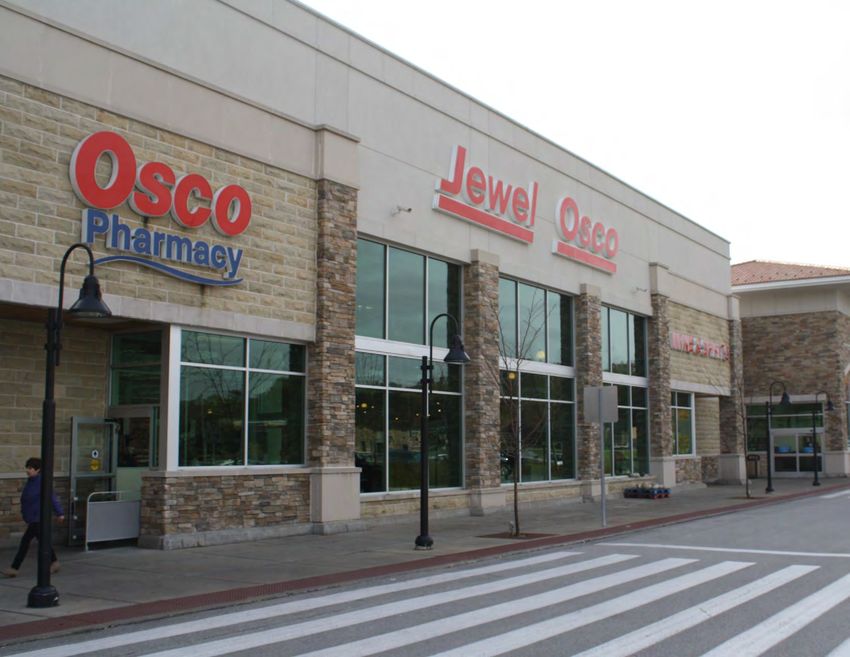
EXECUTIVE SUMMARY
EXECUTIVE The Boulder Group is pleased to exclusively market for sale the fee simple interest in a single tenant absolute triple net
SUMMARY: leased Jewel-Osco grocery store located within the Chicago MSA in Palos Heights, Illinois. The property is strategically
located at a signalized intersection in an affluent residential community. Jewel-Osco is committed to this location
as evidenced by their recently executed 20 year lease which expires in October 2037. The lease is enhanced by a
guaranty from Albertsons Companies, Inc., rental escalations and eight 5-year renewal option periods. This is a high
performing location with above average sales per square foot. Jewel-Osco is a supermarket chain with more than 185
stores throughout the Chicagoland area, Indiana and Iowa. Jewel-Osco is a wholly owned subsidiary of Albertsons
Companies, Inc., the second largest traditional grocer in the United States.
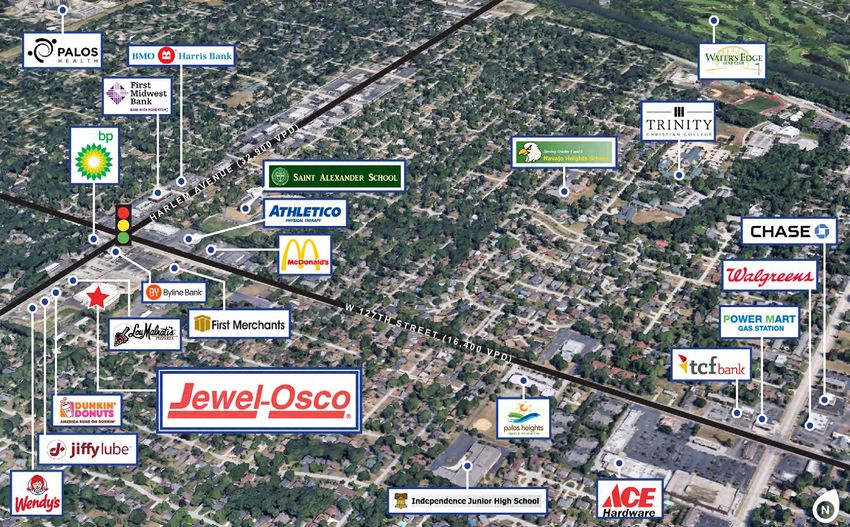
The 57,685 square foot building sits on a 9.97 acre parcel in an affluent suburb of Chicago. The property is strategically
located at the signalized intersection of Harlem Avenue and 127th Street, two primary thoroughfares in the area.
The property has excellent visibility and easy interchangeable access to the 49,300 vehicles per day that drive through
the intersection. There are over 66,260 people living within a three mile radius of the property with average annual
household incomes of $94,320 per year.
The property is located near a number of retailers including Walgreens, Ace Hardware, McDonald’s, Wendy’s, The
UPS Store, Jiffy Lube and a number of national banks. The property is also located within close proximity to multiple
residential communities, local businesses, and schools. Alan B Shepard High School, Independence Junior High and
Navajo Heights School are all within two and one-half mile from the Jewel-Osco property. Trinity Christian College, a
four-year liberal arts college, and Palos Health Community Hospital, a 428 bed hospital with over 580 physicians, are
located within two miles of the property.
There are 20 years remaining on the corporate guaranteed lease which expires October 31, 2037. The absolute triple
net lease features rental escalations throughout the term as seen on the ‘Rent Schedule’ (Page 5). Jewel-Osco, which is
part of Albertsons Companies (2,300+ stores and approximately 173,000 employees nationwide), is the leading grocer
by market share in the Chicago MSA.
-1-
NET LEASE INVESTMENT OFFERING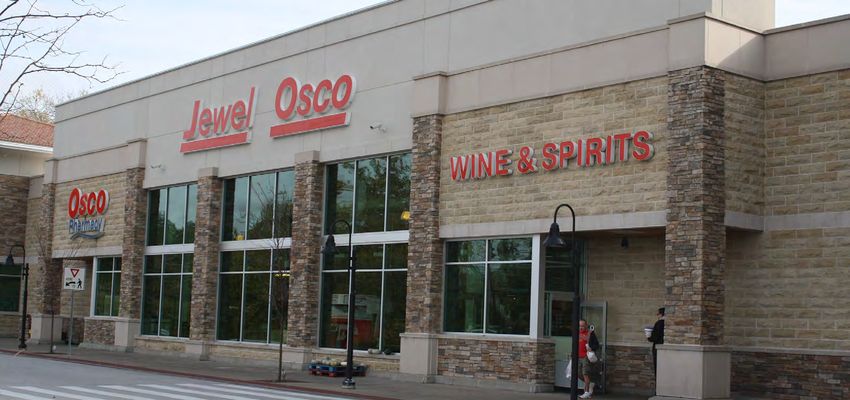
INVESTMENT HIGHLIGHTS

       INVESTMENT               Investment Opportunity to Acquire a Grocery Store Leased to Illinois’ Premier Grocer
       HIGHLIGHTS:              •   Jewel-Osco is the leading grocer by market share in the Chicago MSA
                                •   Jewel-Osco operates more than 185 stores throughout the Chicagoland area, Indiana and Iowa
                                •   Jewel-Osco was acquired in 2013 by Albertsons Companies, LLC, the second largest supermarket chain in the
                                    United States

                                Corporate Guarantee from Albertsons Companies, Inc.,, The Second Largest Traditional
                                Grocer in the United States
                                •   Largest privately held and second largest traditional grocer in the United States
                                •   Approximately 34 million customers per week
                                •   Operates stores across 35 states and the District of Columbia under 20 well-known banners
                                •   Over 2,300 stores and approximately 173,000 employees nationwide

                                Long Operating History
                                •   Established customer base
                                •   Recently executed a new long-term lease (20 years) showing commitment to the location
                                •   Above average store sales

                                Attractive Lease Structure
                                •   Long term lease with 20 years remaining
                                •   Absolute triple net lease with no landlord responsibilities
                                •   Rental escalations in the primary term and each renewal option period

-2-
NET LEASE INVESTMENT OFFERING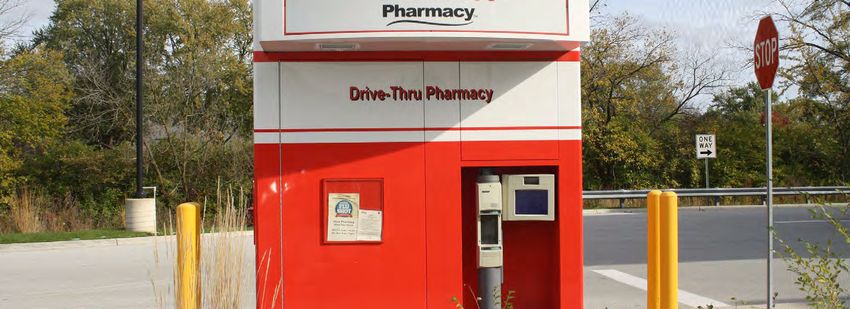
INVESTMENT HIGHLIGHTS

       INVESTMENT               Modern Grocery Store Format
       HIGHLIGHTS:
                                •   Built in 2012

                                •   Drive-thru pharmacy

                                •   Abundant parking with over 290 parking spaces

                                •   Exceptional visibility and easy access

                                Strategic Location
                                •   Located within the Chicago MSA
                                •   Positioned at a signalized intersection which experiences traffic counts of 49,300 vehicles per day
                                •   Affluent community with attractive demographics
                                •   Over 66,260 people living within a three mile radius with average annual household incomes of $94,320 per
                                    year
                                •   Retailers located in the immediate area include Walgreens, Ace Hardware, McDonald’s, Wendy’s, The UPS
                                    Store, Jiffy Lube and a number of national banks

                                Desirable Market
                                •   Chicago is the most populous metropolitan area in the Midwestern United States
                                •   The area is one of the world’s largest and most diversified economies, with more than four million employees
                                    and generating an annual gross regional product of over $561 billion.
                                •   The region hosts more than 400 major corporate headquarters, including 31 in the Fortune 500

-3-
NET LEASE INVESTMENT OFFERING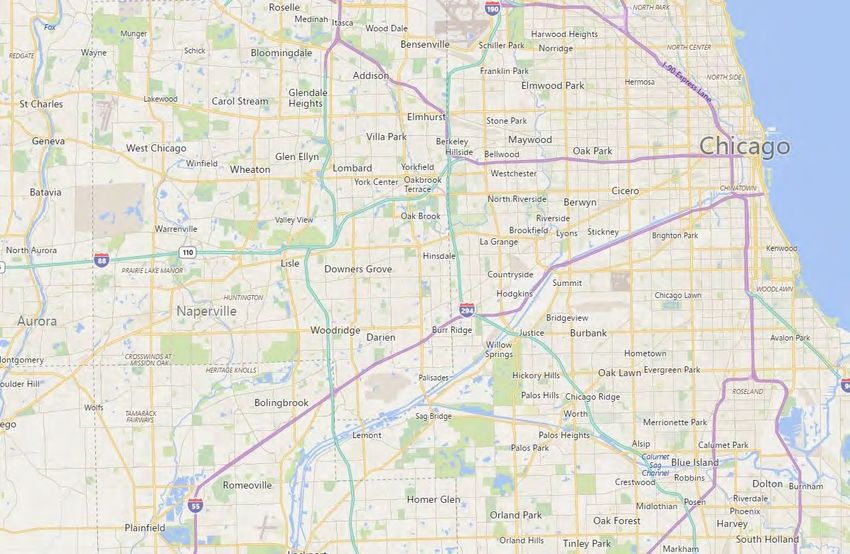
PROPERTY OVERVIEW

       PROPERTY
                                Price:                     $16,576,782
       OVERVIEW:
                                Cap Rate:                  5.50%

                                Net Operating Income:      $911,723

                                Rental Escalations:        (See ‘Rent Schedule’ on Next Page)

                                Renewal Options:           Eight 5-Year (See ‘Rent Schedule’ on Next Page)

                                Lease Commencement Date:   November 1, 2017

                                Lease Expiration Date:     October 31, 2037

                                Tenant:                    New Albertson’s, Inc. d/b/a Jewel-Osco

                                Guaranty:                  Albertsons Companies, Inc.

                                Year Built:                2012

                                Lease Type:                Absolute NNN - No Landlord Responsibilities

                                Parking:                   292 Spaces

                                Building Size:             57,685 SF

                                Land Size:                 9.97 Acres

-4-
NET LEASE INVESTMENT OFFERING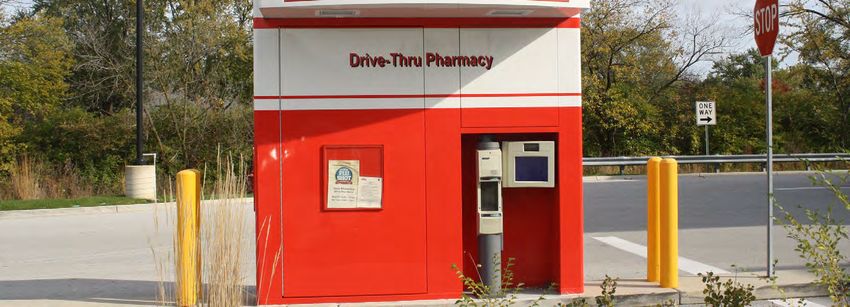
RENT SCHEDULE

                                                                                                                        Current    Monthly                  Increase
                 Tenant                      Square Feet                                     Term                                             Yearly Rent
                                                                                                                         Rent       Rent                      (%)
             Jewel-Osco                        57,685 SF                Current                  -   October 31, 2018   $911,723    $75,977    $911,723
                                                                    November 1, 2018             -   October 31, 2019               $77,117    $925,399      1.50%
                                                                    November 1, 2019             -   October 31, 2020               $78,273    $939,280      1.50%
                                                                    November 1, 2020             -   October 31, 2021               $79,447    $953,369      1.50%
                                                                    November 1, 2021             -   October 31, 2022               $80,639    $967,670      1.50%
                                                                    November 1, 2022             -   October 31, 2023               $80,639    $967,670        --
                                                                    November 1, 2023             -   October 31, 2024               $80,639    $967,670        --
                                                                    November 1, 2024             -   October 31, 2025               $80,639    $967,670        --
                                                                    November 1, 2025             -   October 31, 2026               $80,639    $967,670        --
                                                                    November 1, 2026             -   October 31, 2027               $80,639    $967,670        --
                                                                    November 1, 2027             -   October 31, 2028               $86,687   $1,040,245     7.50%
                                                                    November 1, 2028             -   October 31, 2029               $86,687   $1,040,245       --
                                                                    November 1, 2029             -   October 31, 2030               $86,687   $1,040,245       --
                                                                    November 1, 2030             -   October 31, 2031               $86,687   $1,040,245       --
                                                                    November 1, 2031             -   October 31, 2032               $86,687   $1,040,245       --
                                                                    November 1, 2032             -   October 31, 2033               $93,189   $1,118,263     7.50%
                                                                    November 1, 2033             -   October 31, 2034               $93,189   $1,118,263       --
                                                                    November 1, 2034             -   October 31, 2035               $93,189   $1,118,263       --
                                                                    November 1, 2035             -   October 31, 2036               $93,189   $1,118,263       --
                                                                    November 1, 2036             -   October 31, 2037               $93,189   $1,118,263       --
                                                Option 1            November 1, 2037             -   October 31, 2042              $100,178   $1,202,133     7.50%
                Options                         Option 2            November 1, 2042             -   October 31, 2047              $107,691   $1,292,293     7.50%
                                                Option 3            November 1, 2047             -   October 31, 2052              $115,768   $1,389,215     7.50%
                                                Option 4            November 1, 2052             -   October 31, 2057              $124,450   $1,493,406     7.50%
                                                Option 5            November 1, 2057             -   October 31, 2062              $133,784   $1,605,411     7.50%
                                                Option 6            November 1, 2062             -   October 31, 2067              $143,818   $1,725,817     7.50%
                                                Option 7            November 1, 2067             -   October 31, 2072                FMV*       FMV*         FMV*
                                                Option 8            November 1, 2072             -   October 31, 2077                FMV*       FMV*         FMV*

-5-   * Tenant shall pay equal to the greater of the rent of the proceeding lease year or fair market value.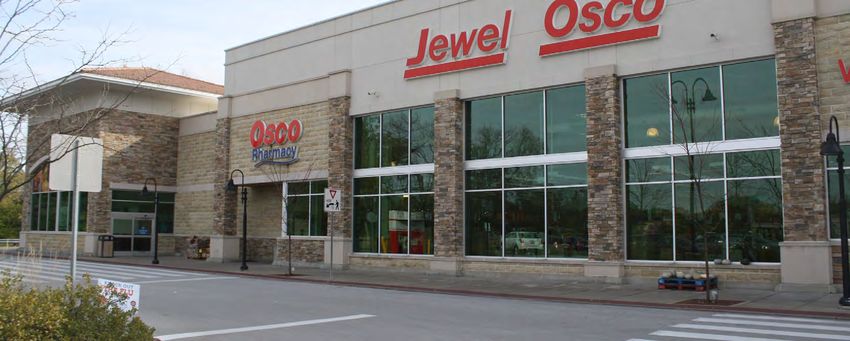
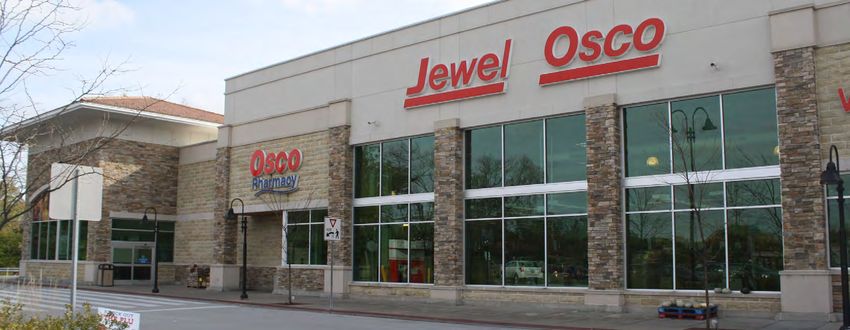
PHOTOGRAPHS

-6-
NET LEASE INVESTMENT OFFERING
DRONES

-7-
NET LEASE INVESTMENT OFFERING
AERIAL

-8-
NET LEASE INVESTMENT OFFERING
AERIAL

-9-
NET LEASE INVESTMENT OFFERING
SITE PLAN

-10-
NET LEASE INVESTMENT OFFERING
MAP

                                Lake Michigan

-11-
NET LEASE INVESTMENT OFFERING
DEMOGRAPHIC REPORT
DEMOGRAPHIC
Population 1-Mile 3-Mile 5-Mile
REPORT:
Total Population 8,880 66,266 246,653
Total Households 3,209 26,433 96,353
Income 1-Mile 3-Mile 5-Mile
Median Household Income $93,314 $69,905 $64,588
Average Household Income $123,663 $94,320 $84,858
-12-
NET LEASE INVESTMENT OFFERINGMARKET OVERVIEW
MARKET Palos Heights, Illinois
OVERVIEW: Palos Heights is a city in Cook County, Illinois with a population of over 12,850 people. The city is a
suburban community located approximately 19 miles southwest of the City of Chicago. Palos Heights
has won the “Governor’s Home Town Award” multiple times. Founded in 1959, Palos Heights has
developed into a mature and dynamic city with a variety of commercial, office, residential, institutional, and recreational uses.
Palos Heights is also well situated with quick and convenient access to various forms of transportation including multiple
interstate highways, State routes, Metra rail service, the Calumet Sag Channel, and Midway International Airport. The City also
has a supportive Chamber of Commerce. The Chamber helps support local businesses and puts on a number of events in the
community including their annual Expo and monthly luncheons.
Employing over 3,100 people, Palos Community Hospital is a major component of the Palos Heights community and is a
strong driver behind the local economy. Palos Community Hospital attracts visitors from all over the region and is a significant
anchor of Palos Heights. The hospital is currently in the midst of a $500 million expansion and renovations project. With
over 1,400 students, faculty, and staff, Trinity Christian College is another significant component to Palos Heights. Its heavily
wooded campus features various dormitories, classroom facilities, Bootsma
Bookstore Cafe and athletic facilities. The Olde Palos Shopping Centre is located along Harlem Avenue in the heart of Palos
Heights. As the City’s “traditional downtown”, the Olde Palos Shopping Centre creates a memorable sense of place that is
unique to Palos Heights that can often get lost in shopping malls and big box stores. Home to several successful restaurants
and small businesses, this area is especially vibrant on Friday and Saturday nights.
www.palosheights.org
-13-
NET LEASE INVESTMENT OFFERINGMARKET OVERVIEW
MARKET Chicago, Illinois
OVERVIEW: Chicago is the most populous city in the Midwestern United States and the third most populous city in the United States with
2,700,000 residents. Chicago is the county seat of Cook County, the second largest county in the United States. The Chicago
MSA is the third most populated metropolitan area in the United States with 9,580,567 residents. The MSA covers over 1,300
square miles and six counties.
The Chicago metropolitan area is home to the corporate headquarters of 66 Fortune 1000 companies, including Boeing,
McDonald’s, Motorola, Discover Financial Services and United Airlines. Chicago is a major hub for industry, telecommunications
and infrastructure and O’Hare International Airport is the second busiest airport in the world in terms of traffic movement.
The metro is a major financial center in North America, and is home to the largest futures exchange in the United States,
the CME Group. Chicago is third in the world on the Global Financial Centers Index which ranks the competitiveness of
financial centers based on people, business environment, market access, infrastructure and general competitiveness. As of
2016, Chicago had the third largest gross metropolitan product in the United States at $640 billion.
The city of Chicago also hosts 12 Fortune Global 500 companies and 17 Financial Times 500 companies. The city claims
two Dow 30 company: aerospace giant Boeing, which moved its headquarters from Seattle to the Chicago Loop in 2001 and
McDonald’s, who’s in the process of moving their headquarters from the Chicago suburbs to the Chicago West Loop. One
additional Dow 30 companies, Kraft Foods is in the Chicago suburbs, as are Sears Holdings Corporation and the technology
spin-offs of Motorola.
Chicago attracts over 50 million domestic leisure travelers, 11 million domestic business travelers and 1.5 million overseas
visitors. These visitors contributed more than $14 billion to Chicago’s economy. Upscale shopping along the Magnificent Mile
and State Street, thousands of restaurants, as well as Chicago’s eminent architecture, continue to draw tourists. The city is the
United States’ third-largest convention destination. A 2011 study by Walk Score ranked Chicago the fourth most walkable of
the fifty largest cities in the United States.
www.cityofchicago.org
-14-
NET LEASE INVESTMENT OFFERINGTENANT OVERVIEW
TENANT Jewel-Osco
OVERVIEW: Jewel-Osco is a supermarket chain headquartered in Itasca, Illinois, a Chicago suburb. Jewel-Osco has 185 stores across
northern, central, and western Illinois; eastern Iowa; and portions of northwest Indiana. Jewel-Osco and Jewel are currently
wholly owned subsidiaries of Albertsons. The company original started as a door-to-door coffee delivery service before it
expanded into delivering non-perishable groceries and later into grocery stores, and supermarkets. Prior to its 1984 acquisition
by American Stores, Jewel evolved into a large multi-state holding company that operated several supermarket chains and
other non-food retail chain stores located from coast to coast and had operated under several different brand names.
Website: www.jewelosco.com
Founded: 1899
Number of Locations: 185 +/-
Headquarters: Itasca, Illinois
-15-TENANT OVERVIEW
Albertsons Companies, Inc.
Company Highlights
Founded in 1939 and based in Boise, Idaho, Albertsons Companies, Inc. (“Albertsons”, or the “Company”) is the 2nd largest traditional grocer in the United
States serving over 34 million customers per week and generating $60 billion in sales annually. In January 2015, Albertsons merged with Safeway, creating a
best-in-class organization dedicated to bringing a better shopping experience to customers across the country. The Company’s powerful combination of strong
local presence and national scale, vast range of brands and products, and service-oriented staff enable them to meet evolving shopping preferences.
As of June 2017, the Company operated 2,329 stores across 35 states under 20 well-known banners with long operating histories. Albertsons has grown
strategically through a series of strategic acquisitions in recent years into a $2.8 billion adjusted EBITDA company as of fiscal year 2016 ended February 25, 2017,
and as of Q1 2017 the Company had already generated $771.7 million in adjusted EBITDA.
#1/#2
By market share
2nd largest Operates in 34 million in 66% of the
traditional 2,300+ 35 states $59.7 billion customers 122 MSAs
grocer in the US retail stores including Washington, DC annual sales per week in which it operates
$ 4th largest Home delivery in
$2.8 billion 500 new items
Experienced management
Currently executing e-commerce 8 of top 10
with 32 years
adj. EBITDA launched every year $800 million platform US markets
in FY 2016 in retail on average synergy realization plan in the US by end of FY 2017
Nation’s largest brand
One of the largest
1,700+ in-store 380+ fuel 28 distribution 18 food and
of USDA-certified
retail employers
273,000 jobs pharmacies stations centers beverage plants organic products
COMPANY BANNERS
-16- Company Highlights 2TENANT OVERVIEW
Albertsons Companies, Inc.
Competitive Landscape
Albertsons Companies, Inc. is one of the largest food retailers and the second largest traditional grocer in the United States.
TOP 10 US FOOD RETAILERS: STORE COUNT
5,000 4,672
4,000
2,800
3,000 2,324 2,076 1,802
2,000
1,146
756 508
1,000 370 229
0
TOP 10 U.S. FOOD RETAILERS: GROCERY SALES ($ BILLIONS)
$200 $169
$150
$98
$100
$56 $49 $48
$50 $32 $31 $23 $16 $12
$0
Notes:
- Store counts based on publically available information
- Walmart, Costco, and Target grocery sales based on a percentage of total sales as of the latest fiscal year.
- Kroger and Albertsons sales exclude fuel sales of ~$14 billion and ~$3 billion, respectively
-17- Competitive Landscape 3Randy Blankstein
President
847.562.0003
randy@bouldergroup.com
Jimmy Goodman
Partner
847.562.8500
jimmy@bouldergroup.com
3520 Lake Avenue, Suite 203
Wilmette, IL 60091
www.bouldergroup.comYou can also read


