JAGUAR LAND ROVER GOLDMANSACHS LEVERAGEDFINANCE - Ben Birgbauer, Treasurer
←
→
Page content transcription
If your browser does not render page correctly, please read the page content below

JAGU A R L A N D ROV E R
G O L D MA N S A CH S L E V ERA G ED F I NA NCE

Ben Birgbauer, Treasurer                          4th September 2018
D i s cl ai m e r

Statements in this presentation describing the objectives, projections, estimates and expectations of Jaguar Land Rover Automotive plc and its direct and
indirect subsidiaries (the “Company”, “Group” or “JLR”) may be “forward-looking statements” within the meaning of applicable securities laws and
regulations. Actual results could differ materially from those expressed or implied. Important factors that could make a difference to the Company’s
operations include, among others, economic conditions affecting demand / supply and price conditions in the domestic and overseas markets in which
the Company operates, changes in Government regulations, tax laws and other statutes and incidental factors

-       Q1 FY19 represents the 3 month period from 1 April 2018 to 30 June 2018
-       Q1 FY18 represents the 3 month period from 1 April 2017 to 30 June 2017
-       FY19 represents the 12 month period from 1 April 2018 to 31 March 2019
-       H2 FY19 represents the 6 month period from 1 October 2018 to 31 March 2019
-       LTM represents the 12 month period from 1 July 2017 to 30 June 2018
-       FY18 represents the 12 month period from 1 April 2017 to 31 March 2018
-       FY17 represents the 12 month period from 1 April 2016 to 31 March 2017

Unless stated otherwise sales volumes are expressed in thousand units, and financial values are in GBP millions

Consolidated results of Jaguar Land Rover Automotive plc and its subsidiaries contained in the presentation are unaudited and presented under IFRS as
approved in the EU.

Retail volume data includes and wholesale volume includes sales from the Company’s unconsolidated Chinese joint venture (“CJLR”)

EBITDA is defined as profit before income tax expense, exceptional items, finance expense (net of capitalised interest), finance income, gains/losses on
unrealised derivatives and debt, gains/losses on realised derivatives entered into for the purpose of hedging debt, share of profit/loss from equity
accounted investments and depreciation and amortisation.

EBIT is defined as for EBITDA but including share of profit/loss from equity accounted investments and depreciation and amortisation.

Certain analysis undertaken and represented in this document may constitute an estimate from the Company and may differ from the actual underlying
results
                                                                         -2-
A g e nda

Business overview                 4

Recent financial results         12

JLR Strategy                     18

                           -3-
Consistent strategy
Inve sting to drive susta ina ble prof ita ble grow th

                 Business Blueprint                               Investment strategy

                                                     Products                            Technology

                                                                Capacity and infrastructure

                                          -4-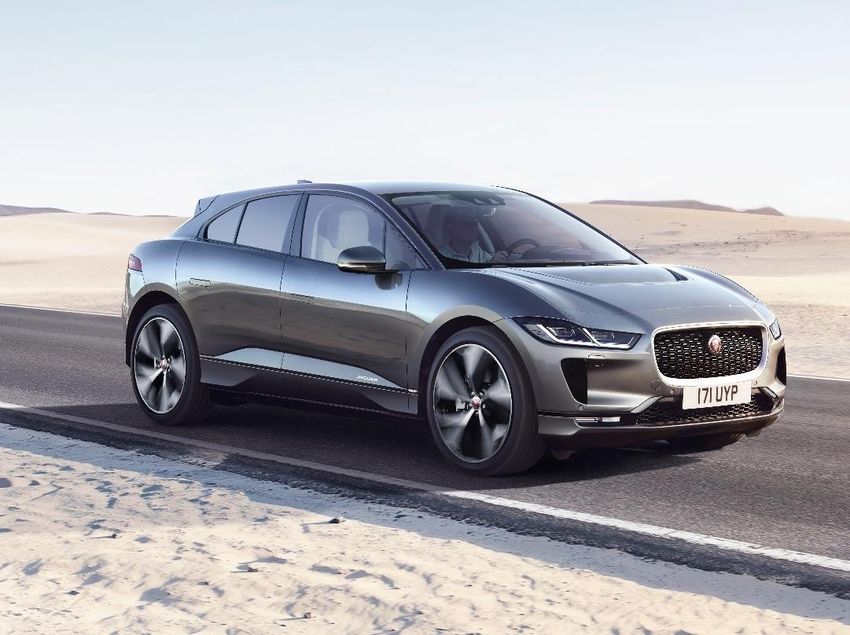
Growing Jaguar Land Rover model range

LUXURY          SPORTS                           LIFESTYLE                       LUXURY – RANGE ROVER      LEISURE - DISCOVERY            DUAL PURPOSE - DEFENDER

XJ              F-TYPE Coupe                      F-PACE                             RANGE ROVER           ALL NEW DISCOVERY              LAND ROVER DEFENDER
                                                                                                                                          Replacement in development

XF SPORTBRAKE   F-TYPE CONVERTIBLE                E-PACE                             RANGE ROVER SPORT     DISCOVERY SPORT

XE
XF                                                I-PACE                             RANGE ROVER VELAR

XE
                                                 XFL                                                          RANGE ROVER VELAR WINNER
                         JAGUAR F-PACE WINNER          JAGUAR F-PACE WINNER
                                                                                                                     WORLD CAR AWARDS
                           WORLD CAR AWARDS              WORLD CAR AWARDS
                                                                                                                        2018 WORLD CAR
                               2017 WORLD CAR                2017 WORLD CAR
                                                                                                                     DESIGN OF THE YEAR
                                   OF THE YEAR            DESIGN OF THE YEAR

                                                                                     RANGE  ROVER EVOQUE                                   VELAR, F-PACE & E-PACE
XE                                                                                   Range Rover
                                                                                                                                               F-PACE & E-PACE
                                                                               -5-
Technology transformation underway (ACES)

   AUTONOMOUS             CONNECTED                        ELECTRIC                      SHARED

• Waymo long         • Remote smartphone          • All JLR models will have an   • Ride hailing
  term partnership     app                          electric option from 2020       service
• Self drive valet   • Wi-Fi Hotspot              • Range Rover and Range         • Community
  park testing in                                   Rover Sport Plug-in hybrids     car sharing
                     • SOS Emergency Call
  the UK                                            now on sale                   • Self driving
                       and roadside
                       assistance                 • I-PACE battery electric         taxi service
                     • Stolen Vehicle               vehicle now available to      • Pay per mile
                       Tracker                      order                           insurance

                                            -6-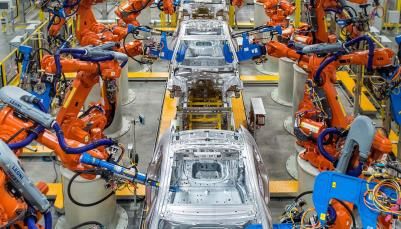
Broader manufacturing footprint

                UK

                     WOLVERHAMPTON
     SOLIHULL            ENGINE            SLOVAKIA
       335K          MANUFACTURING         150K
                        CENTRE
                          500K

    HALEWOOD            CASTLE
                       BROMWICH                               CHINA
       130K
                          53K                                 147k
                                                      INDIA
                                           AUSTRIA    5K
                                           73K

                                  BRAZIL
                                  8K
Strong revenue growth driven by new models
     Re ce nt grow th slow e r: die se l, ince ntiv e s a nd Bre xit
    IFRS, £m

                                                                                         25,787
                                                                                24,340
                                                            22,135     22,287

                                               19,387

                                   15,786
                        13,525

               9,884

               FY11     FY12        FY13       FY14         FY15       FY16     FY17     FY18

Retails
               241       306        375         434          462        522      604      614
(000’s)
New models
launched

                                                      -8-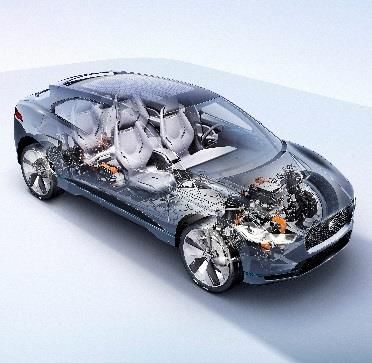
Generated £14b PBT FY11–18
      Low e r prof ita bil ity more re ce ntly
 £ millions

                Increasing profitability FY11-15 reflecting:                          Lower profitability FY16-18, reflecting:
                • Strong volume growth, 18% CAGR, driven                              • Lower volume growth, 8.5% CAGR with
                  by new models, new segments and China                                 market challenges including Diesel
                  market growth                                                         uncertainty, higher incentives and Brexit
                • Lower D&A reflecting capitalisation timing    2,501
                                                                              2,614   • High investment coming through D&A

                                                      1,675                                               1,610
                                     1,507                                               1,557                             1,536

                    1,115

                    FY11             FY12             FY13      FY14          FY15       FY16             FY17             FY18

Exceptionals         -                -                -         -             -         (157)            151              438

EBITDA margin      15.5%            15.6%            14.9%     17.5%         18.7%      14.1%            12.1%            10.8%
EBIT margin        11.5%            12.2%            10.9%     12.9%         13.9%       8.0%             5.9%             3.8%
                                                                       -9-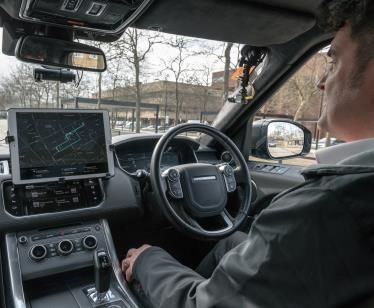
Plan to achieve sustainable profitable growth
With positive ca sh f low ove r the me dium to long te rm

Key actions to improve profitability include:
                                                                                    Medium term targets
•   Volume growth plans moderated to reflect revised market
    conditions                                                             Volume growth   >> Premium Segments
•   Driving cost efficiencies and operating leverage across the business   EBIT %          4-7%
•   Tough choices made on investment plans to meet affordability           Investment      c. £4.5b p.a. in FY19-21
    criteria whilst remaining competitive and innovative

We are targeting sustainable profitable growth with positive cash flow
over the medium to long term                                                         Long term targets
•   Sales growth supported by new products and technology                  Volume growth   >> Premium Segments
•   Continuing to invest in world class capabilities and infrastructure    EBIT %          7-9%
•   Improving contribution margins and operating leverage                  Investment      c. 12-13% of Revenue
•   Moderating investment to c. 12-13% of revenue whilst ensuring
    competitiveness

                                                               - 10 -
Strong balance sheet and liquidity
De bt ma turitie s spre a d e ve nly ove r 10 ye a rs
IFRS, £m
Credit ratings Leverage metrics (LTM)
Moody’s: Ba2 (Stable) Reported gross debt/EBITDA: 1.46x
S&P Issuer credit rating: BB (Stable) Reported net debt/EBITDA: 0.42x
S&P Stand-alone credit profile: BB+
Cash + RCF Debt maturity profile
4,727
Undrawn 3,914
RCF
1,935 196
Undrawn
RCF 3,718
2,792 1,935
534 781 578
381 381 300 400 363
//
Q1 CY18 CY19 CY20 CY21 CY22 CY23 CY24 CY27 Total
FY19 Bonds Other debt: Discounted receivables, finance leases and deferred fees Undrawn RCF Debt
- 11 -RECENT FINANCIAL RESULTS
Q1 FY19 revenue £5.2b, loss before tax £264m
         China duty cha nge , de -stoc k i ng a nd FX re va lua tio n drove loss
IFRS, £m

                  Revenue                 PBT                           Margins                Q1 Commentary
                                    571
                5,599
                                                             EBITDA                  • China duty change (-£110m): higher
                         5,222                                7.9%          EBITDA     VME and lower wholesales
                                                                             6.2%
                                                                 EBIT                • De-stocking (-£110m on 11.3k units)
                                                                 1.2%                  and WLTP (-£30m on 2.7k units)
 Q1

                                                                             EBIT
                                                                            (3.7)%
                                                (264)                                • FX revaluation (-£116m, -£189m YoY):
                                                                                       weaker pound
                FY18    FY19       FY18         FY19             FY18       FY19
                                                                                     • D&A (up £99m): investment in new
                                                                                       models and new capitalisation policy
               24,339   25,786
                                    1,610       1,536        EBITDA
                                                                            EBITDA   • £437m pension credit in Q1 FY18 PBT
                                                             12.1%
                                                                                       not included in EBITDA and EBIT
 Fiscal Year

                                                                            10.8%

                                                                 EBIT        EBIT
                                                                 5.9%        3.8%

                FY17    FY18        FY17        FY18             FY17        FY18
                                                        - 13 -
Q1 FY19 Retails 145.5k, up 8k (5.9%)
Wholesales 131.6k, down 6.9k (5%), de -stocking, WLTP change
Units in ‘000
34.4
30.9 31.1
26.4
22.8
North America UK Europe China Overseas*
YoY +2.5 +3.3 (2.4) +0.8 +3.8
Wholesales
Units 27.5 22.0 26.2 33.0 22.8
YoY (1.9) (3.8) (5.1) (1.3) +5.2
Retail volumes include sales from Chery Jaguar Land Rover – Q1 FY19 21,181 units, Q1 FY18 20,309 units
Wholesale volumes include sales from Chery Jaguar Land Rover – Q1 FY19 22,772 units, Q1 FY18 20,560 units. For statutory reporting under IFRS, the Group recognises revenue on wholesales (excluding sales from CJLR) which totals 108,788 Q1 FY19 and 117,916 Q1 FY18. The Group recognises
it’s share of profits from CJLR within EBIT. - 14 -
*Overseas markets includes Australia, Brazil, Colombia, India, Japan, South Korea, Mexico, MENA, Russia, Singapore, South Africa, Taiwan and certain importersJuly 2018 retails 36.1k, down 9.9k (21.6%)
Wholesales 35k, down 16.4k (31.9%), China duty, de -stocking, WLTP
Units in ‘000
9.2
7.4 7.2
6.2 6.2
North America UK Europe China Overseas*
YoY (1.0) (1.4) (2.7) (5.5) +0.6
Wholesales
Units 9.9 7.9 3.5 3.1 6.5
YoY +1.1 (5.0) (6.8) (4.9) (0.9)
Retail volumes include sales from Chery Jaguar Land Rover – July 2018 3,592 units, July 2017 6,673 units
Wholesale volumes include sales from Chery Jaguar Land Rover – July 2018 4,076 units, July 2017 6,805 units. For statutory reporting under IFRS, the Group recognises revenue on wholesales (excluding sales from CJLR) which totals 30,931 in July 2018 and 44,620 in July 2017. The Group
recognises it’s share of profits from CJLR within EBIT. - 15 -
*Overseas markets includes Australia, Brazil, Colombia, India, Japan, South Korea, Mexico, MENA, Russia, Singapore, South Africa, Taiwan and certain importersQ1 FY19 Cash outflow £1.7b after investment
Positive cashflow and worki n g capital expected in H2 FY19
2,000
D&A £549m Payables £(1,088)m
JV profit £(30)m Inventory £(314)m
1,500 Receivables £430m
1,000
£(264)
698 (82)
500 (1,066)
0
(500) (264)
(1,000)
(1,500)
(960) (1,674)
(2,000)
PBT Q1 FY19 Non-cash and other Tax Investment Working Free cash flow
capital
* Free cash flow defined£(226) £128 activities less net cash
as net cash generated from operating £(52)
£46used in investing activities short-term deposits) and £(618)
(excluding movements in £90 after finance expenses and £(580)
fees and payments of lease
obligations. Free cash flow also includes foreign exchange gains/losses on short-term deposits and cash and cash equivalentsImproved profitability expected in H2 FY19
China duty a nd FX non -r e cu r , f a voura ble volume a nd mix
Higher D&A,
UK March Engineering,
,500
reg. Marketing
Chinese
,300 I-PACE new year
E-PACE US 19MY
,100 Velar
18MY RR/RRS
900 Future models
700 FX reval
China duty
500 De-stocking
WLTP
300
100
100)
(264)
300)
500)
Q1 FY19 Q1 non-recurring New and refreshed Lower China Regional Cost efficiency/ PD/other FY19
Loss before tax items models duty - 17 -seasonality operating leverage costs PBTJLR STRATEGY
Target long term EBIT margin of 7-9%

                                              Business challenges
         Geopolitical and    Market and           Electrification,            Driver            High capital
            economic         competitive              diesel                assistance,      investment, new
           environment,     forces -higher        uncertainty and         connectivity and     capitalisation
         including Brexit     incentives             emissions             mobility trends         policy
                                                    compliance

        Growing premium     Exciting new         Improve operating           Drive cost          Modular
           segments           products               leverage               efficiencies       architecture
                                                                                                 strategy
 FY18                                                                                                           Long term
 EBIT                                        Profit improvement drivers                                         EBIT Target

 3.8%                           Target 4 – 7% EBIT in the medium term                                             7-9%
                                                        - 19 -
JLR targeted segments by region
Broa d grow th a cross re gions
(Units in millions)
CAGR 2.6%
7.7
0.4
6.6 UK CAGR 0.8%
1.1
0.4 Overseas CAGR 4%
0.9
Europe CAGR 1.6% 1.4
1.3
2.1
2.0 North America CAGR 1.2%
2.1 China Region CAGR 4.2% 2.7
FY18 FY19 FY20 FY21 FY22 FY23 FY24
Source: IHS Automotive May 2018, JLR Segmentation 2018
- 20 -Continued volume growth expected
Ne w mode ls, ne w se gme nts a nd pre mium se gme nt grow th
1,000
Full year of New models
Premium
Velar, in new
New model Product cycle and SUV
E-PACE, XE segments
I-PACE timing segment
LWB, and EV
growth
800 18MY RR & RRS demand
600
400
200
0
FY18 FY19 Long term
- 21 -16 nameplates by FY24
I-PA CE now la unche d, ne w De f e nde r a nd 2 more to come
LUXURY SPORTS LIFESTYLE LUXURY – RANGE ROVER LEISURE - DISCOVERY DUAL PURPOSE - DEFENDER
XJ F-TYPE Coupe F-PACE RANGE ROVER ALL NEW DISCOVERY LAND ROVER DEFENDER
Replacement in development
XF SPORTBRAKE E-PACE RANGE ROVER SPORT DISCOVERY SPORT
XE
plus 2 additional
nameplates to come…
I-PACE RANGE ROVER VELAR
XE
XFL
RANGE ROVER EVOQUE VELAR, F-PACE & E-PACE
Range Rover
F-PACE & E-PACE
- 22 -Ambitious electrification plans
To me e t custome r inte re st, die se l a nd e missions cha lle n ge s
Range Rover and Range Rover and MHEV, PHEV or BEV on all new MHEV, PHEV or
Range Rover Sport Range Rover Sport and replacement models, starting BEV available on
Diesel Hybrids PHEVs with I-PACE BEV in 2018 all JLR models
2014 2017 2018 2019 From 2020
EV
2 2 3 6 14
Nameplates
- 23 -Investing in Modular Longitudinal Architecture
To ena ble cost e f f icie ncie s a nd f le xibility a cross pow e rtra i ns
ICE & MHEV PHEV BEV
EDU
EDU
Battery
Battery
Battery
EDU
ICE
ICE‘Charge’ cost efficiency initiatives underway
Sourcing & Manufacturing & Marketing & Sales Corporate &
Engineering
Negotiation Logistics Admin
£
MLA and design for Total value management Harbour benchmarking. S&OP to balance supply Manage SG&A cost
increased flexibility, and should design @ New state of the art intl and demand to reduce inflation and achieve
commonality, should cost. manufacturing (eg. SK, inventory and VME economies of scale
standardisation and CN), and in-sourcing costs
scale without Economies of scale and (e.g. engines). Pension restructuring
unnecessary complexity improving logistics and Synergies across both
flexibility, e.g. CN, HU, SK brands
- 25 -‘Accelerate’ transformation initiatives
To be come “Fit f or Future ” in the me dium to long te rm
Product & Sales Material Cost On-time Product Quality Resourcing &
programmes People
Customer Value “Should Design” Optimised Mindset & process Role and process Experiences
based product and resource planning discipline clarity customers love
feature offerings for life
Customer- “Should Cost” Drive consistency, Integrate and Accountabilities
targeted commonality & collaborate with and systems
promotion modularity vendors
effectiveness
Network coverage Purchase lifecycle Step up risk & Retailer service Enterprise
and enhancement planning change capability and resource planning
management capacity
Top Management Commitment
- 26 -Continuing to assess investment plans
Financial management
• Return on investment
Products • Affordability of overall spend versus operating cashflows
• Investment % Revenue
Compliance Architecture
• Capex to D&A ratio
Efficiency drivers
Investment priorities
• Architectures - MLA
Infrastructure ICE to ACES • Commonality
• Flexibility
• Execution
Efficiency
Investment of c. £4.5b p.a. between FY19-21 and
subsequently targeted at c. 12-13% of turnoverConclusion
JLR is implementing plans to achieve sustainable profitable growth with
positive cash flow over the medium to long term, including:
• Sales growth supported by new products and technology but Medium term targets
assuming lower growth rates to reflect recent experience Volume growth > Premium Segments
• Improving contribution margins through driving cost efficiencies EBIT % 4-7%
and operating leverage across the business
Investment c. £4.5b p.a in FY19-21
• Continuing to invest in world class capabilities and infrastructure,
prioritised to meet affordability criteria whilst remaining
competitive and innovative
• Cash flows targeted to improve as we deliver on these plans; but
will remain negative in the near term.
Long term targets
Volume growth > Premium Segments
EBIT % 7-9%
We are committed to achieving sustainable profitable growth
Investment c. 12-13% of Revenue
with positive cash flow in the medium to long termThank You Bennett Birgbauer Jaguar Land Rover
Treasurer, Jaguar Land Rover Abbey Road, Whitley, Coventry
CV3 4LF
Jaguar Land Rover Investor Relations Jaguarlandrover.com
investor@jaguarlandrover.com
- 29 -ADDITIONAL SLIDES
Q1 FY19 Loss before tax £264m
    China duty cha nge , de -stoc k i ng a nd FX re va lua tio n drove loss
                                                                                                                 IFRS, £m
                        Wholesales           China duty   Warranty credit    D&A £(99)m    FX reval
                        down 14k vs.         related      in prior year                    £(189)m incl.
                        retails, 11.3k                    Slovakia and                     £73m FY18
                        de-stocking and                   Graz plant costs                 non-recur gain
                        2.7k WLTP
                                                          Commodity                        FX net hedging
                        China JV profits                  costs                            £138m

  175       133             (80)
  125
   75                                           (99)
   25
 (25)                                                         (90)
 (75)
(125)                                                                           (86)
(175)
                                                                                              (42)
(225)
(275)
                                                                                                             (264)
(325)
         PBT (excl.     Volume, mix            Net        Contribution       Structural   FX & Unrealised     PBT
        exceptionals)    & market             pricing        costs             costs       Commodities      Q1 FY19
          Q1 FY18
EBIT      1.2%                      (3.4)%                  (1.6)%             (1.6)%         1.7%           (3.7)%
                                                             - 31 -
Seasonal profitability and cash flow PBT Q1 Q2 Q3 Q4 Full Year FY19 (264) n/a n/a n/a n/a FY18 571 385 192 364 1,512 FY17 399 280 255 676 1,610 FY16 638 (157) 499 577 1,557 Free cash flow Q1 Q2 Q3 Q4 Full Year FY19 (1,674) n/a n/a n/a n/a FY18 (1,308) (25) (661) 949 (1,045) FY17 (661) 26 27 748 140 FY16 (861) (273) 429 1,349 644
Changing powertrain mix
JLR expects EV to accou nt for 20% of sales medium term

                         JLR UK sales                                            JLR global sales

       CYTD 2017                        CYTD 2018
         Petrol                                         PHEV/EV                                      BEV
          7%                                              1%           ~5%              ~20%         and
                                         Petrol
                                          14%                                                       PHEV’s

         Diesel Diesel
                93%                        Diesel 85%

                                                                       ~60%             ~50%        Petrol
                         JLR EU sales

        CYTD 2017                       CYTD 2018
         Petrol                                            PHEV/EV
          10% ~95%       ~91%            ~87%
                                          Petrol    ~87%     1%
                                          15%

                                                                                                    Diesel
                                                                       ~35%             ~30%
          ~91%
         Diesel 90%                         ~87%
                                           Diesel 84%

                                                                     Near-term      Medium-term
Global JLR segment volumes Grow ing JLR se gme nts Source: IHS Automotive May 2018, JLR Segmentation 2018 - 34 -
Investment in new models, technology, capacity
Signif ica nt inve stme nt in e le ctrif ica ti o n a nd MLA
Long term R&D and capex Long term Investment by activity
R&D expensed, Electrification,
10% 13%
Capacity &
Other, 27% Other
powertrain,
9%
Capital R&D
investment, capitalised,
55% 35%
Products,
51%
Product development capitalisation policy change resulting in capitalisation of c. 70% from c. 85%, effective 1 April 2018
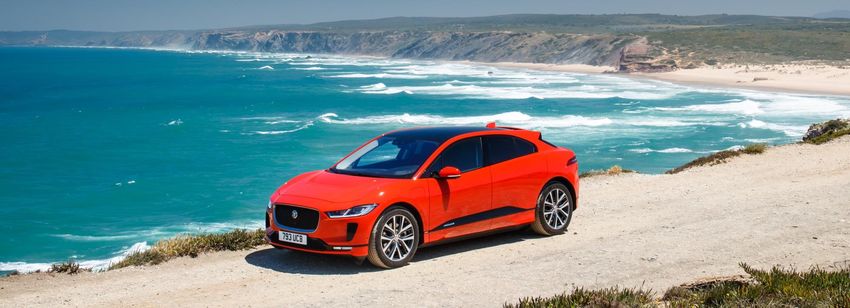
- 35 -Jaguar I-PACE recently launched
Grea t re ce ptio n a nd strong de ma nd
Order Book
c. 5.5 months order cover
20k units over
2020 -21
- 36 -You can also read


