SOCIAL COMMERCE. ON A GLOBAL SCALE - Investor Update: Preliminary Figures HY2 2020 Forecast FY 2021 Berlin, 8 March 2021 - Social Chain

Page created by Kimberly Warner
 
CONTINUE READING
SOCIAL COMMERCE. ON A GLOBAL SCALE - Investor Update: Preliminary Figures HY2 2020 Forecast FY 2021 Berlin, 8 March 2021 - Social Chain
SOCIAL COMMERCE.
ON A GLOBAL SCALE.

Investor Update:
Preliminary Figures HY2 2020
Forecast FY 2021
Berlin, 8 March 2021
SOCIAL COMMERCE. ON A GLOBAL SCALE - Investor Update: Preliminary Figures HY2 2020 Forecast FY 2021 Berlin, 8 March 2021 - Social Chain
AGENDA

A FOCUSSED
WAY TO RE-IPO.

The Organization
Preliminary Figures: 2020
Forecast: FY 2021
Creating Value: Acquisitions and Integrations
Dialogue: Questions & Answers
SOCIAL COMMERCE. ON A GLOBAL SCALE - Investor Update: Preliminary Figures HY2 2020 Forecast FY 2021 Berlin, 8 March 2021 - Social Chain
OUR SOCIAL COMMERCE VERTICALS AND MAJOR BRANDS
Focused on four categories. Satisfying core customer needs.

        FOOD             HOME & LIVING             BEAUTY          FITNESS

      Clasen Bio            Urbanara                Glow        #DoYourSports

                          Ravensberger           viralProtect
        KoRo                                                    World Fitness
                           Matratzen

       3Bears              Lumaland                 Coral         SynBiotic

        Vytal             Möbelfreude             Mabyen

    Planty-of-Meat                              Puffin Beauty

                                                                                3
SOCIAL COMMERCE. ON A GLOBAL SCALE - Investor Update: Preliminary Figures HY2 2020 Forecast FY 2021 Berlin, 8 March 2021 - Social Chain
SOCIAL COMMERCE VERTICAL: FOOD
Investment focus: Sustainable, healthy food and food services.
Consolidated under The Food Chain GmbH.
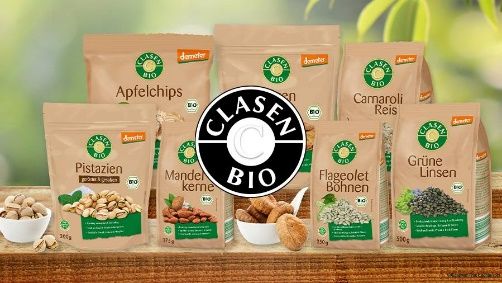
                Clasen Bio (100%)
                The green brand with honest organic food.
                clasen-bio.de

                KoRo (57%)
                High-quality food and superfoods, sold direct-to-
                customer in bulk packages.
                korodrogerie.de

                3Bears (15%)
                Simple and delicious oat recipes, made from all-
                natural ingredients and superfoods.
                3bears.de

                VYTAL (12.4%)
                Digital mutiple-use system for takeaway and
                delivery food. Total avoidance of plastic waste.
                vytal.org

                PLANTY-OF-MEAT (10%)
                Plant-based meat alternatives with sunflower as
                an innovative source of protein.
                planty-of-meat.de
                                                                    4
SOCIAL COMMERCE. ON A GLOBAL SCALE - Investor Update: Preliminary Figures HY2 2020 Forecast FY 2021 Berlin, 8 March 2021 - Social Chain
SOCIAL COMMERCE VERTICAL: HOME & LIVING
Investment focus: Affordable luxury products with low return rates.
Consolidated under Urbanara Home & Living GmbH.

               URBANARA (100%)
               Innovative Direct-to-Consumer brand for
               natural home & living accessories.
               urbanara.de

               RAVENSBERGER Matratzen (100%)
               Individually-tailored mattresses and bedroom
               accessories.
               ravensberger-matratzen.de

               Lumaland (100%)
               Global e-commerce network for home & living
               accessories and German market leader for bean bags.
               lumaland-sitzsack.de

               Möbelfreude (100%)
               Contemporary furniture and boxspring beds for
               modern interiors.
               moebelfreude.de

                                                                      5
SOCIAL COMMERCE. ON A GLOBAL SCALE - Investor Update: Preliminary Figures HY2 2020 Forecast FY 2021 Berlin, 8 March 2021 - Social Chain
SOCIAL COMMERCE VERTICAL: BEAUTY & HEALTHCARE
Investment focus: Beauty products with high social media awareness.
Consolidated under The Beauty Chain GmbH.
                                GLOW (100%)
                                Europe´s largest beauty festival. Highly engaged
                                community. GLOW-branded products.
                                glowcon.de

                                viralProtect (100%)
                                Quality selection of healthcare and hygiene
                                products.
                                viralprotect.de

                                CORAL (51%1)
                                Revolutionizing oral care. All natural ingredients
                                to provide sustainable cleaning power.
                                coraltoothpaste.com

                                MABYEN (51%)
                                Care products for moms and babies.
                                mabyen.com

                                Puffin Beauty (49%)
                                Innovative hair accessories for instant styling.
                                puffin-beauty.com

                                                                                     6
1 Via   an investment company controlled by Social Chain AG
SOCIAL COMMERCE. ON A GLOBAL SCALE - Investor Update: Preliminary Figures HY2 2020 Forecast FY 2021 Berlin, 8 March 2021 - Social Chain
SOCIAL COMMERCE VERTICAL: FITNESS
Investment focus: Lifestyle products to strengthen body and mind.
Consolidated under The Fitness Chain GmbH.

                #DoYourSports (100%)
                Home fitness & yoga accessories.
                Doyoursports.de

               World Fitness Experience (100%)
               Leading fitness convention and branded
               products.
               worldfitness.de

                SYNBIOTIC (20%)
                Fast growing player in the Cannabinoids
                industry.
                synbiotic.com

                                                                    7
SOCIAL COMMERCE. ON A GLOBAL SCALE - Investor Update: Preliminary Figures HY2 2020 Forecast FY 2021 Berlin, 8 March 2021 - Social Chain
OUR SOCIAL COMMUNITIES AND INFLUENCER NETWORKS.
Amplifying brand messages and inspiring customers.

     SPORF                    STUDENT                   GAMEBYTE                 MUSIC LIFE                     CELEBRATE AT         WORLD FITNESS                    GLOW
    We aim to                PROBLEMS                   The leading             Leading social-                    THE GATE             Motivating               The social home
 empower sports              Connecting                   home of                  first music                  The New Year‘s        and inspiring                 of Europe’s
  fans globally.          students through                gaming                publisher with                   Eve show from          to reach                  biggest beauty
The voice of fans.           their shared              entertainment.           highly engaged                 Brandenburg Gate        your fitness                   festival.
                              passions.                                           community.                         Berlin.            potential.

 15.1m followers           11.7m followers             6.7m followers               6.0m followers                3.6m fans             2.7m followers            300k followers

 Large global influencer network providing access to
 a massive number of consumers.
 →   >100 influencers and >10,000 micro influencers.
 →   Global reach focused around the US, UK, and Europe.
 →   Exclusive channel marketing agreements.
 →   ~20% net share from influencers as revenue.                     Jay & Arya           Stefanie Giesinger      Julia Beautx      Ischtar Isik       Die Lochis
                                                                   (5m+ follower)           (5m+ follower)       (4m+ follower)   (1m+ follower)     (
SOCIAL COMMERCE. ON A GLOBAL SCALE - Investor Update: Preliminary Figures HY2 2020 Forecast FY 2021 Berlin, 8 March 2021 - Social Chain
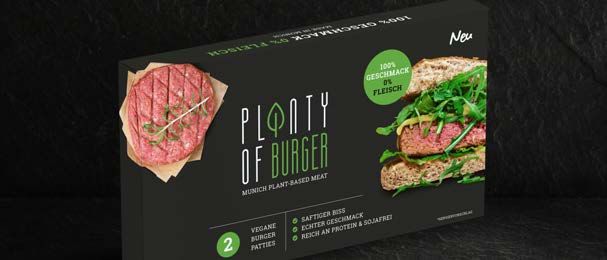
ADVANCED DIGITAL MARKETING SERVICES.
Social Chain global agencies. Creative engines of Social Commerce.
Consolidated under The Social Commerce Alliance GmbH.

                    Social Chain UK (100%)
                    Manchester, London. 200 employees.
                    UK‘s leading Social Media Agency.
                    socialchain.agency

                    Social Chain US (100%)
                    New York, Los Angeles. 50 employees. Working
                    Top clients like Uber, Coca-Cola, Apple.
                    socialchain.agency

                    Social Chain Germany (100%)
                    Berlin. 30 employees. Focused on Social
                    Commerce and influencer marketing.
                    socialchain.agency

                    A4D (100%1)
                    San Diego, Los Angeles. 50 employees.
                    Specialized in digital performance marketing.
                    a4d.com

1 Voting   rights                                                    8
SOCIAL COMMERCE. ON A GLOBAL SCALE - Investor Update: Preliminary Figures HY2 2020 Forecast FY 2021 Berlin, 8 March 2021 - Social Chain
LINKS. OUR STRATEGIC APPROACH FOR A DATA-DRIVEN,
INTEGRATED SOCIAL COMMERCE AND BRAND-BUILDING
PLATFORM.
Securing high performance from Business Intelligence, Data Analytics and Process
Efficiency.

       INTELLIGENCE:
       • LINKS measures every touchpoint possible with customers and prospects.
       • LINKS connects online and offline reach with commerce, converting social reach into sales.
       • Fuelled with internal and external data as well as machine learning algorithms, LINKS combines a
         data-driven closed loop marketing approach with holistic performance management.

       MARKETING:
       • LINKS optimizes marketing spend efficiency data-driven with AI-powered attribution modelling.                3,910
       • Using multiple touch points, LINKS enables to increase CLTV via CRM activities by extensive usage of data.

       COMMERCE:
       • LINKS fosters the conversion of owned reach to product sales.
       • LINKS connects to all online & offline sales channels, including owned shops, third-party marketplaces and
         is focussed on integration into Social Commerce channels, improving sales performance across platforms.

                                                                                                                              10
LINKS. buildING our PROPRIETARY TECH PLATFORM.
State-of-the-art tech platform, fully cloud-based which connects Social Chain
owned and third-party components with a proprietary intelligence core.

                      Offline Events Data                                          Social Media Data
                      → Real audience demographics                                 → Targeting
                      → Product reviews                                            → Engagement
                                                                                   → Comments
                                                                                   → Sharing

                                                          LINKS enables Social
                                                          Chain & its clients to
         Owned Webshops                                          LINKS                               Owned Media Data
         → Purchase behavior data
                                                             execute Social                          → Insights to brand partners
         → Campaign ROI                                  Commerce data-driven                        → Target group demographics
         → Conversion rates                                                                          → Tracking and testing trends
         → Return rates                                       end-to-end.

                      Influencer Network                                           External Commerce Data
                      → Tracking and monitoring social                             → Marketplace data
                         media campaigns                                           → External product data
                      → Conversion rates

                                                                                                                                     11
KEY FINANCIALS.
Significant organic growth. Accelerated by our value creating buy & build strategy.
Increasing profitability.

REVENUE                                                                                                                      EBITDA (adjusted)*
pro-forma consolidated.                                                                                                      pro-forma consolidated.
2019 (actual numbers).                                                                                                       2019 (actual numbers).
2020 (preliminary).                                                                                                          2020 (preliminary).
2021 (forecast).                                                                                                             2021 (forecast).

                                                                                                                                                                                                                  Acquisitions
                                                                                        Acquisitions                                                                                           €3m
                                                                      €90m
                                                                      €80m                                                                                                                                        in negotiation
                                                 + 74%
                                                                                        in negotiation

                                                                                                                                                                                              €15m
                                                                    €320m
                                                    + 40%
                                    €230m
                  + 28%                                                                                                                                         €8m
      €179m

                                                                                                                                     (€7m)

      2019                     FY 2020                              FY 2021
                             (preliminary)                         (forecast)                                                        2019                        2020                         2021

  Preliminary Financial Statements in accordance with German GAAP, pro-forma adjusted. Final financial statement for 2020 might be different.
  *Adjusted items are not considered to represent the underlying operational performance, and, based on their significance in size and nature, are exluded from EBITDA. Examples of adjusted items include costs          12
  associated with acquisitions (completed or aborted), refinancing costs, share-based payment costs, non-recurring costs associated with the setup of distribution and logistics facilities, IT platform integration
  costs and market strategy preparation costs. This is consistent with the way that financial performance is measured by the Management.
FY2020 – PRO-FORMA GROUP EARNINGS
Revenues +28% in 2020 despite Covid19; exceed 2020 by +14%
Organic growth +40% YoY projected for 2021

  REVENUE (EUR million)                                                                           Highlights
  350,0
                                                                       320,7                      •   Preliminary Financial statements on a like-for-like
                                                               +40%
  300,0
                                                                                                      pro-forma basis for Social Chain Group as at 31 Dec.
  250,0                     +28%                 229,4                                                2020
  200,0           179,6

  150,0
                                                                                                  •   No new M&A for 2021 reflected yet, so all organic
                                                                                                      growth, mainly for Social Commerce throughout
  100,0
                                                                                                      2021; healthy M&A pipeline
    50,0

     0,0                                                                                          •   Actuals in 2020 exceed mid-year Forecast by +14%
                  FY19A                          FY20E                FY21FC
                                                                                                      top line
                           Revenue by Business Lines 2019-2021
  250,0
                                                                                                  •   HY2 2020 deal closings: Clasen Bio (Food), A4D
                                                                                                      (Social Media), Coral (Beauty); disposal LoveFood;
  200,0
                                                                                                      wind-down for Wonista
  150,0

                                                                                                  •   EBITDA Margin turned positive to ca. 3% in 2020
  100,0
                                                                                                      (2019: -4.7%); 2021 projected margin 5%
   50,0

    0,0
                  FY19A                          FY20E                FY21FC

                                   Social Commerce   Social Media

   Source: unaudited preliminary German GAAP financial information, pro-forma-consolidated for illustrative presentation
                                                                                                                                                             13
HALF-YEAR EARNINGS – GROUP
Ongoing organic revenue growth since 2019: HY2 2020 +25% YoY
High profit contribution in HY1 2020 by health products

        REVENUE (EUR million)                                                                             ADJUSTED EBITDA (EUR
200,0
                                                                                    186,5                 million)
                                                                                                              15,0

180,0                                                                                                                                                       12,8

160,0
                                                                                                              10,0                  9,1
140,0                                                                 134,2

120,0                                    116,4
                                                        113,0
                                                                                                               5,0
100,0
             89,1          90,5                                                                                                                     2,8

 80,0                                                                                                                                      -1,4
                                                                                                                      0,1    -7,5
                                                                                                               0,0
 60,0                                                                                                                 1H19   2H19   1H20   2H20E   1H21FC   2H2FC

 40,0

 20,0                                                                                                          -5,0

  0,0
             1H19          2H19          1H20          2H20E         1H21FC         2H2FC

                                                                                                              -10,0

        * Prelimany German GAAP financial information, pro-forma-consolidated for illustrative presentation
                                                                                                                                                                    14
FORECAST 2021 – GROUP EARNINGS
Revenue +28% in 2020 despite Covid19
Adjusted EBITDA improvement by EUR 15 million

        REVENUE and ADJUSTED EBITDA (EUR                                                               Highlights
        million)                                                                                       •   Ongoing organic growth in all Verticals; investments in
350,0
                                                                              320,7                        data and logistics (LINKS) and international expansion
300,0
                                                                      +40%                                 to US market (Food and Home & Living)
250,0
                                  +28%
                                                    229,4
                                                                                                       •   Main operating investments into working capital and
200,0          179,6                                                                                       inventory
150,0
                                                                                                       •   COVID19 hit on social media agency business (service),
100,0                                                                                                      recovery in 2021 beyond Q1 2021
 50,0
                               -7,4                                 7,7
                                                                                               15,6    •   Turned 2019 negative EBITDA (-4%) to a profitable 3%
  0,0
                       FY19A                                FY20E                     FY21FC
                                                                                                           in 2020 and 5% in 2021FC
-50,0

                                         Revenues     adjusted EBITDA GROUP

        Source: unaudited preliminary German GAAP financial information, pro-forma-consolidated for illustrative presentation
                                                                                                                                                                     15
HY2 2020 BUSINESS LINES
Growth in Social Commerce more than 50% YoY in HY2 2020 compensates
decline in Social Media (-14% in HY2 2020)

REVENUE HY2 2020 vs HY2 2019 GROUP (EUR                                                          Highlights
million)                                                                                         •    Strong growth by surge in demand for home delivered
90,0
                                                                                                      ecommerce products (Food and Sports)

80,0
                                                                         78,9
                                                                                                 •    Completed Acquisitions of Coral (Health), A4D (Services),
70,0
                                                                                                      Clasen Food, Follow-on: KoRo
                                         +55%
60,0
                                                                                                 •    Social Commerce grows by 51 percent, more than
                  50,9
50,0                                                                                                  compensating declines in digital marketing and social
40,0
                                39,6                                                                  events
                                                                                        34,1
                                                         -14%
30,0                                                                                             •    Social Media declining sales, but less hard hit by general
20,0
                                                                                                      marketing spend cuts by customers during Covid19;
                                                                                                      recovery 2021 beyond Q1 2021
10,0

 0,0
                         2H19                                                   2H20E

                                       Social Commerce    Social Media

       Source: unaudited preliminary German GAAP financial information, pro-forma-consolidated for illustrative presentation
                                                                                                                                                                   16
FOOD VERTICAL
Strong growth of 41% in Q4-20 vs 3Q / +19% vs HY1 2020
Further growth of +40% YoY for 2021

REVENUE FOOD (EUR million)                                                                         Highlights
120,0
                                                                                 105,8             •   Clasen Bio acquired in HY2 2020 to broaden supply of
100,0                                                            +40%                                  organic nutrition products, converting from pure B2B to
 80,0                                            75,8                                                  own webshop and D2C
                                   +78%
 60,0
                                                                                                   •   KoRo demonstrated very strong demand, resulting in
                    42,5
 40,0                                                                                                  strong quarterly and HY2 revenue; constantly
                                                                                                       outperforming budget
 20,0

  0,0
                    FY19A                        FY20E                           FY21FC

60,0                                                                                      56,6

                                                                         49,2
50,0
                                                         41,1
40,0
                                          34,6

30,0
             20,8           21,7
20,0

10,0

 0,0
            1H19            2H19          1H20           2H20E          1H21FC            2H2FC

        Source: unaudited preliminary German GAAP financial information, pro-forma-consolidated for illustrative presentation
                                                                                                                                                                 17
HOME & LIVING VERTICAL
Strong growth of 53% in Q4 2020 / +33% vs HY1 2020
Further growth of +45% YoY for 2021

REVENUE HOME & LIVING (EUR million)                                                                  Highlights
80,0                                                                            75,4

70,0
                                                                                                     •    Strong performance of Lumaland in HY2 (+63% vs HY1)
                                                               +45%                                       and +71% YoY; US Business improved by 50% YoY
60,0
                                                52,0                                                      (formerly reflected in Beauty)
50,0
                   43,3           +20%
40,0
                                                                                                     •    Urbanara +21% in Q4 alone
30,0

20,0                                                                                                 •    Strong Black Friday sales & Amazon Cyber Week uptick
10,0                                                                                                      +100% vs 2019 (+80%)
 0,0
                   FY19A                        FY20E                          FY21FC                •    Ravensberger with similar HY1 and HY2-2020
                                                                                                          performance, despite weaker Q2 and Q3; recovery in
50,0
                                                                                                          Q4 by 22% (QoQ)
                                                                                        46,0
45,0

40,0
                                                                                                     •    Urbanara and Lumaland to drive US market growth
35,0                                                                                                      alongside with logistic network (LINKS)
                                                        29,7           29,4
30,0

25,0        22,3                         22,3
                           21,0
20,0

15,0

10,0

 5,0

 0,0
           1H19            2H19          1H20           2H20E         1H21FC            2H2FC

       Source: unaudited preliminary German GAAP financial information, pro-forma-consolidated for illustrative presentation
                                                                                                                                                                 18
BEAUTY VERTICAL
Strong growth of 68% in 4Q20 / exceptional HY1 2020
YoY growth of +21% for 2021 vs +123% for 2020

REVENUE BEAUTY (EUR million)                                                                      Highlights
35,0

30,0
                                                30,5
                                                                                28,6              •   HY1 2020 was strongly impacted by protective mask and
                                                                                                      sanitizer sales which drove a 249% growth in HY1 -2020 vs
25,0
                                                                -6%                                   HY2 2019; overall met full-year Budget 2020
20,0                             +124%

15,0              13,6                                                                            •   M&A Extension of US business with acquisition of Coral in
10,0
                                                                                                      California; contributing EUR 5 million in 2020 (pro-forma)
 5,0
                                                                                                  •   Additional hygiene products launched in 2021 (eg Covid
 0,0                                                                                                  self-test); 2021 projection is +100% to pre-Covid level
                  FY19A                         FY20E                          FY21FC
                                                                                                      (2019)
30,0

25,0                                     24,3

20,0
                                                                                        17,4

15,0
                                                                       11,2

10,0
            6,7           7,0
                                                         6,2
 5,0

 0,0
           1H19           2H19           1H20           2H20E         1H21FC            2H2FC

       Source: unaudited preliminary German GAAP financial information, pro-forma-consolidated for illustrative presentation
                                                                                                                                                                   19
SPORTS VERTICAL
Strong growth of +171% in 4Q20 / +20% vs HY1 2020
Further growth of +218% YoY for 2021

REVENUE SPORTS (EUR million)                                                                      Highlights
12,0
                                                                                                  •   HY2 2020 sales driven by high home sport equipment
10,0
                                                                            9,9                       demand during Covid19 restrictions to use gyms
 8,0
                                                                                                  •   Organic growth 2021 gained by social media reach (SPORF)
                                                          +218%
 6,0
                                                                                                  •   Very strong growth projection for 2021 with extended
                                 -12%
 4,0               3,5
                                                3,1                                                   product range
 2,0

 0,0
                  FY19A                        FY20E                       FY21FC

7,0
                                                                                     6,1
6,0

5,0

4,0                                                                3,8

3,0        2,6

2,0                                                     1,7
                                        1,4
                          0,9
1,0

0,0
           1H19           2H19          1H20           2H20E      1H21FC            2H2FC

       Source: unaudited preliminary German GAAP financial information, pro-forma-consolidated for illustrative presentation
                                                                                                                                                                 20
SOCIAL MEDIA
Strong growth of +32% in 4Q20 / +6% vs HY1 2020
Recovery and growth of +56% YoY for 2021 with A4D fully integrated

REVENUE SOCIAL MEDIA (EUR million)                                                                 Highlights
120,0
                                                                                 102,4
                                                                                                   •   Marketing Services and Media Sales still influenced by
100,0                                                                                                  COVID-19 but recovering
                    79,2
 80,0                                                            +54%
                                   -16%          66,4                                              •   Market extension to the US supported by the acquisition of
 60,0                                                                                                  A4D in HY2 2020
 40,0

 20,0

  0,0
                    FY19A                        FY20E                           FY21FC

70,0

                                                                                          59,8
60,0

50,0
                                                                         41,6
             38,8           38,8
40,0
                                                         33,4
                                          31,6
30,0

20,0

10,0

 0,0
            1H19            2H19          1H20           2H20E          1H21FC            2H2FC

        Source: unaudited preliminary German GAAP financial information, pro-forma-consolidated for illustrative presentation
                                                                                                                                                                    21
QUESTIONS & ANSWERS

Social Media is not
a one-way street.
Now it's your turn.

                      22
DISCLAIMER
The content of this presentation is for information purposes only and does not constitute investment
advice or other recommendations pursuant to the German Securities Trading Act by The Social Chain AG
(“Company”) or any of its affiliated companies. The information provided cannot replace investment
advice.
The information contained herein is not to be construed as an assurance of possible price developments
and should not be construed as a request to enter into a transaction. The information contained herein
does not constitute an offer to sell or the solicitation of an offer to sell securities or rights, or a
solicitation to trade in securities or rights.
Accordingly, the Company, its management, employees, advisors and affiliated companies make no
representations or commitments as to the accuracy, completeness or correctness of the information or
opinions contained herein. We assume no liability for direct or indirect damages caused by and/or in
connection with the distribution and/or use of this document. The statements correspond to the status
at the time of the preparation of this document. They may become obsolete due to future developments
without the document being changed.
Like-for-like analysis and scope of consolidation: The Social Chain Group AG (“TSCG AG”) was founded in
2018 and various companies were acquired in 2018 and 2019. In October 2019, the contribution of TSCG
AG and its group companies into TSC AG was registered with the commercial register. The 2019 annual
group financial statements according to HGB therefore included (i) the business of TSC AG for the entire
business year 2019, and (ii) the business of TSCG AG for only three months. As a result, the annual
financial statements 2019 were not indicative of the run-rate or the actual performance of the newly
created group. In 2020, several acquisitions of TSC AG were legally closed at the end of the FY 2020.
Therefore, these acquisitions will be fully consolidated, but will have no or only minimal P/L impact. As a
result, the annual financial statements 2020 also do not fully reflect the current run rate or the actual
performance of the group. Therefore, the form of presentation chosen in this document is a like-for-like
comparison: In order to ensure full comparability and to provide an appropriate basis for the evaluation
of the current status of the business, the figures for 2019 and 2020 are included to the same extent and
structure (identical companies in 2021, 2020 and 2019) as presented in the forecasted numbers for 2021.
The final figures under the audited group financial statements may therefore differ from the numbers
presented herein.

                                                                                                              23
Back-up
You can also read