Porirua City Council 2021-31 Long Term Plan and three waters investment options - Julie Alexander General Manager, Network Strategy and Planning ...
←
→
Page content transcription
If your browser does not render page correctly, please read the page content below
Page 1

Porirua City Council
2021-31 Long Term Plan
and three waters
investment options

Julie Alexander
General Manager, Network Strategy and Planning, Wellington Water
Page 2

Today Wellington Water is presenting options on
investing in Porirua City Councils three waters assets to
improve performance and reduce the risk of failure

Today’s presentation provides context on three waters issues, investment
options to meet these challenges and seeks direction for Porirua City
Councils 21-31 LTP on:
1.   Which investment options to take for looking after existing
     infrastructure?
2.   What level and pace of growth investment to include?
3.   How many and which regional priorities to begin to address over the
     next 10 years?
     • Reducing Water Consumption
     • Improving Environmental Water Quality
     • Reducing Carbon Emissions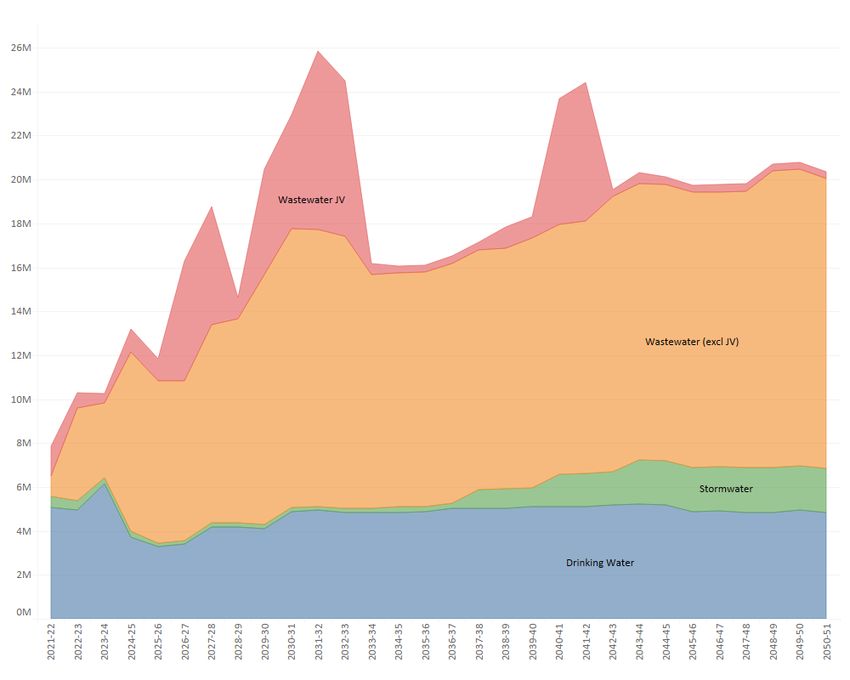
Page 3

The context for three waters issues:
LTP approach, and progress of the LTP process

Aging water assets are a national issue.

In Porirua , around 60% of three waters assets are due to be replaced in the
next 30 years (based on age), and they are getting older.

This poses a steadily increasing risk to core three water services and healthy
growing communities

At the same time, community expectations are increasing, and so are
national standards: water regulator, freshwater management

Growth, reducing water consumption, improving water quality and climate
change are all additional challenges facing three waters asset owners
Page 4

A staged process of advice and options for
the 21-31 long term plan
                                                                                 LTP advice stages
To support engagement with Porirua City Councils communities
based on a full understanding of local, regional and national                        Stage 1
issues, Wellington Water prepared a summary of the state of the
three waters assets, and the work required to maintain and renew                    Early Signals
them to meet customer and regulatory standards.

This second stage today presents options for an achievable             Current       Stage 2
pathway to address the need to increase maintenance and get on         Stage
top of overdue renewals.                                                            Investment
                                                                                      Options
It prioritises investment in existing assets, which is prudent asset
management practice, and describes what increased investment
would provide.                                                                       Stage 3
                                                                                     Optimised
It also presents possible activities in the agreed priority area of                 three water
Growth, reducing water consumption, improving water quality                         programme
and climate change                                                                 the 21-31 LTP
Page 5 International review confirms a step change is needed – but we can’t do everything The internationally recognised water industry regulator, the Water Industry Commission for Scotland (WICS), has reviewed all our advice to owner councils, based on experience with multiple water entities. Wellington Water early signals investment estimate, using capex as a proxy for annual investment for the region, was that an annual regional investment of $240 million is required, compared to $140m in 2020. WICS concluded a higher level of $300M-$350M in capex annually was required. Wellington Water recognises that this is desirable, but not affordable – clearly councils must prioritise, especially in view of the economic impact of covid-19 Today’s advice is intended to assist Porirua City Council to make choices within this context
Page 6

Priorities for three waters investment

                            Looking after existing assets is foundational to a sound risk
   Looking after existing   management approach. It reduces the risk of surprises that
      infrastructure        usually cost more, and have greater negative effects, than
                            planned work does.
                            Growth is inevitable and must be managed in a way that
          Growth            ensures it doesn’t add to existing challenges for the three
                            waters network

      Reducing water        The other priorities are system wide issues that need
                            addressing over the next 30 year:
       consumption
                            •   The region is near capacity for water supply
                            •   Communities expect better environmental water quality
  Improving environmental       than we have now
       water quality        •   Carbon emissions are a key contributor to climate
                                change

     Reducing carbon        NOTE - Individual activities associated with localised risks
                            will still be progressed
        emissions
Page 7
Investing in OPEX to maintain services and
improve asset knowledge
OPEX modelling shows an uplift of 32% is
Initial OPEX step-
needed by year three. By year ten, 44% is
change:
needed.
20% over 3 years
$1.25M- $1.36M Given the current economic
environment a lower, 20% increase on
40% current levels, achieved over three years
Improve data quality and
usability and asset would allow for the start of the
management performance programmes identified in the step
19% change.
Inspection and condition
assessments to optimise
renewals 20/21 OPEX $7.1M, Excludes 20/21 Bulk Water
36% Levy $4.37M
Planned maintenance to Costs based on 2020 NZD and increases are
manage and reduce risk
indicative
5%
Reactive maintenance
Looking after existing
infrastructurePage 8
Investing to maintain services and improve asset knowledge
Option analysis and risk assessment
Current State OPEX investment Step change OPEX increase over 3 years
Characteristics • Network levels of service trending down • Starts to address backlog
• Renewals backlog increasing year on year • High priority planned maintenance
• Very limited planned maintenance commences
• Limited condition assessment activity • Asset data quality and asset management
• Limitations in asset data and information improvements can be made
constraining good asset management
practices
Impacts and • Unplanned services interruptions • Manageable response times for
Risks increase unplanned service disruptions
• Customer satisfaction decreases • Customer satisfaction increases
• Risk of high criticality asset failure • Risk of further increases in operating
increases costs in later years remains pending
• Greater step change for operating costs is increased condition understanding
inevitable in later years • Asset failure risk better understood, but
• Higher levels of carbon are used remains pending renewals investment
RECOMMENDED APPROACH – SEE NEXT
SLIDE FOR OPTIONS TO STAGE INCREASE
Looking after existing
infrastructurePage 9
Options for staging step change opex increase
over 3 years
Option A Option B Stimulus Option
Increase year 1 10% 6.5% 3%
Increase year 2 5% 6.5% 3%
Increase year 3 5% 6.5% 6%
Commentary Builds necessary Gradually builds Recommended
asset and asset knowledge and option if stimulus
management capability, risk funding is approved
knowledge and profile remains to bridge the
capability to higher for longer capability gap in
mitigate risk profile. than other options. 20/21 and 21-31 LTP
year 1.
Looking after existing
infrastructurePage 10
The Renewals Backlog Challenge
This graph shows the pending investment and backlog investment for the council’s water network
based on the age profile of the pipes (this data only relates to pipes not pump stations and reservoirs):
9.0
PCC Water Supply Network Pipe Renewal Profiles (Basic)
Millions
Summary PCC
8.0
we are here
Backlog based on age 2019-2021
(22% of the network value - $150M) Next 30 years
7.0
6.0
Replacement Values ($)
5.0
4.0
3.0
2.0
1.0
0.0
Renewal Period
Looking after existing
infrastructurePage 11
Investing to meet the renewals backlog
Options analysis and risk assessment
Lower range renewals CAPEX Step change renewals CAPEX increase
Characteristics • Assumes current spend plus • Investment renewals in to reduce
necessary optimised projects to backlog plus necessary optimised
keep the network running, such projects to keep the network running
as regulatory requirements, safe
drinking water, compliance,
treatment plant
Impacts and Risks • Backlog will increase further • Network reliability improves gradually
• Compounding year on year over 30 years, number of service
decrease in service levels interruptions stabilises and starts to
• Inherent risk of service failure trend down
grows • Inherent risk of high criticality asset
• Increased operational response failure still exists but closes over 30
and corresponding compounding years
costs • Emissions from operations trends
down
RECOMMENDED APPROACH – SEE NEXT
SLIDE FOR FUNDING RANGE OPTIONS
Looking after existing
infrastructurePage 12
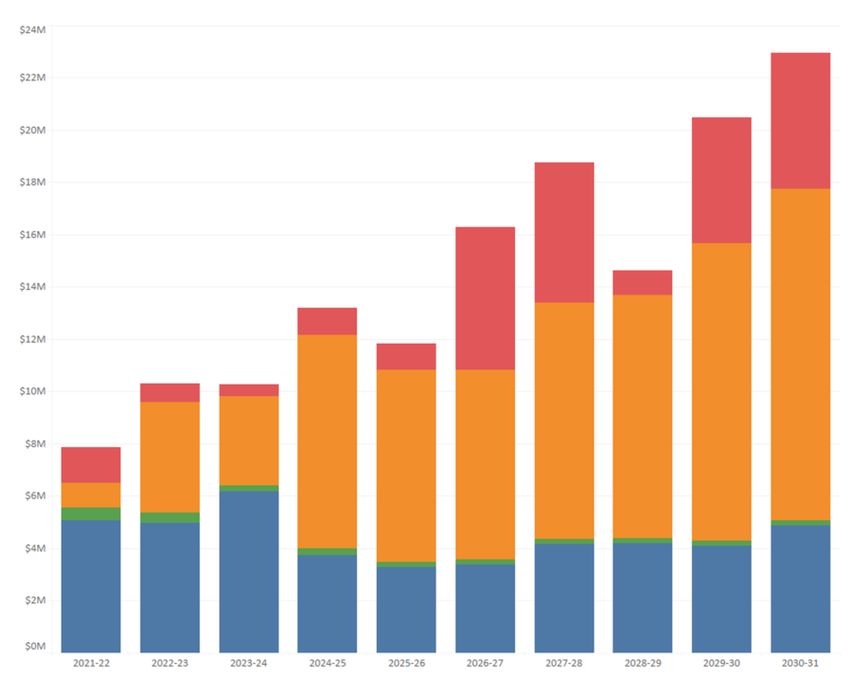
Options for level of CAPEX funding for renewals
There is a relationship between renewal investment and operational costs.
It is important to provide for renewals at a pace that meets the life cycle of the asset and
deterioration over time to reduce the requirement for higher cost reactive renewals and prevent
compounding operational costs.
Condition assessments are important to inform increased evidence-based renewals planning.
Lower range Step change PCC 10 year renewals investment profile 21-31 LTP
renewals renewals CAPEX
CAPEX ($ M) increase
$(M)
10 year TOTAL 40 150
(Includes $34M for
Eastern Porirua
Drinking water 12 45
Stormwater 1 5
Wastewater (excl 18 73
JV)
Wastewater JV 9 27
For project budget estimates, Wellington
Water have used a 95 percentile figure. Costs are based
on 2020 NZD and may vary as more detailed planning is
completed
Looking after existing
infrastructurePage 13
Options for level of CAPEX funding for renewals
Step change renewals
CAPEX increase
$(M)
30 year TOTAL 520 - 570
(Includes $139M for Eastern
Porirua based on age profile)
Drinking water 138 - 150
Stormwater 26 - 28
Wastewater (excl JV) 300 - 330
Wastewater JV 56 - 62
Porirua City Council jointly owns the
Wastewater Treatment Plant and the mains
and pump stations that supply it (with WCC).
The spikes are linked to large gravity and rising
main renewals.
For project budget estimates, Wellington
Water have used a 95 percentile figure. Costs are based
30 year view of identified renewal investment
on 2020 NZD and may vary as more detailed planning is
completed
Looking after existing
infrastructurePage 14
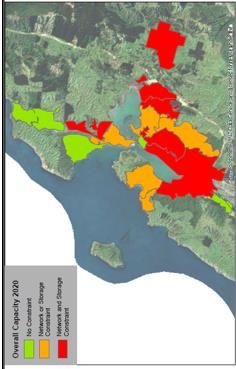
Growth is coming; but it cannot be at
the expense of the environment
Funding 2018-28 LTP LTP 2021-31 30 year spend
Planning completed to date across the
*Capex 6.1m $379m $825m
city’s seven growth areas has identified (strategic city-wide ($182m) ($395m)
capacity constraints. projects included)
Note: A level of funding needs to be included as a placeholder for three water investment in
Significant investment will be needed, Eastern Porirua until Kainga Ora funding is confirmed.
particularly in the wastewater network, Opex $12m $26m
to enable this growth to occur.
It is important to include funding for
growth especially as development is
already underway
How much growth can Porirua City fund
alongside the city’s other three water
investment priorities?
Forecast 50% population growth over
the next 30 years (10,500 new homes)
Water Supply Networks at capacity now
GrowthPage 15
Growth – Porirua City Council
policies can help reduce its impacts
Three Waters outcomes can be achieved by improving and developing the network. There are also
significant opportunities to improve long term outcomes through smart policy, including District
Plan provisions, councils’ policies and bylaws and Wellington Water policies, standards and
guidelines.
Growth pays for growth
Sequence growth in line with existing infrastructure upgrades / renewals
Revise and refine your Development Contributions Policy to ensure existing ratepayers are not
paying for the cost of new developments
Using policy levers to reduce or defer investment and achieve better environmental outcomes
Requirements for water sensitive design and green infrastructure in District Plan provisions
Requiring the repair or replacement of leaking private wastewater and water pipes
Policies and incentives to support water efficiency (i.e. codes of practice and in building consent
process, optional tariffs that reward low usage, etc.)
GrowthPage 16
Three system-wide issues have been agreed which
need addressing over multiple LTP cycles
Reducing the amount of water we consume to enhance environmental
Reducing water outcomes and defer future capital expenditure in new storage.
consumption This a year 5-10 issue. We are close to fully allocating all water
supplies in the height of summer (increasing risk of loss of reliability)
Removing e-coli from our streams, rivers and harbours.
Improving environmental Our wastewater network leaks and overflows, polluting our natural
environment. Communities are very dissatisfied with this.
water quality
This is a 20 year issue. NPSFW targets swimmable water bodies by
2040.
Aiming to be net carbon zero as a country by 2050.
Reducing carbon We are a significant emitter of carbon . While baselines are being set
emissions we are yet to make any meaningful reduction in carbon emissions.
Issues like flooding and seismic resilience will be addressed on a
project by project basisPage 17
Other CAPEX Projects
There are a few additional projects which need to be included in the 21-31 LTP to
either address specific, localised risks or complete projects which are already
underway.
Other (incl. Flooding and Resilience) , PCC 10-yr Capex and Opex
Kenepuru Firefighting upgrade
& Rangituhi Park Flood risk
reduction
Kahu Road and Whanga Cres
seismic upgradesPage 18
Reducing water
consumption
After a period of declining water consumption,
demand is again on the rise. Regionally, we’re
close to full allocation of current drinking water
supplies
We have high levels of leaks – but we don’t have
great information on where they’re occurring,
leaving us in a highly reactive and less efficient
state of network management. More meters –
any meters – will give us better information on
usage.
Our policy position is to “conserve” water, not
build new supplies
so we need to invest in reducing consumption
and leaks.
The risk of doing too little is increased service Reducing water
10 year spend 30 year spend
consumption
interruptions (watering restrictions) and the cost
of a new facility is brought forward Capex $18m $22m
Opex $15m $46m
Activities Activities Activities
Begin area metering Aim
Continue with low level programmes to build network Comprehensive area
education and reactive knowledge; increase metering and /or private Defer $200m-$400m
repair awareness, detection and meters to detect private storage facility
repair services leaks
Note: Opex and capex figures in this slide are additional to the numbers shown earlier
in this presentation and based on 2020 NZD and knowns at time of presentation.Page 19
Improving environmental
water quality
Community expectations supported by Activities
national standards are increasing Continue with low level
reactive repair. Possible
pressure on city councils to stop urban bylaw on lateral repair
water pollution. The target of C level Activities
water quality for urban streams will take Carry out catchment by
catchment investigations
investment in both public and private (roving crews) to
pipes. understand causes and
develop programmes
Activities
Targeted, public and
It has taken a long time for streams to private pipe repairs,
catchment by catchment
degrade and will take a long time to
restore them. The risk of underinvesting
in this work now is that compliance with
standards or meeting community Improving
expectations will not be possible in the Environmental 10 year spend 30 year spend
water quality
target timelines.
Capex $27m $69m
Opex $17m $49m
Note: Opex and capex figures in this slide are additional to the numbers shown earlier
in this presentation and based on 2020 NZD and knowns at time of presentation.Page 20
Reducing carbon
emissions
Driving down carbon emissions usually comes with reducing cost. However, there are a number
of activities to undertake first, to ensure we align investment.
Activities where we can reduce carbon emissions in the three waters:
Sludge decomposition – emission
Water Treatment Chemicals
Baseline opex-
Opex based emissions Electricity
Opex activities generally
Activities
Wellington Water Carbon emission management Sludge minimisation
studies
Capex Benchmark by Renewals – use trenchless technology Activities
Dec 2022 Increase % of trenchless
General Capex activities – carbon reduction in design
renewals
New Asset Sludge treatment facility
Climate change 10 year spend 30 year spend
Capex $15m $15m
Opex $2m $6m
Note: Opex and capex figures in this slide are additional to the numbers shown earlier in this
presentation and based on 2020 NZD and knowns at time of presentation.Page 21
Addressing water consumption is
the top priority
The Wellington region has identified and agreed to three priorities which require a long-
term, whole of system approach to address.
Reducing water Improving environmental Reducing carbon
consumption water quality emissions
2030 2040 2050
Progress towards this priority Understanding which activities Understanding which activities
needs to be made in the next 3 to progress to meet swimmable to progress to meet the Zero
years if the region is to defer water quality targets starts with Carbon Act 2019 targets starts
investment in a new water understanding first. with understanding first.
sourcePage 22
Key Recommendations
Wellington Water recommends investment to look after existing infrastructure as a
priority and recognising the existing economic environment, a lower level of activity
for regional priorities.
Fund an additional $1.3m OPEX over 3 years, supporting a step change increase
in operational costs to look after existing infrastructure.
Fund $150m CAPEX over 10 years for renewals to look after existing
infrastructure.
Fund up to the growth investment level of $379m CAPEX and $12m OPEX over
10 years.
A placeholder is included pending Kainga Ora funding approval.
Council complements growth investments with enabling policies.
Fund $15m OPEX and $18m CAPEX over 10 years in activities that Reduce
Water Consumption to defer investment in a new water source.
Fund $17m OPEX and $27m CAPEX over 10 years to Improving Environmental
Water Quality gradually over time.
Fund $2m OPEX and $15M CAPEX over 10 years to Reduce Carbon Emissions,
Note: These recommendations exceed the proposed PCC fiscal envelope for the three waters.Page 23
Indicative outcomes for additional
investment
Reduce service
environmental
Reduce water
water quality
consumption
interruptions
Defer future
Lower risk of
critical asset
Reduce CO2
satisfaction
investment
emissions
customer
Increase
Improve
failure
Fund $1.3M OPEX* part part part part
Fund $150m CAPEX Renewal part
Fund Growth $379m CAPEX and
$12m OPEX plus placeholder
Fund $15m OPEX and
$18m CAPEX
Fund $17m OPEX and
$27m CAPEX
Fund $2m OPEX and
$15M CAPEX
* Three year funding increase, all others based on a 10 year view.24 24
Page
Direction setting
1. Which investment options to take for looking after existing
infrastructure?
2. What level and pace of growth investment to include?
3. How many and which regional priorities to begin to address over the
next 10 years?
Reducing Water Consumption
Improving Environmental Water Quality
Reducing Carbon EmissionsYou can also read