Water Supply, Sanitation, & Resources Management in The Bahamas; Benchmarking of the Caribbean Water Utilities along with WSC (Bahamas)
←
→
Page content transcription
If your browser does not render page correctly, please read the page content below
Water Supply, Sanitation, & Resources Management
in The Bahamas; Benchmarking of the Caribbean Water
          Utilities along with WSC (Bahamas)

        Presentation to MIYA, INDAQUA &
          Portuguese Water Partnership
          Lisbon & Porto, Portugal (July-2018)
                  John A. Bowleg, PE – Hydrologist
                   Email: wcjbowleg@wsc.com.bs
        Water & Sewerage Corporation (WSC) – The Bahamas
           Water Resources Management Unit (WRMU)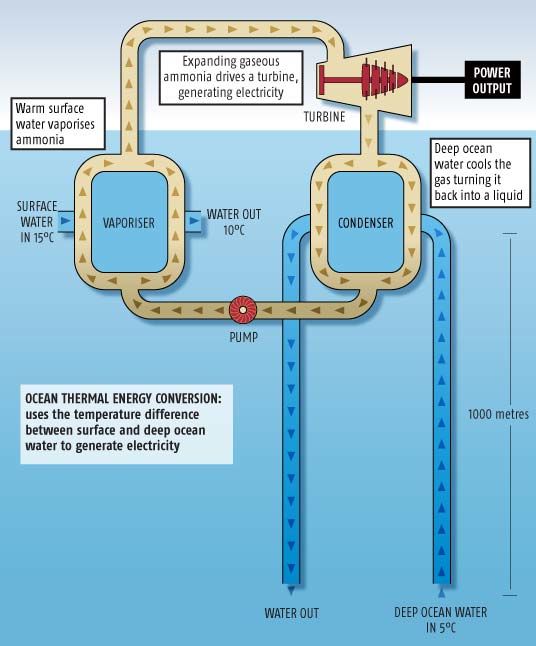
The Islands of The Bahamas
• Low lying carbonate “platform”
  islands with little topographic
  relief (62.78-m or 206-Ft max       FL
  elevation above mean sea level),
• Lack of topography means little
  surface-water runoff, ‘total’
  reliance on fresh groundwater
  floating on deeper salt water
  (which is now augmented by
  desalination – from groundwater),

• Fresh groundwater is generally
  encountered 0.9 to 1.5-meter (3
  to 5-Ft) below ground level.
What is different about the
            Water Resources in The Bahamas?
•   Hydro-geology;
     – All freshwater as a result of rainwater,
     – The freshwater lenses (< 600-mg/L chloride) float on the seawater,
     – Unlimited saltwater source (> 3,000-mg/L) below the freshwater,

•   Land Elevations;
     – 80% of the land within 1.5-m (5-ft) of mean sea level,
     – Readily available freshwater (when present) – to 24.3-m (80-ft),

•   Subsurface Hydrology - Inverted Geothermal Conditions (OTEC & SDC Potential);
     – The deeper you go in The Bahamas, the cooler the water at depth,
     – Indicative of a high degree of exchange with the marine resources,

•   Use Groundwater Wells for SWRO Feed-water & Brine Disposal;
     – Sea/Salt Water is abstracted from 30.4 to 60.9-m (100 to 200-ft),
     – Brine Effluent is disposed at 60.9 to 182.8-m (200 to 600-ft),
     – Saline water from these deep wells can be abstracted/received with little need for
        high pressure pumping, and the process has been very successful in almost all
        situations throughout The Bahamas.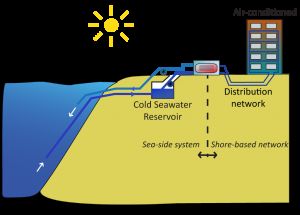
Water Resources in The Bahamas
                   Freshwater lens in an oceanic island similar to The Bahamas.

                                                         RAIN
                                                                                  LOSSES TO
                                                                                  EVAPOTRANSPIRATION

                        RUN OFF                    AERATED ROCK
                        TO THE SEA    RECHARGE                    GROUND W
                                                                          ATER L
                                                                                 EVEL
                                                 FRESHWATER LENS IN
                  SEA                              SATURATED ROCK                            SEA

                                                  BRACKISH WATER

                                                                                HIGHLY SALINE WATER

                Diagram of a Freshwater Lens in an Oceanic Island
                (Like The Bahamas)

Ref: www.earthsci.org
Mean Annual Rainfall for The Bahamas
Priority Areas of Concern for Water Supply,
Sanitation, & Water Resources Management - Bahamas
  •   Climate Change / Variation - as it relates to rising sea levels, and storm
      surges associated with tropical storms. [Sustainable Development /
      Vulnerability / Adaptation Measures].

  •   Water Supply - Transition from natural water supply areas (fresh
      groundwater supplies) to reverse osmosis sources and the partial/total
      abandonment of these areas [Regulatory Framework / Renewable Energy];
      potential development of the unprotected groundwater areas.
      [Groundwater Governance].

  •   Operational - Over-extraction of groundwater lenses, distribution water
      losses due to the antiquated systems [“NRW”]; use of conventional energy
      to produce/distribute water [“OTEC/SDC”].
  •   Environmental - Land & coastal development, excavation of Wetland
      Areas, Forestry Reserves, Marina Construction, Golf Course Developments
      (or additional high water consumers); and other concerns {Fuel facilities,
      industrial and commercial effluents; their disposal, and storage}.
      [Groundwater Conservation/Management/Explorations, all per IWRM Policies].

  •   Sanitation – While septic tanks do serve as primary treatment (separation),
      the effluent discharge is via drainage field into the lens. [Regulatory
      Framework – Environmental]
- Non Revenue Water (NRW) - Utility Company Response to NRW on New Providence: Water Conservation / Management of Distribution System Losses
TYPICAL SEAWATER DISTRICT COOLING (SDC) &
OCEAN THERMAL ENERGYCONVERSION (OTEC)
SDC or Seawater Air Conditioning (SWAC) uses & cool water supply for the chiller system.
OTEC requires a 20oC (36oF) temperature differential of cool / warm sea to run a heat engine.
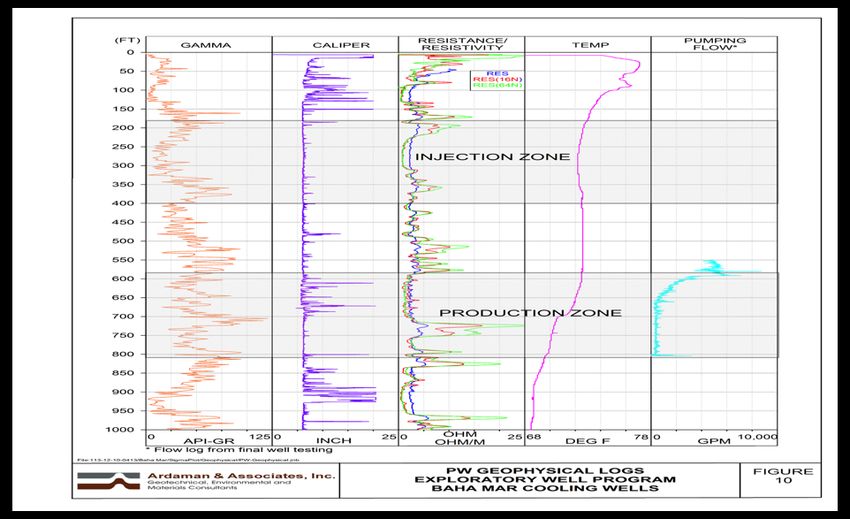
Ref: http//infranetlab.org, http//investinggreenenergy.comAvailable Geophysical Logging Data from New Providence SDC Project [OTEC Research towards Alternative Energy]
BENCHMARKING
        OF CARIBBEAN UTILITY FIRMS

Source: Castalia Advisors Presentation (CWWA Forum, Guyana 2017)
Current Governance and Performance of the Water
Supply and Sanitation Sector in The Caribbean
Nils Janson
3 May 2017Contact Us
Nils Janson Scarlett Piantini
Executive Vice President Senior Analyst
Nils.Janson@Castalia-Advisors.com Scarlett.Piantini@Castalia-Advisors.com
+1 (202) 466 – 6790 +1 (202) 466 – 6790
M: +1 (703) 408 – 3802 M: +1 (202) 813 – 6568
14
Paris • Sydney • Wellington • Washington, DC. • New York • BogotáBenchmarked Water Utilities
Annual
Number of
Name Jurisdiction Revenues
Customers
(US$ 000)
BWA Barbados Water Authority Barbados >$120,000 106,580
BWS Belize Water Services Belize $21,551 55,483
WAC Water Authority Cayman Cayman Islands $34,487 17,000
AQUA Aqualectra Curaçao $56,400 79,303
DOWASCO Dominica Water and Sewerage Company Limited Dominica $7,275 22,171
GWI Guyana Water Incorporated Guyana $15,900 176,748
NAWASA National Water & Sewerage Authority Grenada $10,945 42,563
NWC National Water Commission Jamaica $225,659 345,846
PRASA Puerto Rico Aqueduct and Sewer Authority Puerto Rico $1,054,488 1,237,935
WASCO Water and Sewerage Company Inc. Saint Lucia $21,586 47,362
NV Surinaamsche Waterleiding Maatschappij (NV
SWM Suriname $13,702 105,054
Suriname Water Company)
WASA Water and Sewerage Authority Trinidad and Tobago $10,161 419,152
WSC Water and Sewerage Corporation The Bahamas $45,928 59,001
15Transparency and information availability
§ The benchmarking analysis used publicly available data from
water utilities and data provided by the utilities
§ Note regarding availability and quality of information
§ Great water utilities have an immediate and deep understanding of
their business.
§ In an effective governance framework, utilities make much of this
information readily available
§ The availability and accuracy of this information is a strong indicator
of a well-performing utility within a transparent and accountable
governance framework
16Information provided by each utility
Other
Quality of
Utility Financials Water Balance Operating Coverage Rating
Service
Information
BWS 2016 2016 2016 2016 2016 4
NWC 2012 2016 2016 2016 2016 4
WSC 2015 2015 2015 2015 2015 4
AQUA 2015 2015 2015 2015 2015 3
WASA 2016 2012 Not provided 2016 2016 2
DOWASCO 2013 2015 Not provided 2015 2015 2
NAWASA 2015 2015 2015 2015 2014 2
SWM Not provided Not provided 2015 2015 2015 2
WASCO 2015 2014 Not provided 2015 2015 1
GWI Not provided Not provided Not provided Not provided Not provided 0
17Public availability of data
Audited Key
Current tariff Ongoing
Utility financial Annual reports performance Rating
schedule business plan
statements indicators
BWS 2015 2015 Yes 2015 2015-2020 4
PRASA 2016 2016 Yes 2012 2014-2018 4
NWC 2016 2014 Yes 2013 2014-2018 3
AQUA 2015 2015 No 2015 2013-2018 3
WSC 2015 2015 Yes 2015 No 3
WAC 2015 2015 No 2012 No 3
NAWASA 2014 2014 No 2010 No 2
WASCO No 2013 No 2008 No 1
BWA No No No 2009 No 0
DOWASCO No No No 2011 No 0
GWI No 2008 No 2002 No 0
SWM No No No 2016 No 0
WASA No No 18 No 1993 No 0Improved water coverage at the country level is almost
universal
100% 1%
3%
9% 9% 12%
90% 12% 19%
22% 31%
80%
Proportion of total population
70% served with other improved
water
60%
Proportion of total population
50% 98%
95% served with piped water
88% 87% 86%
40% 84% 81%
72%
67%
30%
20%
10%
0%
Barbados Bahamas Grenada (2014) Saint Lucia Antigua and Trinidad and Belize (2015) Jamaica (2015) Guyana (2015)
(2015) (2015) (2015) Barbuda (2014) Tobago (2015)
Source: WHO/UNICEF Joint Monitoring Programme, 2015
Belize, Guyana, Jamaica, Suriname, and Trinidad and Tobago have piped water coverage
below the Latin American and Caribbean average of 89%
19Water and sewerage coverage by utility
Desired position
20BENCHMARKING QUALITY OF SERVICE, AND
OPERATING AND FINANCIAL PERFORMANCE OF
WATER UTILITIES IN THE CARIBBEAN
§ Information available indicates quality of service needs to improve
§ Operating efficiency in many utilities is low
§ Not all utilities are financially sustainable (>2)
§ Some utilities are not investing at an adequate rate
21Information available indicates quality of service needs to improve
Average
Quality of Continuity of Customer
Utility Water Overall
Water Supplied Service Service
Pressure
BWS 96% 24 24 25 3
WASA 97% 24 43 TBD 3
WSC 100% 24 22 85 3
BWA 94% TBD TBD TBD TBD
GWI TBD 12 TBD TBD TBD
NWC 98% TBD 36 TBD 2
SWM 95% 24 TBD TBD TBD
Source: Information provided by utilities
Note:
• Quality of water supplied refers to the percentage of water-quality tests that meet the
WHO standards
• Continuity of service refers to the average of hours of service per day
• Customer service refers to complaints per year per 1,000 customers
• Water pressure is measured in pounds per square inch (PSI)
22Operating efficiency in many utilities is low
Non-Revenue Collection
Utility Staffing Overall
Water Efficiency
BWS 4 24% 4 3 4.8 3
DOWASCO 2 40% 2 2 5.7 2
WSC 2 38% 3 1 7.3 2
NAWASA 3 28% 2 2 6.5 2
NWC 1 58% 2 2 5.5 2
WASCO 1 50% 1 2 6.0 1
WASA 1 50% 0 0 12.8 1
BWA 1 55% TBD 1 7.7 1
SWM 2 39% TBD 1 8.9 1
GWI 1 63% TBD TBD TBD 1
Note: Harvey Balls are round ideograms used for visual communication of qualitative information. They
provide a range from 0 to 4 to show the extent to which each data point applies. A 4 indicates high level of
success and a 0 indicates low level of success
The value for ‘Staffing’ is the number of employees per 1,000 water customers
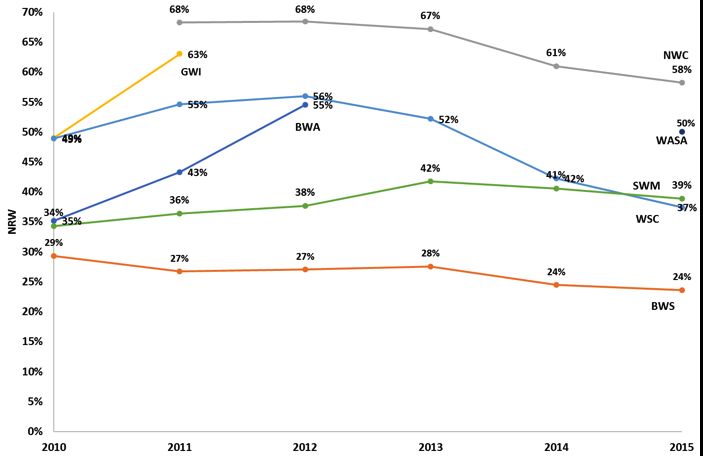
23Some utilities improved their NRW levels
Most recent NRW
level
According to the World Bank, utilities will benefit from reaching NRW
levels below 30% 24Staff productivity: most utilities below efficient levels
Number of employees per 1000 water customers
12.8
8.9
7.7 7.3 6.6
6.5
6.0 5.7 5.5
4.8
4.10
3.47
25Composition of operating expenses
Other operating costs
Electricity costs as percentage of
OPEX
Staff costs as percentage of OPEX
Note: WASA did not provide the information to calculate electricity costs as a percentage of operating
expenditures 26Comparing staff compensation with productivity
Low compensation High compensation
Low productivity Low productivity
9 WSC (2010 -
Average Number of employees per 1000
DOWASCO (2010 2016)
8
- 2016)
7 WASCO (2010 -
6 2016)
water customers
5 NWC (2010 -
4 BWS (2010 - 2016) AQUA (2010 - PRASA (2010 -
2016) 2016) 2016)
3
2
1 Low compensation High compensation
High productivity High productivity
0
0 10,000 20,000 30,000 40,000 50,000 60,000
Average Annual Compensation (US$)
27Some utilities need to increase collection efficiency
Accounts Receivable (Days)/Revenues
200 188
180
Accounts receivable/Sales
160
140
Revenue (days)
113 108
120
100 89
77 75
80 83
60
60 48
41
40 29
20
0
28Definition of financial sustainability for water utilities
A water utility that is financially sustainable :
§ Covers its operating expenses with cash from operations
§ Offers service at affordable tariffs
§ Meets and has a reasonable plan to meet targets for access
and quality of service for at least 5 years
§ Is able to access finance to cover financing needs
§ Provides expected returns to equity providers
29Financial performance of the utilities
EBITDA Net Income / Return on Debt Service Reliance on
Water Utility
Margin Revenues Assets Coverage Ratio Government
DOWASCO (2015) 40% 11% 1% 1.6 No
BWS (2015) 35% 17% 4% 2.2 No
NAWASA (2015) 27% 18% 6% TBD No
WASCO (2014) 22% 14% 5% 6.4 Yes
NWC (2015) 14% -5% -2% 1.1 Yes
WSC (2015) -46% -27% -4% -5.2 Yes
GWI (2012) -55% -20% TBD TBD TBD
WASA (2012) -167% 6% 0.7% TBD Yes
SWM TBD TBD TBD TBD TBD
BWA TBD TBD TBD TBD TBD
Average -16% 2% 2% 1.23
30How the EBITDA margin results from a utility’s operating
efficiency and tariff
60%
5.8 40%
36.6% 35.4%
27.2%
US Dol lars per cubic meter billed
20%
14.3%
0%
3.4 3.4
2.9 3.2
-20%
2.0 2.3
-40%
1.5 1.5
1.1
-60%
-71.6%
-80%
WSC (2015) NWC (2015) PRASA (2014) BWS (2015) NAWASA (2015)
Average OPEX Average Revenues EBITDA MARGIN
§ There are utilities with relatively high tariffs—such as WSC—that have even
higher average OPEX and, therefore, negative EBITDA margins
§ Other utilities with lower average tariffs can produce positive EBITDA margins
since they have lower average OPEX
31Comparing CAPEX and Fixed Assets
Gross book Accumulated
Average CAPEX Average
CAPEX / value per depreciation /
Utility per customer CAPEX /
Revenue customer Gross book
(US$/year) Depreciation
(US$) value
WSC (2011-2015) 481 2.3 70% 7,722 45%
DOWASCO (2011-2015) 202 2.4 58% 3,550 31%
NWC (2011-2015) 202 1.7 28% 3,493 52%
WASA (2012) 129 1.7 49% TBD TBD
BWS (2011-2016) 115 2.9 31% 1,762 21%
NAWASA (2011-2015) 39 1.0 18% 1,258 47%
WASCO (2011-2014) 24 0.3 3% 2,316 65%
BWA TBD TBD TBD TBD TBD
GWI TBD TBD TBD TBD TBD
SWM TBD TBD TBD TBD TBD
Average 170 1.76 37% 3,348 40%
32Tariffs charged by utilities are affordable to consumers
Residential monthly bill Household expenditure on water as a percentage of
household income
33BENCHMARKING GOVERNANCE EFFECTIVENESS OF
THE WATER SUPPLY AND SANITATION SECTOR IN
THE CARIBBEAN
§ Few countries have sector policies that have clear
objectives, measurable targets, as well as associated
financial plans
§ There is often a discrepancy between the sector policies a
country develops and the overall performance of its utility
§ Responsibilities and procedures are not well defined
§ There is a lack of transparency and consumer involvement
§ In some countries, managerial autonomy is limited and
there are weak incentives for operating efficiency
34Comparing sector policies and regulatory frameworks
Body
Tariffs cover
Includes Clear Measurable Tariffs reflect responsible
Country Financial Plan operating
sanitation objectives targets costs for setting
expenditures
tariffs
Barbados ü ü ü Government
Belize ü ü ü ü PUC
Guyana ü ü PUC
Jamaica ü ü ü ü ü ü OUR
Suriname ü Government
Trinidad and ü ü ü RIC
Tobago
The Bahamas ü ü Government
An effective sector policy has the following characteristics:
§ Clear objectives—Governments should set objectives that clearly state the specific outcomes or results
that expected from the water and sanitation sector for a given period
§ Measurable targets—Governments should establish targets with concrete criteria for measuring
progress towards the main objectives. These targets must be quantifiable and trackable, with a specified
time frame for completion
§ Financial planning—Governments should include a funded plan with their policies to ensure that the
targets are financially realistic and attainable
35Comparison of governance framework and utility
performance
36Definition of responsibilities in the sector
Note: Each indicator has been given a value that ranges from 0 to 4. A 4 indicates high level of success and a 0 indicates low level of success
A good governing environment relies on frameworks that clearly define the actors, their
responsibilities and powers, and the concrete measures they are authorized to take
37There is a lack of transparency and consumer involvement
Note: Each indicator has been given a value that ranges from 0 to 4. A 4 indicates high level of success and a 0 indicates low level of success
§ Most countries do not have mechanisms for monitoring complaints or managing public consultations
on tariff issues
§ There are few requirements for water utilities to publicly disseminate information on performance,
costs, and investments
§ Few utilities have information on the quality of service they provide.
38In some countries, managerial autonomy is limited and
there are weak incentives for operating efficiency
Note: Each indicator has been given a value that ranges from 0 to 4. A 4 indicates high level of success and a 0 indicates low level of success
§ Most utilities are not reviewed to ensure costs are reasonably efficient, nor do the utilities
have strong incentives to reduce these costs
§ Some utilities have limited autonomy
39Financial planning does not consider the costs for
expanding and improving services
Note: Each indicator has been given a value that ranges from 0 to 4. A 4 indicates high level of success and a 0 indicates low level of success.
Note: There is no information on financial planning for Barbados and Suriname
§ None of the public water utilities have tariffs that fully cover the cost of expanding and improving
services, particularly wastewater collection and treatment
§ Except for BWS and NWC, utilities in the other countries did not have tariffs that covered their cost of
service as it stands
§ Financial planning for most utilities is vastly inadequate. This is true for BWS and NWC as well, since both
utilities do not consider the higher cost of service associated with increasing wastewater collection and
treatment
40REFERENCE MATERIAL
• Water and sewerage coverage
41While most utilities provide adequate water coverage,
sewerage coverage is inadequate
Water Coverage
Water coverage (%)
100% 100% 96%
97%
73% 79%
§ Only 3 of the benchmarked utilities
70%
67%
57%
provide coverage above the average of
47%
79%
§ SWM and WSC rank the lowest,
providing service to 57% and 47% of
the population in their service area
Sewerage Coverage
30%
§ Of the benchmarked utilities that
provided information regarding this 20%
indicator, the average coverage was 12% 17%
§ WASA is the one with the most extensive 12%
8%
coverage, reaching 30% of the population 4%
in its service area 2%
0%
WASA NWC (2015) BWS (2015) DOWASCO WASCO BWA (2013) AQUA (2015)
(2015) (2015) (2015)
42You can also read