DX (Group) plc Interim Results For the period ended 28 December 2019 3 March 2020
←
→
Page content transcription
If your browser does not render page correctly, please read the page content below
DX (Group) plc
                         “Turnaround to Transformation”
Interim Results
For the period
ended 28 December 2019

3 March 2020
Executive Team
Presentation Team

        RON SERIES, EXECUTIVE CHAIRMAN
        • Appointed Executive Chairman in October 2017
        • Highly experienced in business turnaround situations
        • Previously Chairman of Tuffnells Parcel Express (2002-05) during its successful turnaround
        • Chairman of Braemar Shipping Services plc

        LLOYD DUNN, CHIEF EXECUTIVE
        • Appointed as CEO in October 2017
        • Over 38 years’ experience in express freight and parcels industry
        • Led successful turnaround of Tuffnells Parcel Express prior to its sale
        • Co-founded Nightfreight Plc, a logistics company (listed in 1994, acquired by private equity and
           subsequently by DX in 2012)

        DAVID MULLIGAN, CHIEF FINANCIAL OFFICER
        • Appointed CFO in April 2018
        • Over 20 years’ experience in senior financial roles
        • Previously CFO at Hornby plc, involved in its restructuring and turnaround
        • Before that, CFO of Morgan Sindall Group plc for nine years until 2013, having joined in 1997

2
Team
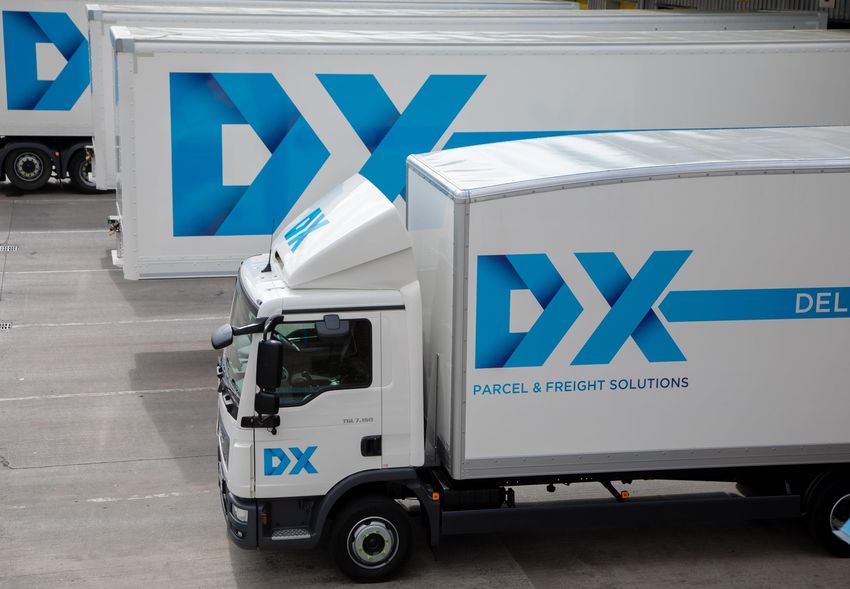
Who We Are
DX is a leading provider of a wide
range of delivery services to both
business and residential addresses
across the UK and Ireland.
75
depots and
service centres
across UK and
3,700 Ireland
employees
110m
items delivered
in FY 2019
• DX Freight fleet of c. 800 vehicles
• DX Express fleet of c. 100 vehicles
• Approx. 500 nightly trunks
3
Our Divisions
DX FREIGHT REVENUE ANALYSIS
DX EXPRESS
Exchange
Specialists in secure, tracked Specialists in irregular dimension
1-Man
express deliveries and weight items (“IDW”) –
awkward freight
Secure H1 2020
DX Courier and Secure offer B2B
and B2C delivery of valuable 1-Man - predominantly B2B £170.1m
items respectively
2-Man and Logistics - B2C focus
Private members B2B service (DX
Exchange) is unrivalled. c.3,500 Tracked, next day and Courier
2-Man
exchanges used by legal, nominated day deliveries
Mail Logistics
financial and public sectors
4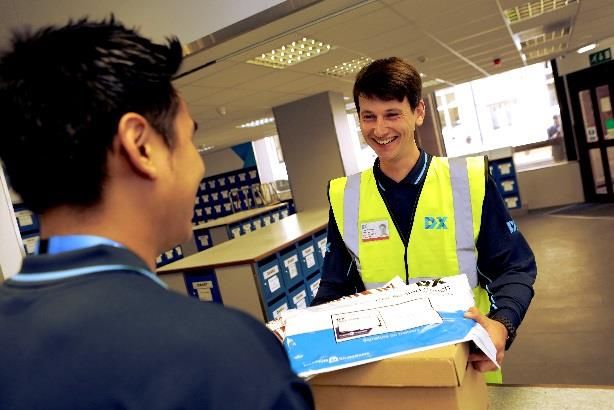
H1 2020 Highlights

    •   Benefits of the turnaround strategy continue to come through
    •   Revenue up by 8%, reflecting strong growth at DX Freight
    •   Return to positive EBITDA for H1 (H1 2019: £2.5m loss; H1 2018 £4.4m loss)
    •   DX Freight division:                                                   H1 2020 Revenue
           - performance driven by new commercial processes, improved customer
             service and productivity gains
                                                                               £170.1m +8%
                                                                                     (H1 2019: £157.0m)
           - basic mechanisation introduced across DX Freight network, which
             increases capacity and productivity                                     H1 2020 Adj EBITDA

           - post period, new depot opened at Ipswich in January , extending the     £0.1m +£2.6m
             network                                                                 (H1 2019: £(2.5)m)

                                                                                     H1 2020 Adj LBT
    •   DX Express division:
           - revenue growth at DX Secure and Courier; decline at DX Exchange         £(1.2)m +£3.4m
                                                                                     (H1 2019: £(4.6)m)
             slowed
                                                                                      • Period ended 28 December 2019
           - roll-out of new ETA functionality has commenced, improving the
                                                                                         (H1 2019: six months ended 31 December
             market proposition
                                                                                         2018)
                                                                                      • Figures are on a comparable IAS17 basis
    •   £10m capital investment programme commenced
                                                                                         unless otherwise stated

5
Financial Summary
David Mulligan
Chief Finance Officer
            6
Financial Highlights

    All figures on comparable IAS 17 basis

    £m                                         H1 2020         H1 2019            Change           FY 2019
    Total revenue                                    170              157        +£13.1m              323    •   Revenue up 8% - continued

     DX Freight                                        87              78         +£8.9m              159        strong growth

     DX Express                                        83              79         +£4.2m              164    •   DX Freight losses reduced by

    EBITDA                                            0.1           (2.5)         +£2.6m               3.3       65%
                                                                                                             •   Courier/Secure revenue growth
     DX Freight                                     (1.9)           (5.5)         +£3.6m             (7.8)
                                                                                                                 at DX Express offset by reduced
     DX Express                                     10.9             11.6          -£0.7m             26.9
                                                                                                                 attrition in annuity income at DX
     Central overheads                              (8.9)           (8.6)          -£0.3m           (15.8)
                                                                                                                 Exchange
                                                                                                             •   Expected increase in central
    Underlying operating
                                                    (1.0)           (4.4)         +£3.4m               0.2       overheads from IT investment
    (loss)/profit1
    Adjusted (LBT) 1                                (1.2)           (4.6)         +£3.4m             (0.2)
    Net debt                                          8.4             3.5         +£4.9m               1.3
    Cash (outflow)/inflow
                                                    (4.9)           (1.4)          -£3.5m              3.2
    from operating activities
     1 Adjusted for amortisation of acquired intangibles (£0.1m) and share based-payments charge
     (£0.6m) (H1 2019: £0.1m and £0.6m respectively)
7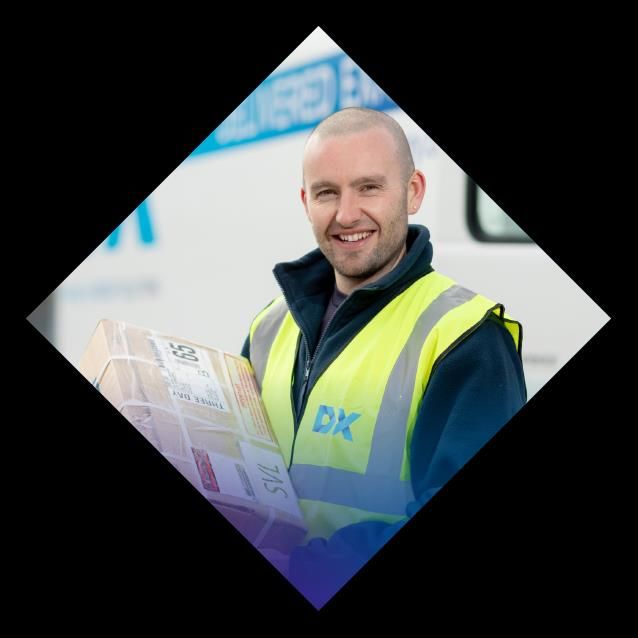
Cash Flow
                     All figures on comparable IAS 17 basis

                    £m                                                                                       H1 2020                       H1 2019
                    EBITDA profit/(loss)                                                                           0.1                         (2.5)
                    Movement in working capital                                                                  (4.6)                           0.4
                    Operating cash flow                                                                          (4.5)                         (2.1)
                    Tax (paid)/received                                                                          (0.2)                           0.8
                    Interest paid                                                                                (0.2)                         (0.1)
                    Capital expenditure                                                                          (2.2)                         (1.0)
                    Free cash flow                                                                               (7.1)                         (2.4)

                                                                                                  •   Seasonal movement in working capital driven
                                                                                                      by reduction in deferred income and cut-off
                                                                                                      before end of calendar month
14.0
12.0
                           1.3
                                                                                                  •   Expect net debt movement to largely reverse
10.0                                  0.1
Net debt (£m)

                                                                                                      in H2 2020; slight increase in working capital
   8.0                                             4.6                                                over course of the year due to expected fall in
                                                                                          8.4
   6.0                                                                                                deferred income
                                                                    0.4
   4.0                                                                           2.2
   2.0
                                                                                                  •   Increased level of capex reflecting investment
                                                                                                      plans to support growth
                -
                         HY 2019     EBITDA   Working capital     Net tax &     Capex   HY 2020
                                                                interest paid                     •   Tax paid relates to profitable Irish business;
                                                                                                      last year benefitted by UK tax rebate
    8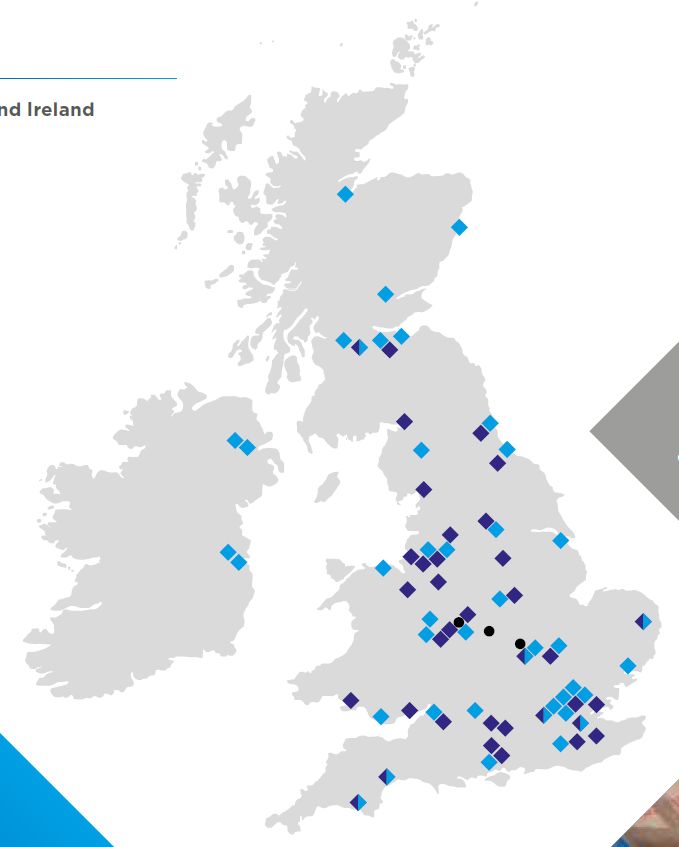
Balance Sheet

    £m                                                                 IFRS16      IAS17     IAS 17      IAS17
                                                                      H1 2020    H1 2020    H1 2019    FY 2019
    Non-current assets              Property, plant and equipment        10.5       10.5         8.4        9.7
                                    Right of use asset                   78.6           -          -          -
                                    Intangible assets and goodwill       31.2       31.2        31.1      31.0
                                    Deferred tax assets                    2.3        2.3        2.6        2.3
    Total non-current assets                                            122.6       44.0        42.1      43.0
    Current assets                  Trade and other receivables          36.5       37.9        36.1      43.1
                                    Current tax receivable                   -          -          -        0.1
                                    Cash and cash equivalents              1.2        1.2        4.2        1.8
    Total current assets                                                 37.7       39.1        40.3      45.0
    Total assets                                                        160.3       83.1        82.4      88.0
    Equity                          Share capital and share premium      30.9       30.9        30.9      30.9
                                    Retained earnings                    (9.4)      (8.9)     (11.0)      (7.3)
    Total equity                                                         21.5       22.0        19.9      23.6
    Non-current liabilities         Lease liabilities                    66.7           -          -          -
                                    Provisions                             4.0        5.2        3.5        5.0
    Total non-current liabilities                                        70.7         5.2        3.5        5.0
    Current liabilities             Lease liabilities                    15.1           -          -          -
                                    Loans and borrowings                   9.6        9.6        7.6        3.1
                                    Trade and other payables             28.9       31.8        34.4      38.1
                                    Deferred income                      13.7       13.7        15.9      17.2
                                    Provisions                             0.8        0.8        1.1        1.0
    Total current liabilities                                            68.1       55.9        59.0      59.4
    Total liabilities                                                   138.8       61.1        62.5      64.4
    Total equity and liabilities                                        160.3       83.1        82.4      88.0

9
IFRS 16 impact
Background
• No distinction between finance and operating leases; all recognised on the balance sheet
• Operating lease cost replaced by depreciation and interest expense
Income statement
• Operating costs reduced by £10.3m with corresponding increase in EBITDA
• Depreciation increases by £8.9m and interest by £1.9m
• Overall Loss before tax reduces by £0.5m
Balance sheet
• £80m Right of Use asset created on transition (1 July 2019); reduced to £78.6m at 28 December 2019
• Movement in the period is £8.9m of depreciation and additions of £7.5m of new leases
• £57m of property leases and £23m of vehicle and equipment leases initially capitalised
• £82.6m of lease liabilities recognised on the balance sheet at transition
Cash flow
• No impact on cash flow or on borrowing facilities
• Net debt will be measured as debt draw under IDF facility less cash and cash equivalents
10Operational Summary
Lloyd Dunn
Chief Executive Officer
11Turnaround to Transformation
Weaknesses New strategy Investment Growth Phase
identified implemented programme
underway
• Return DXF 1-Man to
• Management structure • Devolution of accountability to
• Operational structure • Three year programme to sustained profitability
General and Regional Managers upgrade
• Sales process • Continued revenue growth in
• New organisational structure − IT 2-Man/Logistics
• Pricing
• Customer service levels • Enhanced customer service − Property • DXE expansion of
(especially at DX Exchange) • Investment in sales and − Operational systems Secure/Courier via
• IT systems and estate commercial teams streamlined operation and
• £3.5m already invested in
• New pricing policies improved customer
FY19
Break from previous experience
• Strong focus on: • Further £10m over FY 2020
‘One DX’ strategy and FY 2021 • Expansion of DX Exchange
− DX Freight (severely loss-
service
making)
• Targeting Group net margin of
− DX Exchange service (in
5-6% by FY23
decline)
FIRM PLATFORM NOW ESTABLISHED FOR RETURN TO SUSTAINABLE PROFITABLE GROWTH
12DX Freight – Market Focus
OVERALL PARCELS WORTH OVER £12BN AND GROWING AT 10% P.A
DX’S ADDRESSABLE MARKET WORTH c. £2BN
1-Man 2-Man Logistics
• Market c. £600m • Market c. £400m • Large, diverse marketplace,
28%
estimated at c. £1bn
• DX share is c.20%* • DX share is c.5%*
• DX share is c.4%* 62%
• Majority B2B • B2C focus • B2C focus
10%
• Service is key • 50% of market is outsourced • Bespoke delivery service
• Local customer service focus • Consumer driving value-added • Focused on deliveries - not
services; ‘white-glove’, ‘wet-fit’ wider logistics solutions of 3PLs
• Freight profiling/commercial
pricing and ‘light-assembly’ • Cross-dock solution - not
• Expanding market warehousing
• Open book
13
*DX estimatesDX Freight – Moving Back Into Profit
• Improved performance, 65% reduction in losses in H1 2020, is
Revenue £m H1 2020 H1 2019
being driven by:
DX 1-Man 56.5 47.8
- strong commercial disciplines
DX Logistics 20.6 22.9
- new business wins
DX 2-Man 9.8 7.3
- improved customer service Total revenue 86.9 78.0
- cessation of low-margin Logistics contracts EBITDA (IAS 17) £(1.9)m £(5.5)m
• Improved productivity from:
- introduction of basic sorting mechanisation
Source: DX, finnCap
- improved productivity from delivery fleet
15 250
- regional hubs improved efficiency of sortation process
10
200
Revenue (£m)
•
EBITDA (£m)
Planned expansion of depot network expansion with new site 5
0 150
opened in January at Ipswich; further sites planned in Burnley
-5 100
and Dewsbury -10 - Payment terms
50
• Division is expected to deliver positive EBITDA in H2 2020 and -15 - Zonal charges
- Cubing charges
-20 0
to achieve breakeven EBITDA in FY 2020 2017 2018 2019 2020E 2021E 2022E
EBITDA Revenue
2020 - 2022 are finnCap estimates
14DX Express – Repositioning for Growth
• Overall revenue growth with expansion of Secure and Courier
services
• A major focus is on DX Exchange service, which historically has
been in decline:
- attrition rate slowed to 6% in H1 2020 (H1 2019: 8%) by addressing
service levels
- now focusing on cross-selling/up-selling opportunities to blue-chip
customer base
- additional sales resources deployed and progress expected Revenue £m H1 2020 H1 2019
DX Courier 33.2 30.1
• Key growth initiatives: DX Secure 24.8 23.3
- restructured sales and commercial teams DX Exchange 23.6 23.9
- roll-out of ‘Estimated Time of Arrival’ by end April 2020; catalyst for DX Mail 1.6 1.7
further growth
Total revenue 83.2 79.0
- reshaping courier fleet towards larger vehicles
EBITDA (IAS 17) £10.9m £11.6m
- replacing and streamlining legacy IT systems
- moving to new premises in Glasgow and Ipswich
15DX Express – Building Blocks in Place
£6bn+ market for smaller parcels; significant market opportunity
• B2B – cross-selling to DX Exchange customers
DX Courier • Competitive market place
• Build on strong market positions in optical and pharma
Growing market share sectors
• Focus on SMEs and high street independents
DX Secure • Tracking and security; quality B2C service
• Fully security-vetted supply chain
Unlocking growth • Close, local relationship with customers
• New ETA service is unlocking growth
• Unrivalled membership network – document service
DX Exchange for legal, governmental and financial professions
• Opportunity to cross sell Courier and Secure services
Broadening our offering to existing blue-chip customer base
DX Secure • Aim to slow/stem revenue decline
Our aim is to provide a high level of customer service with clear and reliable consumer
experience with a local point of contact
16Summary
Ron Series
Executive Chairman
17Investment Programme
DRIVING FURTHER OPERATIONAL IMPROVEMENTS THROUGHOUT THE BUSINESS
£10m of investment over FY 2020 and FY 2021; £2.2m invested in H1 2020
Sites & Operations - c.£7.5m
IT systems - c.£2.5m (£2.5m invested in FY 2019)
(£1.0m invested in FY 2019)
Long-term roadmap established • New depots where under-
represented
Software development team expanded
• Mechanisation
Systems improved/functionality gaps
‘Heavy Lifting’ Complete closed • Equipment, including hand-held
scanners
- customer & business facing
Group reshaped
- DX Freight (initial focus)
Disciplined, commercial
approach to new business ‘Business First, Technology Second’
culture
Service levels improved
• Legacy systems retirement
People engaged & incentivised
• Driving competitive advantage and
operational efficiency through
technology
Underpins sustainable
EBITDA growth and
cash generation
18Investment Case
Revenue (£m)
• Experienced leadership team with a clear growth plan 175
170
170 166
− strength in depth, experienced senior management 165
160 157
team 155 153
150 147
• Group has been fundamentally restructured/reorganised 145
140
− cultural change; authority and responsibility devolved 135
H1 18 H2 18 H1 19 H2 19 H1 20
to local management, who are incentivised
− stronger commercial processes
Adj. EBITDA (£m)
− operational and productivity improvements 8
5.8
6
− investment programme underway
4
• Financial performance is significantly improved 2
0.1
0
− return to pre-tax profit expected in current financial
-2
-0.5
year -4 -2.5
-6 -4.4
H1 18 H2 18 H1 19 H2 19 H1 20
19Summary and Outlook
FIRM FOUNDATION ESTABLISHED FOR THE NEXT STAGE OF TRANSFORMATION
• Significant improvement in performance over same period last
year
• Positive momentum for next stage of transformation; targeting
profitable growth
• H2 is seasonally stronger than H1
• £10m capital investment programme in FY 2020 and 2021 will
support ongoing growth
• DX remains on track to return to pre-tax profit in FY 2020
• Some softening in volumes is expected in H2 relating to
coronavirus outbreak and effect on customer supply chains
20Appendices - Financials - Board of Directors - Major Shareholders
Statutory Income Statement

                                            Period to      Period to      Period to    Year ended
                                         28 Dec 2019    28 Dec 2019    31 Dec 2018    30 Jun 2018
     £m                                       IFRS16          IAS17          IAS17           IAS17
     Revenue                                   170.1          170.1          157.0          322.5
     EBITDA                                     10.4            0.1           (2.5)           3.3
     Depreciation and amortisation             (10.1)          (1.2)          (2.0)          (3.4)
     Share-based payments charge                (0.6)          (0.6)          (0.6)          (1.2)
     Results from operating activities          (0.3)          (1.7)          (5.1)          (1.3)
     Finance costs                              (2.1)          (0.2)          (0.2)          (0.4)
     Loss before tax                            (2.4)          (1.9)          (5.3)          (1.7)
     Tax                                        (0.3)          (0.3)          (0.3)          (0.8)
     Loss for the period                        (2.7)          (2.2)          (5.6)          (2.5)

22
Statutory Statement of Cash Flows
Period to Period to Period to Year ended
28 Dec 2019 28 Dec 2019 31 Dec 2018 30 Jun 2018
£m IFRS16 IAS17 IAS17 IAS17
EBITDA 10.4 0.1 (2.5) 3.3
Net change in working capital (4.7) (4.6) 0.4 (0.2)
Cash generated from/(used in) operations 5.7 (4.5) (2.1) 3.1
Interest paid (2.0) (0.2) (0.1) (0.4)
Net tax (paid)/received (0.2) (0.2) 0.8 0.5
Net cash generated from/(used in) operating activities 3.5 (4.9) (1.4) 3.2
Capital expenditure (2.2) (2.2) (1.0) (3.4)
Net increase/(decrease) in cash before financing 1.3 (7.1) (2.4) (0.2)
activities
Movement on IDF facility 6.5 6.5 4.6 -
Lease repayments (8.4) - - -
Net (decrease)/increase in cash and cash equivalents (0.6) (0.6) 2.2 (0.2)
Opening cash and cash equivalents 1.8 1.8 2.0 2.0
Closing cash and cash equivalents 1.2 1.2 4.2 1.8
23The DX Board
RON SERIES • Appointed Executive Chairman in October 2017
Executive Chairman • Highly experienced in business turnaround situations
• Previously Chairman of Tuffnells Parcel Express (2002-05) during its successful turnaround
• Chairman of Braemar Shipping Services plc
LLOYD DUNN • Appointed as CEO in October 2017
Chief Executive • Over 38 years’ experience in express freight and parcels industry
• Led successful turnaround of Tuffnells Parcel Express prior to its sale
• Co-founded Nightfreight Plc, a logistics company (listed in 1994, acquired by private equity and
subsequently by DX in 2012)
DAVID MULLIGAN • Appointed CFO in April 2018
CFO • Over 20 years’ experience in senior financial roles
• Previously CFO at Hornby plc, involved in its restructuring and turnaround
• Before that, CFO of Morgan Sindall Group plc for nine years until 2013, having joined in 1997
RUSSELL BLACK • Joined as NED in October 2017
NED • Over 40 years experience in transport, founder and CEO of Nightfreight from 1984 to 2002
• Joined as NED in October 2017
PAUL GOODSON • Previously executive chairman of Great Bear distribution, and spent 13 years with Barclays
NED Private Equity
• Joined as NED in July 2017
IAN GRAY • Has spent the past 30 years advising on business transformation and strategy development
NED • NED at Clancy Group Ltd
24Major Shareholders
Number of Shares Percentage Held
Gatemore Capital 204,378,538 35.63%
Management LLP
Hargreave Hale Limited 108,816,900 18.97%
Lloyd Dunn 61,432,081 10.71%
Ruffer LLP 29,999,900 5.23%
River and Mercantile 22,941,832 4.00%
Total number of ordinary shares in issue as of 20 September 2019: 573,681,792
Number of shares held in treasury: none
As of 20 September 2019, 66.89% of the Company’s issued share capital was not in public hands
25You can also read


