LOGISTICS choose between the four colors FERRY ROUTES - DFDS Group Overview
←
→
Page content transcription
If your browser does not render page correctly, please read the page content below
FERRY ROUTES
& LOGISTICS
DFDS Group Overview

June 2018
WHAT WE DO

                 .

2
2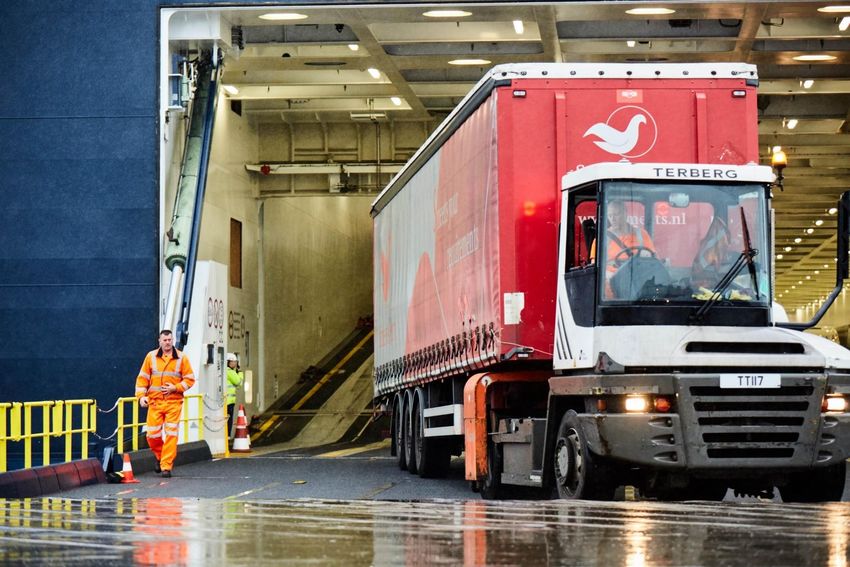
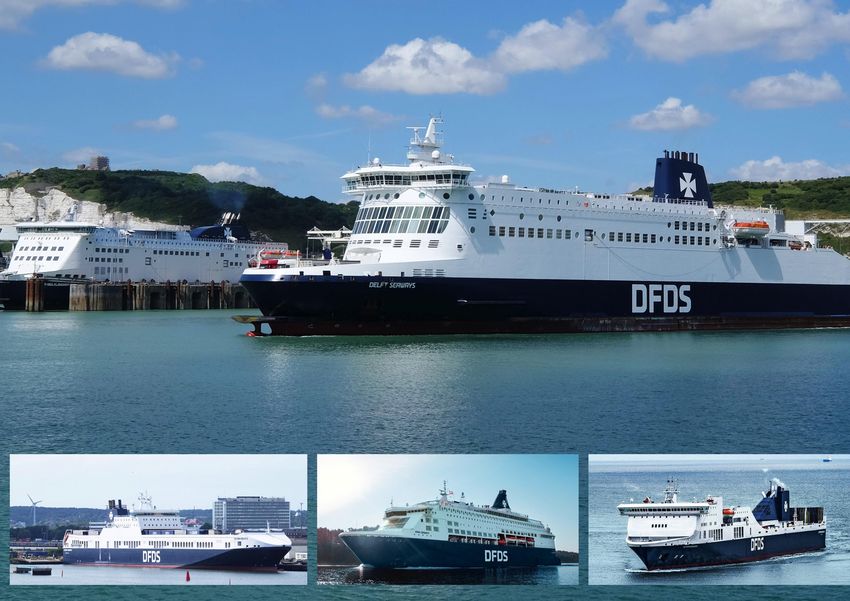
We move freight
    and passengers
    on ferry routes
    in Europe

3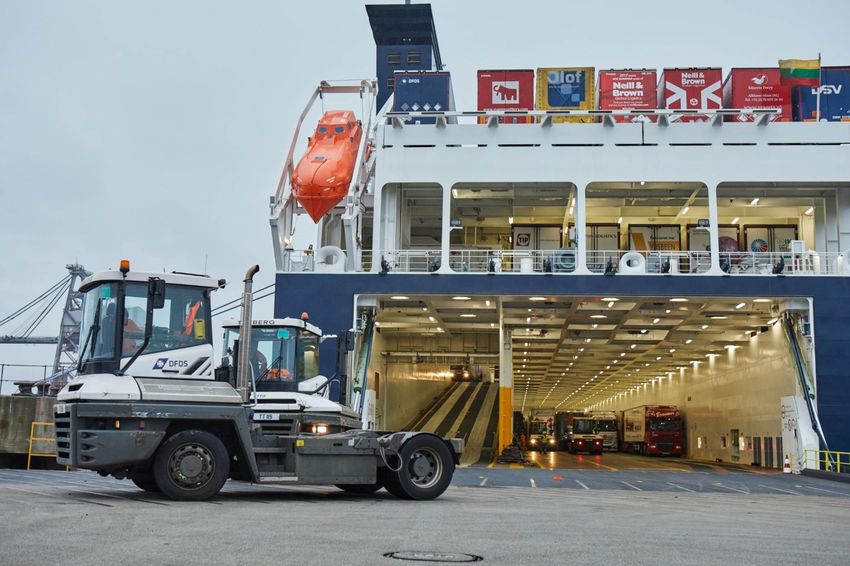
We also provide
    transport and
    logistics solutions
    to a wide range of
    businesses

4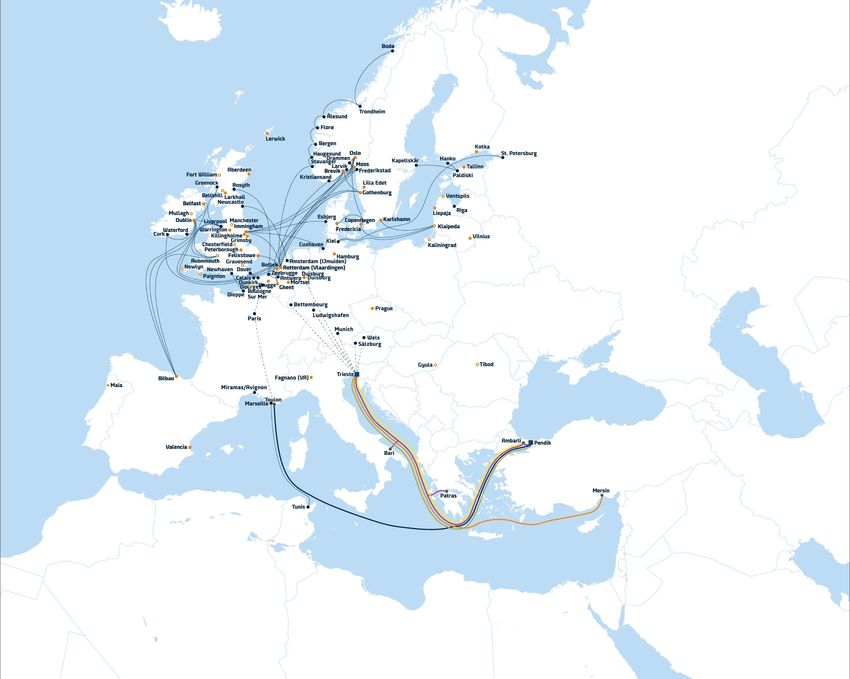
Route network
now  expanded
We also  provideto
Mediterranean
transport and
logistics solutions
to a wide range of
businesses

5
DFDS structure, ownership and earnings split

                                          DFDS Group                                    DKK bn   Revenue 2017 per division
                                                                                        16

                People & Ships                                             Finance      14

                                                                                        12

                                                                                        10        9.8
    Shipping Division                                     Logistics Division             8
                                                                                                                             Shipping Division
                                                                                                                             Logistics Division
                                                                                         6
                                                                                                                             Eliminations and other
    • Ferry services freight                              • Door-door transport          4

      and passengers                                      • Contract logistics           2        5.1
    • Port terminals                                      • 5,600 trailers and           0

    • 45 ferries operated*                                  3,500 containers             -2

                                                                                                 EBITDA 2017 per division
                                                                                        DKK bn

    DFDS facts                                            Shareholder structure         3.0

                                                                                        2.5

    • Founded in 1866                                     •   Lauritzen: 42%            2.0

    • Activities in 20                                    •   Free float: 54%           1.5       2.5        25.4% margin
                                                                                                                               Shipping Division

      European countries                                  •   Nasdaq Copenhagen                                                Logistics Division
                                                                                        1.0
    • 7,000 employees                                     •   Foreign ownership                                                Non-allocated items

                                                                                        0.5
                                                              share: ~30%
                                                                                        0.0       0.3        5.1% margin

                                                                                        -0.5

6    *19 other vessels operated, including slot charter and vessel sharing agreements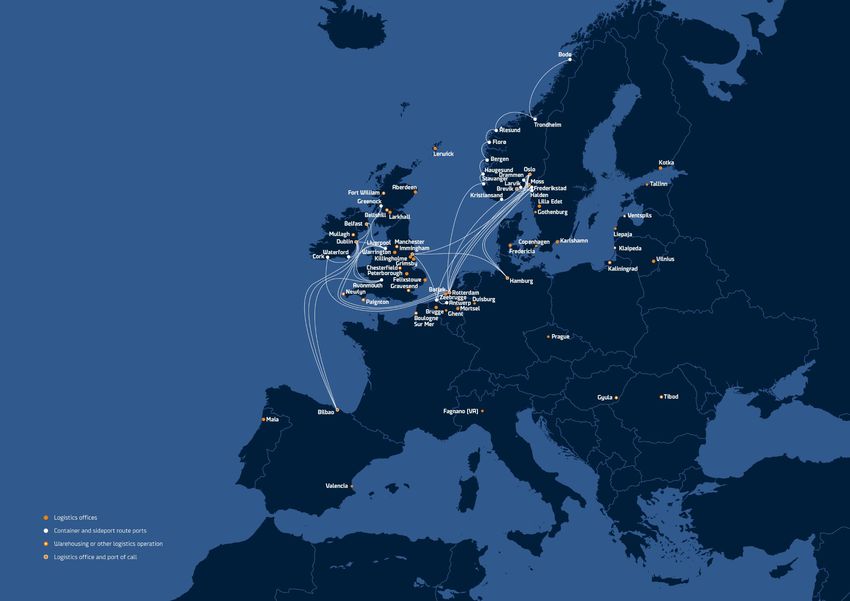
Freight, logistics & pax – northern Europe & Mediterranean

                    Freight routes               Logistics solutions       Passenger routes

               ▪ Trailers, unaccompanied   ▪ Door-door full &          ▪ Overnight
    Key          & accompanied               part loads
    services                                                           ▪ Day
               ▪ Industry solutions        ▪ Contract logistics
                                                                       ▪ Transport/holiday
               ▪ Port terminals
                                                                       ▪ Cruise ferry

                                       Freight

    Share of
    Group                         45%                                                    20%
    revenue

                                      80% freight                              20% pax

7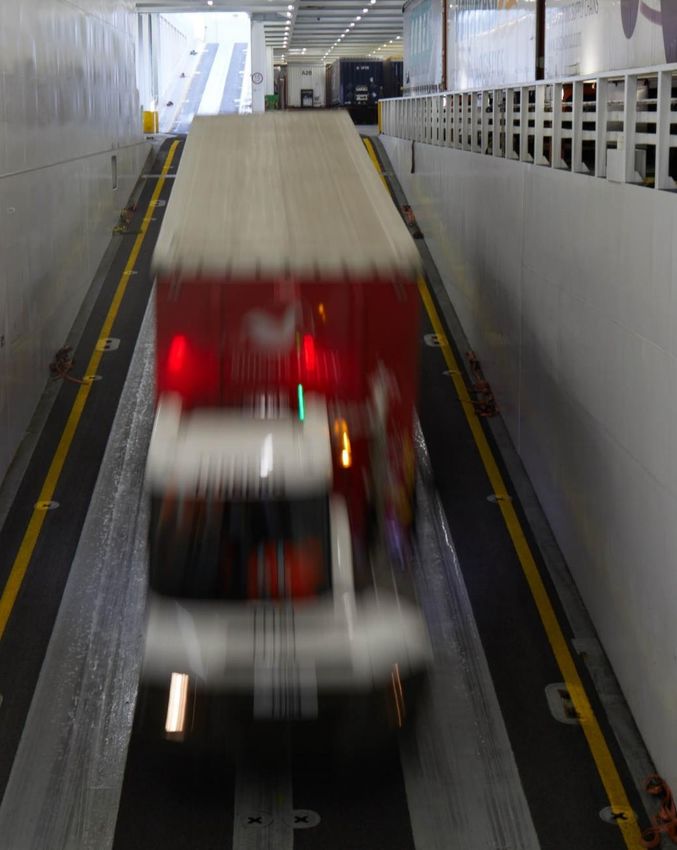
SHIPPING
                                                                    Q1 LTM 2018: Shipping Division

    Business units & ROIC, Q1 LTM 2018
                                                    Revenue                                          North Sea
                                                                                                     Baltic Sea
                                                                                                     Channel
    North   Baltic   Channel   Passenger   France                                                    Passenger
    Sea     Sea                            & Med       EBIT
                                                                                                     France & Med

    16%     31%      18%       24%         57%                0%   20%   40%    60%    80%   100%

                                                                                                     .

8
8
Roll on, roll off   • Ro-ro/ro-pax shipping: roll on, roll off of freight units
                      and passenger cars

                    • Routes carry both unaccompanied and accompanied trailers

                    • Other types of cargo, e.g. heavy industrial goods and containers, are
                      placed on carrying equipment (mafis) and tugged on to the ship

9
9
FERRY TYPES

                                                      Day ferry (ro-pax), Channel

        Freight ferry (ro-ro)   Cruise ferry   Combined freight and passenger ferry (ro-pax)
North Sea
• Only freight ferry routes (ro-ro)
• High share of industrial customers
Sweden-UK/Continent
• Forwarders main customer group
UK-Continent
North Sea Invested
DKK m Revenue EBIT capital ROIC, %
Q1 LTM 2018 3,740 675 4,109 16.0
Q1 LTM 2017 3,479 538 4,199 12.6
Lane metres, '000 ∆ vs LY Pax, '000 ∆ vs LY
Q1 LTM 2018 12,880 7.0% n.a. n.a.
11
11 Q1 LTM 2017 12,041Baltic Sea
• Freight ferry (ro-ro) and combined freight and passenger ferry routes (ro-pax)
• Forwarders main freight customer group
• Russia to a large degree ‘closed for business’ by sanctions
Baltic Sea Invested
DKK m Revenue EBIT capital ROIC, %
Q1 LTM 2018 1,467 376 1,191 31.5
Q1 LTM 2017 1,391 359 1,251 28.6
Lane metres, '000 ∆ vs LY Pax, '000 ∆ vs LY
Q1 LTM 2018 4,543 7.4% 251 20.2%
12
12
Q1 LTM 2017 4,229 209Channel
• Combined freight and passenger ferry routes (ro-pax)
• Forwarders main freight customer group
• Seasonal passenger market, Q3 high season
Channel Invested
DKK m Revenue EBIT capital ROIC, %
Q1 LTM 2018 2,351 369 2,040 18.0
Q1 LTM 2017 2,317 385 2,127 18.0
Lane metres, '000 ∆ vs LY Pax, '000 ∆ vs LY
Q1 LTM 2018 19,160 -6.4% 3,864 14.2%
Q1 LTM 2017 20,475 3,383
13
13Passenger
• Cruise ferry routes, overnight crossings
• Seasonal passenger market, Q3 high season
• Increasing share of overseas passengers
• Also carries freight
Passenger Invested
DKK m Revenue EBIT capital ROIC, %
Q1 LTM 2018 1,700 162 666 23.8
Q1 LTM 2017 1,699 255 581 42.9
Lane metres, '000 ∆ vs LY Pax, '000 ∆ vs LY
Q1 LTM 2018 578 -9.6% 1,373 5.2%
14
14
Q1 LTM 2017 640 1,305France & Mediterranean
• Newhaven-Dieppe:
combined freight and France & Med Invested
passenger ferry DKK m Revenue EBIT capital ROIC, %
concession route Q1 LTM 2018 483 24 42 57.5
• Marseille-Tunis: Q1 LTM 2017 481 9 -1 n.a.
freight ferry route Lane metres, '000 ∆ vs LY Pax, '000 ∆ vs LY
• Forwarders main
Q1 LTM 2018 934 -7.5% 341 -1.4%
freight customer group
Q1 LTM 2017 1,010 346
15
15IT’S ALL
ABOUT THE
ROUTE
.
16
16FERRY ROUTE CAPACITY DYNAMICS
- stepwise addition of ferries on a route leverages capacity significantly
Minimum required
No. of ships Capacity impact
Route no. of ships for
on route today of entry*
entry
Dover-Calais 8 3 38%
Gothenburg-Immingham 3 2 67%
Fredericia- Copenhagen-
1 1 100%
Klaipeda ddddd
* Assuming entered ships are identical to incumbent ships and same no. of departures per ship
Freight Infrastructure
Ferry route
Port Port
terminal Bridge terminal
• Logistics office/warehouse
Road Road
― Container/sideport
Railroute Rail
Tunnel
17
17KEY NORTHERN EUROPEAN FERRY COMPANIES • Logistics office/warehouse ― Container/sideport route 18 18
GDP growth of 2.0% expected for EU, 1.5% expected for UK

• EU’s growth scenario
                                           UK-EU trade in goods - y/y Q-growth in volume indices
  expected to mitigate                                      (ex. oil and erratics)
  uncertainty from Brexit        10%

• UK export growth to EU         8%

  continues, import growth
  reduced by lower car imports   6%

  in Q4 2017
                                 4%
                                                 Brexit vote
• Current EU-UK trading model
                                 2%
  in place until Dec 2020
                                 0%
• Volume growth divergence
  between North Sea and          -2%
  Channel likely to narrow but
  continue in 2018               -4%
                                       2016 Q1   Q2       Q3   Q4         2017 Q1     Q2   Q3   Q4   2018 Q1
                                                                Exports         Imports

19
       19
Freight ferry capacity (ro-ro) – total down, large ships growing
Global freight ferry (ro-ro) capacity per ship size, lane
• Freight ferry (ro-ro) capacity expected to LM '000 metres
decrease 2% in 2017 driven by smaller 1,000
CAGR: -2.4%
ships 800
600 2501-4000+
• CAGR of -2.4% in global LM capacity CAGR: +5.1%
500-2500
since 2009 due to: 400
• Consolidation of volumes around hubs
200 CAGR: -6.9%
• Increased utilization on large ships
• Large ships with lower unit costs replace 0
2009 2010 2011 2012 2013 2014 2015 2016 2017
smaller ships
• Ongoing scrapping of older and smaller Global no. of freight ferries (ro-ro) per ship size
ships No. of ships
500
CAGR: -5.1%
• Number of ships likewise declining as is 400
CAGR: +4.6%
availability of ferries for potential 300 2501-4000+
‘speculative’ entrants 200 500-2500
100 CAGR: -7.6%
• Order book consists primarily of orders 0
2009 2010 2011 2012 2013 2014 2015 2016 2017
from Cobelfret and DFDS
20
20Ferry capacity (ro-pax) – stable, large ships growing
Global ro-pax capacity per ship size, lane metres
• Ferry (ro-pax) capacity expected to LM '000
remain flat in 2017 as increase in 600 CAGR: -0.2%
capacity of large ships is balanced by 500
CAGR: +4.6%
decrease for smaller ships 400
2501-4000+
300
1000-2500
• CAGR of -0.8% in global LM capacity 200 CAGR: -1.8%
since 2009 due to: 100
• Same drivers as for freight ferries…
0
• …mitigated by a positive impact from ro- 2009 2015 2016 2017
pax ferries with large freight capacity
replacing traditional ferries aimed at Global no. of ferries (ro-pax) per ship size
No. of ships
passenger market 300 CAGR: -0.8%
250
CAGR: +4.8%
• Decline in number of ships exceeds 200
capacity decline due to growth of large 150 2501-4000+
ships 100
CAGR: -1.9% 1000-2500
50
• Order book consists primarily of orders 0
from Stena Line 2009 2015 2016 2017
21
21Orders for own routes set to maintain stable ferry market
• Trend towards larger ships set to Shipping Division: Fleet overview 2016
continue as ferry operators order ships Average
age of
for own route networks Ro-pax Passenger Ownership owned
Total ships Ro-ro ships ships ships share, % ships, yrs
• New build prices at low point Shipping Division 41 23 14 4 - -
North Sea 19 19 - - 68 12
Baltic Sea1 9 2 7 - 67 15
• DFDS requirements for 2018-2022 for Channel 6 - 6 - 67 14
Passenger 4 - - 4 100 27
ongoing renewal, efficiency and capacity France & Med1 3 2 1 - 33 20
growth to accommodate demand: 1
Includes VSAs (vessel sharing agreements) and SCAs (slot charter agreements)
• North Sea: 4 ro-ros
• Baltic Sea: 2 ro-paxes Dry-cargo1 newbuilding price index
Index
• Channel: 1 day ferry ro-pax 225
• Passenger: decision on 4 ships for either
200
further life extension or purchase and
175
rebuild of secondhand ships (new builds a
possibility beyond 2022) 150
125
• Financing of freight ferries and ro-paxes
can be ownership or BB-charter 100
'88 '90 '92 '94 '96 '98 '00 '02 '04 '06 '08 '10 '12 '14 '16
22
22 Source: Clarksons Platou
1 Dry cargo includes containerships, multi purpose vessels, ro-ro and pure car carriersLOGISTICS
Q1 LTM 2018 Logistics Division
Business units & ROIC, Q1 LTM 2018
Revenue
Nordic
Continent
Nordic Continent UK & Ireland EBIT UK & Ireland
21% 15% 8%
0% 50% 100%
.
23
23Logistics Division: Growing share of contract logistics
Activity Nordic Continent UK & Ireland
Door-door full & part • Scandinavia- • Continent- • Northern Ireland-UK
loads (trailers, UK/Baltics/Continent Scandinavia/ • Ireland/UK-Spain
containers & rail) UK/Ireland • UK domestic
Contract logistics • Automotive, • Automotive, Germany- • Temperature
Gothenburg UK, Belgium controlled, Scotland,
England
• Retail, Northern
Ireland
Paper shipping logistics • Norway-Continent/UK
24Logistics Division is a key customer of the route network
• Top 3 customer
of Shipping
Division NORDIC
• 8% of total
shipping volumes
UK &
• 10-20% volume
IRELAND
target on
individual routes
CONTINENT Logistics
Division
DKK m Revenue
Invested
EBIT capital ROIC, %
Nordic
Q1 LTM 2018 1,986 79 367 21.3
Q1 LTM 2017 1,631 49 317 15.2
Continent
Q1 LTM 2018 2,182 74 382 15.5
Q1 LTM 2017 1,947 47 344 10.8
UK & Ireland
Q1 LTM 2018 1,303 35 405 7.5
Q1 LTM 2017 1,500 61 420 12.3
25
25
LTM as per Q3 2014HOW WE RUN
DFDS
.
26
263 key strategic demands and supporting initiatives
1. Top line focus 2. Increase 3. Acquisitions
efficiency and and investments
reduce cost base for future
growth
Continuous improvement projects M&A
IT systems development Fleet strategy
Digital
DFDS WAY 2.0
27Continuous improvement projects to increase efficiency • Pricing & yield: improve revenue growth through enhanced capacity utilisation on both freight and passenger routes • Starlight: improve on board experience and performance of the two cruise ferry routes • Carpe Momentum: completion of project to improve on board sales and spend per passenger on Channel routes • Italy profit improvement project, Logistics - COMPLETED 28
3 key strategic demands

                                                  3. Acquisitions
 1. Top line focus             2. Increase
                                                  and investments
                               efficiency and
                                                  for future
                               reduce cost base
                                                  growth

        Continuous improvement projects                 M&A

            IT systems development                    Fleet strategy

                     Digital

                                 DFDS WAY 2.0

29
Our digital vision
A best-in-industry
digital
customer experience
generating tangible business benefits
for customers and DFDS
Support businesses to gain deep
insights into customers’
needs to catalyse business
change for sustained relevance
30Digital capabilities, new business models & technologies
• New digital and IT operating model
launched in 2017
• Time-to-market and scalability being
improved through architectural
changes
• Unified digital customer experience
platform to launch in Q2 2018
• User-experience, innovation and smart
data teams expanded
• Increasing assessment and
experimentation with new business
models and technologies
• Additional digital/IT cost of DKK 100m
expected in 2018 vs 2017
31Creating value from operational and strategic synergies
• Focus on both transformational and Revenue
bolt-on acquisitions 2017, Routes Regions Major activity
DKK bn
Across Northern Europe, Mediterranean
DFDS 14 27 9
(incl. sideport/container)
• Ferry routes: Stena Line 10 23 6 Across Northern Europe
• Expand European network P&O Ferries 8 8 3 UK-Continent
• Overlapping operations Tallink 7 6 1 Baltic Sea North
• Tonnage flexibility Cobelfret 4 7 4 Benelux-UK, Sweden-Belgium
Color Line 4 4 1 Norway-DK/Germany
• Leverage operating model Viking Line 4 3 1 Baltic Sea North
Finnlines 4 8 7 Finland-Continent/UK, Baltic Sea South
Scandlines 4 2 1 Denmark-Germany
• Transport & logistics: Brittany Ferries 3 7 3 UK-France/Spain
• Expand and connect European network ICG 2 4 1 Ireland-UK/Continent
Transfennica n.a. 3 6 Finland-Continent/UK
• Increased value-added services
Eckerö 2 3 1 Baltic Sea North
• Leverage operating model Seatruck n.a. 3 1 Ireland-UK
TT-Line 1 2 1 Sweden-Germany/Poland
Polferries n.a. 2 1 Poland-Sweden
• Transactions 2016-18: Unity Line n.a. 2 1 Poland-Sweden
• Hanko-Paldiski route
• Shetland Transport
• Italcargo
• Alphatrans
• U.N. Ro-Ro
32
32HOW WE
PERFORM
.
33
33EBITDA increased to DKK 2.7bn – ROIC now at 19%
DKK bn Revenue Inv cap, DKK bn Invested capital & ROIC before special items ROIC, %
15 10 20
9 18
12 8 16
7 14
9
6 12
5 10
6
4 8
3 6
3
2 4
0 1 2
2013 2014 2015 2016 2017 0 0
2013 2014 2015 2016 2017
Shipping Division Logistics Division
DKK bn
EBITDA & margin before special items Margin, % NIBD/EBITDA Operating cash flow & NIBD/EBITDA DKK bn
3.0 20 2.0 3.0
1.8
18 2.5
2.5 1.6
16 1.4
2.0 2.0
1.2
14
1.5 1.0 1.5
12 0.8
1.0 1.0
10 0.6
0.4
0.5 0.5
8
0.2
0.0 6 0.0 0.0
2013 2014 2015 2016 2017 2013 2014 2015 2016 2017
34ROIC Drive – activity by activity performance benchmark
• Around 90 profit-generating
activities covered by programme
• Simple ROIC scorecard makes
programme accessible for activity Activities performing
managers above 10%
• 3-year high-level rolling business
plans, review meetings with top
management 10% ROIC Activities performing
around 10%
• Internal performance ranking and
benchmarking
• Threshold rate of 10% for Activities performing
investments, including acquisitions below 10%
Key focus areas for ROIC meetings,
business plans, benchmarking
and structural solutions
35
35Steady ROIC improvement
DFDS Group: Return on invested capital (LTM)
%
• Major challenges resolved:
20 19.0
• Gothenburg-Immingham 18.1
19.3
17.8
18
• Russian market sanctions 18.1
17.4 17.6
• Channel turnaround 16 16.4
15.3
• Closure of 3 routes end 2014 14
13.7
• Successful transition to new
Sulphur rules 12 12.6
10
10.3
• Continuous improvement 09
projects, > 3 every year 8 08
7.9
7.1
6
• ROIC Drive programme 5.8
5.8
4.5 4.7
4
4.5 4.4
• Tailwind from moderate pick- 2
up in EU growth since 2011 Q4
12
Q1
13
Q2
13
Q3
13
Q4
13
Q1
14
Q2
14
Q3
14
Q4
14
Q1
15
Q2
15
Q3
15
Q4
15
Q1
16
Q2
16
Q3
16
Q4
16
Q1
17
Q2
17
Q3
17
Q4
17
Q1
18
36
36Capital distribution
• Total distribution to shareholders was Capital distribution overview
DKK 1.7bn in 2017 equal to 9.2% yield on DKK m 2015 2016 2017
equity market value Actual Actual Actual
• The NIBD/EBITDA multiple was 0.9 at the Dividend per share, DKK 5.40 6.00 10.00
end of 2017, on level with 2016 Dividend, Mar 218 175 168
Dividend, Aug 108 174 387
2018 Total dividend* 326 349 555
• Dividend of DKK 4.00 paid in March Buyback, auction - 400 478
Buybacks, other 401 514 628
• Planned dividend in August suspended Total share buybacks 401 914 1,106
Total distribution 727 1,263 1,661
• Share buyback launched in February
Dividends exclude treasury shares
cancelled
• Board will reassess capital structure in
February 2019 and hence capital
distribution
37Cash generation and CAPEX
• Cash conversion of 99% in 2017
Cash flow and investments
DKK bn
• Cash flow boosted by Light Capital project
started in 2013 to reduce working capital 3.0
• Limited tax payments due to European 2.5
tonnage tax regime
2.0
• Investments expected to stay below operating
cash flow for next cycle of asset investments 1.5
• Planned major CAPEX: 1.0
• 2018, outlook of DKK 5.2bn:
• DKK 350m: dockings/ship upgrades 0.5
• DKK 200m: port terminals
• DKK 500m: new buildings 0.0
• DKK 150m: logistics equipment 2013 2014 2015 2016 2017
• DKK 100m: IT-systems and other
• DKK 3.7bn: U.N. Ro-Ro equity value
Operating cash flow after tax (FCFF) Investments
• DKK 200m: U.N. Ro-Ro lengthenings
• 2019: delivery of 2 freight new buildings
• 2020: delivery of 2 freight new buildings
38
38delivery of 2 ro-pax new buildings
• 2021:KEY FOCUS
AREAS
2018
.
39Key growth and efficiency events shaping 2018 & beyond
Growth from • Special Cargo: operator of flatbed trailers in Europe,
acquisitions consolidated 3 January 2018
• U.N. Ro-Ro: freight ferry routes connecting Europe and Turkey,
closing expected June 2018
• Currently planning for integration
• Integration to start immediately after closing
• Financial flexibility maintained to pursue further opportunities
Growth from ferry new • 4 freight ferries (ro-ro), from early 2019
building orders • 2 combined freight and passenger ferries (ro-pax), from 2021
• 1 Channel ferry, 10-year bareboat charter, from 2021
• Further options available
Operational efficiency • Italian logistics activities restructured
• Boost projects for challenged logistics activities
• Corporate functions restructured
• Rosyth-Zeebrugge route closed
• Starlight: On board customer service and revenue project
Digital • Ongoing investment in digital customer solutions
• Realise long-term digital strategy
40EBITDA outlook for 2018 of DKK 3,000-3,200m
• European GDP growth still expected to be
around 2% in 2018 OUTLOOK 2018 – including
U.N. Ro-Ro
• Growth projections for UK economy of
around 1.5% • Revenue growth of around 10%
• Revenue growth outlook raised to 4% excl. • EBITDA range of
U.N. Ro-Ro and to 10% incl. U.N. Ro-Ro DKK 3,000-3,200m
• EBITDA range of DKK 2,650-2,850m excl. • Shipping Division: DKK 2,825-2,975m
U.N. Ro-Ro changed to DKK 3,000-3,200m • Logistics Division: DKK 275-325m
incl. U.N. Ro-Ro
• Non-allocated items: DKK -100m
• Development of digital and IT capabilities
• Investments of DKK 5.2bn
progressing as planned
• Investments forecast at DKK 5.2bn incl. U.N.
Ro-Ro’s equity value of DKK 3.7bn and
lengthening of two U.N. Ro-Ro freight ferries
41Priorities 2018 • Integrate U.N. Ro-Ro • Realise our next steps in digital strategy • Customer satisfaction – grow the topline • Continue push for efficiency improvements • Improve performance of Passenger business unit • Pursue new logistics contracts • Preparing for delivery beginning 2019 of two freight new buildings (ro-ro) • Succeed with value-creating M&A 42
Q&A

       .

43
APPENDICES
.
44
44DFDS fleet overview and key figures 2017
Average age
Passenger Container and Ownership of owned
Total ships Ro-ro ships Ro-pax ships ships sideport ships share, % ships, yrs
DFDS Group 64 22 18 4 20 - -
Shipping Division 40 22 14 4 - - -
North Sea 18 18 - - - 72 13
Baltic Sea1 9 2 7 - - 67 16
Channel 6 - 6 - - 100 15
Passenger 4 - - 4 - 100 28
France & Mediterranean1 3 2 1 - - 33 17
Logistics Division1 20 - - - 20 - -
Nordic1 6 - - - 6 33 19
Continent1 14 - - - 14 0 -
Chartered out ships 3 - 3 - - 100 23
Laid-up ships 1 - 1 - - 0 -
1 Includes VSAs (vessel sharing agreements) and SCAs (slot charter agreements)
45
45Diverse customer base: forwarders, manufacturers &
passengers
Passengers
21%
Forwarders
36%
Port terminal customers
3%
PAX
SOLUTIONS External charterers
3%
Manufacturers
(shipping)
5%
TRAILER
SHIPPING
Manufacturers
(transport & logistics)
32%
Percent of total revenue per customer
segment
46
46DFDS’ freight business model integrates routes and logistics
• DFDS’ logistics activities Manufacturers
have a narrow scope of
full/part load solutions Heavy Other Consumer
industrial goods industrial goods goods
• Own logistics provides
access to market
intelligence and ability to
DFDS Freight forwarders
allot volumes between
own and external routes
Shipping Full/part load Global providers: DHL, DSV, K&N,
for capacity optimisation logistics solutions Schenker, etc.
solutions for focused on own
• Around 20% of routes’ heavy goods, route network Regional providers: NTEX, Ewals,
primarily out of corridors LKW Walther, Vlantana
freight revenue from own
Scandinavia
shipping logistics and
full/part load solutions
DFDS ferry route infrastructure
France &
Baltic Sea North Sea N North Sea S Channel
Med
47You can also read