Nordhealth H1 2021 Half-year Report - Cision
←
→
Page content transcription
If your browser does not render page correctly, please read the page content below
Nordhealth H1 2021 Half-year Report
2

Vision: Redefine digital healthcare

Mission:

Empowering healthcare professionals to save time so they can focus on what matters most—delivering
great care, providing great experiences, and growing their business.

Values:

Put customers first
Never overlook what really matters. Great service, ease of use, honest pricing, and respect for our
customer’s time, money and trust.

Take ownership
Think long-term and take initiative. Care about the outcome. Be accountable. Do the right thing for us, our
customers, and the team.

Do more with less
Simplicity is the key to great results. Create fewer features, but make them great instead of just good.
Dare to say “no” to prevent the core from being lost in the noise.

Be stronger together
Engage beginners and attract experts to grow excellent teams. This isn’t something we do on our own –
it’s all about sharing and exchanging ideas.

Embrace change
Challenge the status quo. Seek out and embrace continuous change, evolution and improvement.

Products:
   -   Electronic Health Record Software (EHR)
   -   Practice Management Software (PMS)
   -   Payments
   -   Integrations & API

Current target healthcare niches:
   -   Veterinary:
            o   Small animal
            o   Equine
            o   Farm animal
   -   Therapy
            o   Physiotherapy
            o   Psychotherapy
            o   Occupational therapy
            o   Speech therapy
3
First Half-year Highlights
Initial Public Offering
Nordhealth raised 120 M€ in funding to continue improving Nordhealth’s digital products, to provide better
support for our customers, and to accelerate our international expansion.
The funding raised through the listing of Nordhealth on Euronext Growth Oslo will be used to improve four
key areas:
1. Recruit and retain great talent.
2. Improve our products by becoming a more user-centric organisation.
3. Invest in our local implementation and support teams to ensure we deliver great experiences at
every touchpoint.
4. Acquire other software to accelerate our entry to new geographies or to grow our portfolio of
add-on products.
Aspit Acquisition
On the 2nd of June 2021, Nordhealth announced an agreement to acquire 100% of the shares outstanding in
Aspit AS, to strengthen the market position and product offering in Norway.
Aspit AS is a leading supplier of electronic patient record systems (EHR) and IT operations to the
healthcare sector in Norway. More than 6 000 therapists use Aspit’s cloud-based Software as a Service
(“SaaS”) products. Aspit's EHR systems have established a leading position within the psychotherapy
market with the product Psykbase, and the physiotherapy/chiropractor markets with the product Physica.
In 2018, the company was granted a five-year national licensing contract with the Directorate for e-Health
in Norway, which led to the launch of new solutions such as Envision and Capture, that allow clinicians to
send and receive medical images, video and documents. Aspit also provides IT-operational services to
several municipalities in Norway. Aspit is headquartered in Seljord, Telemark, with offices in Oslo and
Arendal, and has 55 employees.4 CEO Update Our first half of 2021 was a transformative period for Nordhealth. 1. We raised 120 M€ in new capital to finance our future organic and acquisition-led growth 2. We expanded our therapy business to Norway with the acquisition of Aspit 3. We entered the Danish veterinary software market with the acquisition of Novasoft 4. We recruited great people to join our adventure We grew 124% in H1 2021 vs. H1 2020 through a combination of organic growth in our current markets, which accounted for 36% growth, and acquisitions. Our acquisitions enabled us to partner with wonderful new colleagues that are helping to accelerate our geographic expansion. Integration of the team and product unification plans have been progressing smoothly. Nordhealth has now completed 8 acquisitions to date. We are very happy that most employees and customers from acquired companies have found a safe, long-term home in Nordhealth. We thank them for their trust and look forward to working to improve our product and our services together. I especially wanted to take this opportunity to thank my teams at Nordhealth. Their passion and care for our customers is apparent in the dedication, open-mindedness, and hard work. Thank you, Charles MacBain CEO, Nordhealth
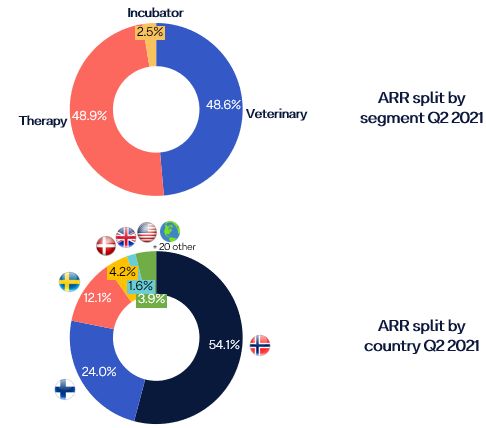
5

Financial review
General information
Nordhealth AS (the "Company" and, together with its consolidated subsidiaries, the "Group" or
"Nordhealth") is a Company registered in Norway and traded on the Euronext Growth Oslo. The
Company's registered business address is Eikremsvingen 9, 6422 Molde, Norway.

The condensed consolidated financial statements for the first half of 2021 were approved by the
Board of Directors for publication on September 28, 2021. The interim financial information is
unaudited.

The Accounting principles used in 2021 are according to Norwegian GAAP, while the financial
statements for 2020 were still reported according to Finnish Accounting Standards (FAS). The
Reporting currency is EUR. All numbers are presented in EUR millions, unless otherwise stated.

Results and ARR for the first half of 2021
The total ARR in the end of Q2 2021 amounted to 22.427 M€ compared to 10.008 M€ in the end of Q2
2020, resulting in a 124% growth. The group continued to execute its strategy in increasing ARR per
share via organic growth and acquisitions, constantly evaluating the most financially reasonable
strategy in each market. Acquired entities accounted for 8.835 M€ of the total ARR in the end of Q2
2021. The total organic ARR in the end of Q2 2021 amounted to 13.592 M€, leading to an organic ARR
growth of 36% compared to the end of Q2 2020. The organic net retention rate in the LTM was 118%
and the organic churn rate stood at 3%.
6

M&A
On 1 April 2021, the Company completed the acquisition of Novasoft A/S and its veterinary PMS
product Vetvision. The acquisition was a decisive step in the veterinary PMS market entry in Denmark.
Financials for the entity are included in the reports from the date of closing.

On 1 June 2021, Nordhealth completed the acquisition of Aspit AS to strengthen the market position
and product offering in Norway. Financials for the entity are included in the reports from the date of
closing.

Acquisition costs have been reported under other operating expenses in the Income statement.

PROFIT & LOSS

Revenue
The total revenue in the first half of 2021 amounted to 8.129 M€ compared to 5.767 M€ in the first half
of 2020, resulting in a 41% growth YTD. For the second quarter of 2021 alone, Nordhealth showed 66%
growth in reported revenues YoY. Of the total revenues 89% were recurring in the first half of the year.

The recurring revenues in the first half of 2021 amounted to 7.230 M€ compared to 4.868 M€ in the first
half of 2020, resulting in a 49% growth YTD. For the second quarter of 2021 alone, Nordhealth showed
67% growth in recurring revenues YoY. Of the total revenues 89% were recurring in the second quarter
of the year.

When adjusted for the consulting business divested in Q4 of 2020, the adjusted revenues grew by 52%
in the first half of 2021. For the second quarter of 2021 alone, Nordhealth showed 83% growth in
adjusted revenues YoY. In adjusted recurring revenues growth was 53% YTD and 73% in the second
quarter of 2021 YoY.

Organic and adjusted recurring revenues grew by 33% in H1/2021 compared to H1/2020. The excluded
Aspit and Novasoft entities amounted for 13% of total recurring revenues in the first half of 2021.

Pro-forma revenues amounted to 11.703 M€ in H1/2021 compared to 9.214 M€ in H1/2020, resulting in a
27% growth YoY. Pro-forma recurring revenues amounted to 10.721 M€ in H1/2021 compared to 8.170
M€ in H1/2020, showing 31% growth. The pro-forma figures include the acquired Aspit and Novasoft
entities for the full time periods. Note that reported recurring revenues are generally lagging behind
the signed ARR base.
7

Operating expenses
The total personnel costs in the first half of 2021 amounted to 45% vs revenues compared to 44% in
the first half of 2020. Note that personnel costs in the organic entities accounted for 50% vs revenues
in the first half of 2021 compared to 44% vs revenues in the first half of 2020. The increase highlights
the very active recruitment activities in line with the growth strategy.

Other operating charges in the first half of 2021 include 2.298 M€ non-recurring costs resulting mainly
from the IPO and M&A activities. When adjusted for these exceptional costs, the other operating
charges amounted to 16% vs total revenues. The other operating charges amounted to 20% vs total
revenues in the first half of 2020.

EBITDA
The reported EBITDA for the first half of 2021 includes 2.366 M€ non-recurring costs resulting mainly
from the IPO and M&A activities. When adjusting for these expenses the group reported an EBITDA of
1.935 (24 %) in the first half of 2021 compared to and EBITDA of 1.241 M€ (22 %) in the first half of 2020.

The pro-forma EBITDA, adjusted for the non-recurring costs amounted to 2.278 M€ (19 %) for the first
half of 2021 compared to a pro-forma EBITDA of 1.177 M€ (13 %) in the first half of 2020. The pro-forma
figures include the acquired Aspit and Novasoft entities for the full time periods.

Financial items
Interest and other financial expenses in the first half of 2021 stood at 0.459 M€ compared to 0.063 M€
in the first half of 2020. The increase is mainly related to foreign currency revaluations.

Non-recurring items
The reported EBITDA for the first half of 2021 includes 2.366 M€ non-recurring costs resulting mainly
from the IPO and M&A activities.
8

BALANCE SHEET

Total assets
Total non-current assets amounted to 47.326 M€ at the end of the first half of 2021 compared to 7.149
M€ at the end of 2020. The significant increase is driven by the increase in goodwill, resulting from the
Aspit and Novasoft acquisitions.

Intangible assets accounted for 3.057 M€ at the end of the first half of 2021 compared to 2.435 M€ at
the end of 2020. The intangible assets mainly represent capitalized product development cost.

Current assets amounted to 82.513 M€ at the end of the first half of 2021 compared to 5.749 M€ at the
end of 2020. The significant increase is driven mainly by the increase in cash resulting from the private
placement and subsequent listing to Euronext Growth Oslo. Cash at bank and in hand amounted to
76.383 M€ in the end of the first half of 2021 compared to 3.768 M€ at the end of 2020.

Equity
Total equity at the end of the first half of 2021 amounted to 116.792 M€ compared to 4.954 M€ at the
end of 2020. On 25 May 2021, the Company resolved to complete a private placement, consisting of a
share capital increase for a total amount of approximately NOK 1,224 million, by issuing 30,000,000
Shares with a par value of NOK 1 each at a subscription price of the NOK equivalent of EUR 4 per Share.
Costs of 3.472 M€ relating directly to the equity increase, were booked against the equity accounts by
the end of the first half of 2021.

Liabilities

Nordhealth repaid the vast majority of its interest-bearing loans to credit institutions in June 2021,
reducing liabilities to credit institutions by 1.721 M€ compared to the end of 2020. Total interest-
bearing liabilities amounted to 0.270 M€ by the end of the first half of 2021 compared to 1.991 M€ by
the end of 2020.
9

CASH FLOW

Cash flow from operating activities
Net cash flow from operating activities was 2.324 M€ in the first half of 2021. When adjusted for the
2.366 M€ non-recurring IPO and M&A costs included, the adjusted net cash flow from operating
activities was 4.690 M€.

Cash flow from investing activities
Net cash flow from investments in the first half of 2021 amounted to -41.580 M€, with acquisition
related payments accounting for -39.967 M€.

Cash flow from financing activities
Net cash flow from financing amounted to 111.870 M€ in the first half of 2021, with the equity increase
accounting for 117.233 M€. Repayment of interest-bearing debt amounted to -1.721 M€ in cash flow,
other debt items to 90 M€, and dividend payments to -3.731 M€. The dividend payment served mainly
for the repayment of interest-bearing holding company loans of the majority owner of Nordhealth AS.
The dividend payments were issued before the private placement and subsequent listing to Euronext
Growth Oslo.

Cash at end of the first half of the year amounted to 76.383 M€.
10

Income statement – Group consolidated
                                        Unaudited   Unaudited   Unaudited Audited
EUR in thousands                        Q2'21       H1'21       H1'20     FY20

Recurring revenue                       4 258       7 230       4 868     10 724
Other revenue                           527         899         899       1 960
Total revenues                          4 785       8 129       5 767     12 685
Other operating income                  4           20          66        312
Material and services                   (918)       (1 326)     (884)     (1 751)
Gross profit                            3 870       6 823       4 948     11 246

Personnel expenses                      (2 093)     (3 660)     (2 526)   (5 555)
Other operating charges                 (3 040)     (3 595)     (1 181)   (2 203)
EBITDA                                  (1 262)     (432)       1 241     3 487

Depreciation and amortization           (414)       (630)       (381)     (1 007)
Amortization of goodwill                (450)       (578)       (253)     (506)
EBIT                                    (2 125)     (1 639)     607       1 975

Other interest and financial income     39          50          60        279
Interest and other financial expenses   (313)       (459)       (63)      (252)
EBT                                     (2 400)     (2 048)     604       2 001

Taxes                                   396         396         (36)      (73)
Net profit (loss)                       (2 004)     (1 652)     568       1 928

Adjustments to EBITDA:                  2 366       2 366
Adjusted EBITDA                         1 104       1 935
Adjusted EBITDA-%                       23 %        24 %

Adjusted Net profit (loss)              363         714
11
Balance sheet
Unaudited Audited
EUR in thousands 30 Jun'21 31 Dec'20
Intangible assets 3 057 2 435
Deferred tax assets 74 0
Other capitalized long-term expenses 142 34
Goodwill 43 277 4 135
Machinery and Equipment 534 306
Other shares and similar rights of ownership 191 189
Loan receivables, long-term 49 49
Total non-current assets 47 326 7 149
Stocks 4 0
Accounts receivable 2 386 1 151
Loan receivables, short-term 94 149
Other receivables 638 175
Prepayments and accrued income 450 506
Deferred tax assets 2 557 0
Cash at bank and in hand 76 383 3 768
Total current assets 82 513 5 749
Total assets 129 839 12 898
Total equity 116 792 4 954
Liabilities to credit institutions 25 1 638
Other creditors 2 428 2 392
Total long-term liabilities 2 452 4 030
Liabilities to credit institutions 245 353
Advances received 3 625 500
Accounts payable 1 585 478
Other liabilities 1 373 791
Accrued expenses and deferred income 3 767 1 793
Total short-term liabilities 10 594 3 915
Total equity and liabilities 129 839 12 89812
Cash flow
Unaudited
EUR in thousands 30 Jun'21
Cash flow from operations
Profit before income taxes (2 048)
Net financial items 178
Depreciation 1 207
Change in inventory (4)
Change in trade debtors (1 235)
Change in trade creditors 1 107
Change in other provisions 3 118
Net cash flow from operations 2 324
Cash flow from investments
Purchase of fixed assets (1 611)
Purchase of shares and investments (39 967)
Purchase of other investments (2)
Net cash flow from investments (41 580)
Cash flow from financing
Change in debt (1 631)
New equity received 117 233
Payment of dividend (3 731)
Net cash flow from financing 111 870
Net change in cash and cash equivalents 72 614
Cash and cash equivalents at the beginning of the period 3 768
Cash and cash equivalents at the end of the period 76 38313
Top 10 shareholders per 30.6.2021
Number of
% of % of
Investor A-shares B-shares total Type Country
top 10 total
shares
J.P. Morgan Bank Luxembourg S.A. 3 186 752 29 742 998 32 929 750 52 % 41 % Nominee UK
State Street Bank and Trust Comp 6 504 657 0 6 504 657 10 % 8% Nominee US
Nordnet Bank AB 563 830 5 084 866 5 648 696 9% 7% Nominee Sweden
Morgan Stanley & Co. Int. Plc. 5 000 500 0 5 000 500 8% 6% Nominee UK
FJARDE AP-FONDEN 3 474 833 0 3 474 833 5% 4% Ordinary UK
HSBC TRINKAUS & BURKHARDT AG 3 174 526 0 3 174 526 5% 4% Nominee Germany
Goldman Sachs & Co. LLC 2 274 820 0 2 274 820 4% 3% Nominee US
CARNEGIE AS 2 081 990 0 2 081 990 3% 3% Broker Norway
The Bank of New York Mellon SA/NV 1 505 066 0 1 505 066 2% 2% Nominee Belgium
Skandinaviska Enskilda Banken AB 1 302 276 0 1 302 276 2% 2% Nominee Sweden
Total number owned by top 10 29 069 250 34 827 864 63 897 114 80 %
Total number of shares 45 000 000 34 999 999 79 999 999 100 %
Note that the CARNEGIE AS Broker account includes Nordhealth employees’ shares held for e.g.
stabilization measures during the stabilization period.14 Key definitions Alternative performance measures To enhance the understanding of Nordhealth’s performance, Nordhealth presents certain measures and ratios considered as Alternative Performance Measures (APMs) as defined by the European Securities and Markets Authority and should not be viewed as substitute for any financial measures (IFRS or other legislation). The APMs include, but not limited to, Annual Recurring Revenue (ARR), organic revenue, adjusted revenue, recurring revenue, adjusted recurring revenue, EBITDA, and adjusted EBITDA. These APMs are presented as Nordhealth considers them to be important supplemental measures to understand the overall picture of revenue and profit generation in Nordhealth’s operating activities. Adjusted EBITDA is revenue less all operating expenses excluding depreciation and amortization, M&A and equity funding transactions, other similar non-recurring items, and changes in contingent consideration. Pro-forma numbers include Aspit and Novasoft financials for the full time periods. Novasoft A/S was acquired in April 2021 and Aspit AS was acquired in June 2021.
15

Declaration by the Board of Directors
and CEO
We hereby confirm that, to the best of our knowledge, that the interim financial statements for the
period from 1 January to 30 June 2021 have been prepared in accordance with NGAAP, and that the
information in the financial statements gives a true and fair view of the Group’s assets, liabilities,
financial position and profit and loss taken as a whole.

We also confirm that, to the best of our knowledge, the interim report for the first half-year gives a
true and fair view of important events in the accounting period and their influence on the interim
report for the first half-year, as well as the principal risks and uncertainties facing the business in the
next accounting period.

The Board of Directors of Nordhealth AS, Oslo 28 September 2021

Charles MacBain                        Didier Breton                          Valter Pasanen
CEO                                    Chairman of the board                  Chief Financial Officer

Olli Venemies                          Janne Huttunen                         Javier Mata
Board member                           Board member                           Board member

Further information:

Charles MacBain, CEO
charles@nordhealth.com

Valter Pasanen, CFO
valter@nordhealth.com

Nordhealth AS, Eikremsvingen 9, 6422 Molde, Norway | info@nordhealth.com | nordhealth.com
You can also read