COVID-19 Hospitalizations, ICU Admissions and Deaths Associated with the New Variants of Concern
←
→
Page content transcription
If your browser does not render page correctly, please read the page content below

SCIENCE BRIEFS
                                                      COVID-19 Hospitalizations, ICU Admissions and
                                                      Deaths Associated with the New Variants of Concern
                                                      Ashleigh R. Tuite, David N. Fisman, Ayodele Odutayo, Pavlos Bobos, Vanessa Allen,
                                                      Isaac I. Bogoch, Adalsteinn D. Brown, Gerald A. Evans, Anna Greenberg, Jessica
                                                      Hopkins, Antonina Maltsev, Douglas G. Manuel, Allison McGeer, Andrew M. Morris,
                                                      Samira Mubareka, Laveena Munshi, V. Kumar Murty, Samir N. Patel, Fahad Razak,
                                                      Robert J. Reid, Beate Sander, Michael Schull, Brian Schwartz, Arthur S. Slutsky, Nathan
                                                      M. Stall, Peter Jüni on behalf of the Ontario COVID-19 Science Advisory Table

Version 1.0
                                                      Key Message
Published: March 29, 2021
Citation: Tuite AR, Fisman DN, Odutayo A, et
                                                      New variants of concern (VOCs) now account for 67% of all Ontario SARS-CoV-2
al. COVID-19 hospitalizations, ICU admissions         infections. Compared with early variants of SARS-CoV-2, VOCs are associated with a
and deaths associated with the new variants           63% increased risk of hospitalization, a 103% increased risk of intensive care unit
of concern. Science Briefs of the Ontario COVID-
19 Science Advisory Table. 2021;1(18). https://       (ICU) admission and a 56% increased risk of death due to COVID-19.
doi.org/10.47326/ocsat.2020.02.18.1.0
                                                      VOCs are having a substantial impact on Ontario’s healthcare system. On March 28,
Author Affiliations: The affiliations of the          2021, the daily number of new SARS-CoV-2 infections in Ontario reached the daily
members of the Ontario COVID-19 Science
Advisory Table can be found at https://               number of cases observed near the height of the second wave, at the start of the
covid19-sciencetable.ca/.                             province-wide lockdown, on December 26, 2020.
Declarations of Interest: The declarations of
interest of the members of the Ontario
                                                      The number of people hospitalized with COVID-19 is now 21% higher than at the
COVID-19 Science Advisory Table, its Working          start of the province-wide lockdown, while ICU occupancy is 28% higher (Figure 1).
Groups, or its partners can be found at https://      The percentage of COVID-19 patients in ICUs who are younger than 60 years is
covid19-sciencetable.ca/.
                                                      about 50% higher now than it was prior to the start of the province-wide lockdown.
About Us: The Ontario COVID-19 Science
Advisory Table is a group of scientific experts       Because the increased risk of COVID-19 hospitalization, ICU admission and death
and health system leaders who evaluate and            with VOCs is most pronounced 14 to 28 days after diagnosis, there will be significant
report on emerging evidence relevant to the
COVID-19 pandemic, to inform Ontario’s                delays until the full burden to the health care system becomes apparent.
response. Our mandate is to provide weekly
summaries of relevant scientific evidence for
the COVID-19 Health Coordination Table of the
Province of Ontario, integrating information
from existing scientific tables, Ontario’s
universities and agencies, and the best global
evidence. The Science Table summarizes its
findings for the Health Coordination Table and
the public in Science Briefs.
Correspondence to: Secretariat of the
Ontario COVID-19 Science Advisory Table
(info@covid19-sciencetable.ca)
Copyright: 2021 Ontario COVID-19 Science
Advisory Table. This is an open access
document distributed under the terms of the
Creative Commons Attribution License,
which permits unrestricted use, distribution,
and reproduction in any medium, provided
that the original work is properly cited.
The views and findings expressed in this
Science Brief are those of the authors and do
not necessarily reflect the views of all of the
members of the Ontario COVID-19 Science
Advisory Table, its Working Groups, and its
partners.
                                                      Figure 1. COVID-19 Hospital and ICU Occupancy on March 28, 2021 Compared with December 26, 2020
                                                      Bar graphs showing the COVID-19 hospital and ICU occupancy in Ontario. The relative increase between March 28,

Science Briefs | https://covid19-sciencetable.ca/science-briefs                                                                                    March 29, 2021 | 1
Ontario COVID-19 Science Advisory Table                                    COVID-19 Hospitalizations, ICU Admissions and Deaths Associated with the New Variants of Concern

                                                      2021 and December 26, 2020 is indicated above the corresponding bars for hospital and ICU occupancy. ICU,
                                                      intensive care unit.

                                                      Summary
                                                      Background
                                                      As of March 28, 2021 new variants of concern (VOCs) account for 67% of all Ontario
                                                      SARS-CoV-2 infections. The B.1.1.7 variant originally detected in Kent, United
                                                      Kingdom accounts for more than 90% of all VOCs in Ontario, with emerging
                                                      evidence that it is both more transmissible and virulent.

                                                      Questions
                                                      What are the risks of COVID-19 hospitalization, ICU admission and death caused by
                                                      VOCs as compared with the early variants of SARS-CoV-2?
                                                      What is the early impact of new VOCs on Ontario’s healthcare system?

                                                      Findings
                                                      A retrospective cohort study of 26,314 people in Ontario testing positive for SARS-CoV-
                                                      2 between February 7 and March 11, 2021, showed that 9,395 people (35.7%) infected
                                                      with VOCs had a 62% relative increase in COVID-19 hospitalizations (odds ratio [OR]
                                                      1.62, 95% confidence interval [CI] 1.41 to 1.87), a 114% relative increase in ICU
                                                      admissions (OR 2.14, 95% CI 1.52 to 3.02), and a 40% relative increase in COVID-19
                                                      deaths (OR 1.40, 95% CI 1.01 to 1.94), after adjusting for age, sex and comorbidities.
                                                      A meta-analysis including the Ontario cohort study and additional cohort studies in
                                                      the United Kingdom and Denmark showed that people infected with VOCs had a
                                                      63% higher risk of hospitalization (RR 1.63, 95% CI 1.44 to 1.83), a doubling of the
                                                      risk of ICU admission (RR 2.03, 95% CI 1.69 to 2.45), and a 56% higher risk of all-
                                                      cause death (RR 1.56, 95% CI 1.30 to 1.87). Estimates observed in different studies
                                                      and regions were completely consistent, and the B.1.1.7 variant was dominant in all
                                                      three jurisdictions over the study periods.
                                                      The number of people hospitalized with COVID-19 on March 28, 2021, is 21% higher
                                                      than at the start of the province-wide lockdown during the second wave on
                                                      December 26, 2020, while ICU occupancy is 28% higher.
                                                      Between December 14 to 20, 2020, there were 149 new admissions to ICU; people
                                                      aged 59 years and younger accounted for 30% of admissions. Between March 15,
                                                      2021 and March 21, 2021, there were 157 new admissions to ICU; people aged 59
                                                      years and younger accounted for 46% of admissions.

                                                      Interpretation
                                                      The new VOCs will result in a considerably higher burden to Ontario’s health care
                                                      system during the third wave compared to the impact of early SARS-CoV-2 variants
                                                      during Ontario’s second wave.
                                                      Since the start of the third wave on March 1, 2021, the number of new cases of SARS-
                                                      CoV-2 infection, and the COVID-19 hospital and ICU occupancies have surpassed prior
                                                      thresholds at the start of the province-wide lockdown on December 26, 2020.

                                                      Background
                                                      Around March 1, 2021, Ontario entered the third wave of the COVID-19 pandemic,
                                                      with the slope of the epidemic curve driven by the increasing number of VOCs since
                                                      March 3, 2021 (Figure 2).1 As of March 28, 2021, there were an estimated total of
Science Briefs | https://covid19-sciencetable.ca/science-briefs                                                                                         March 29, 2021 | 2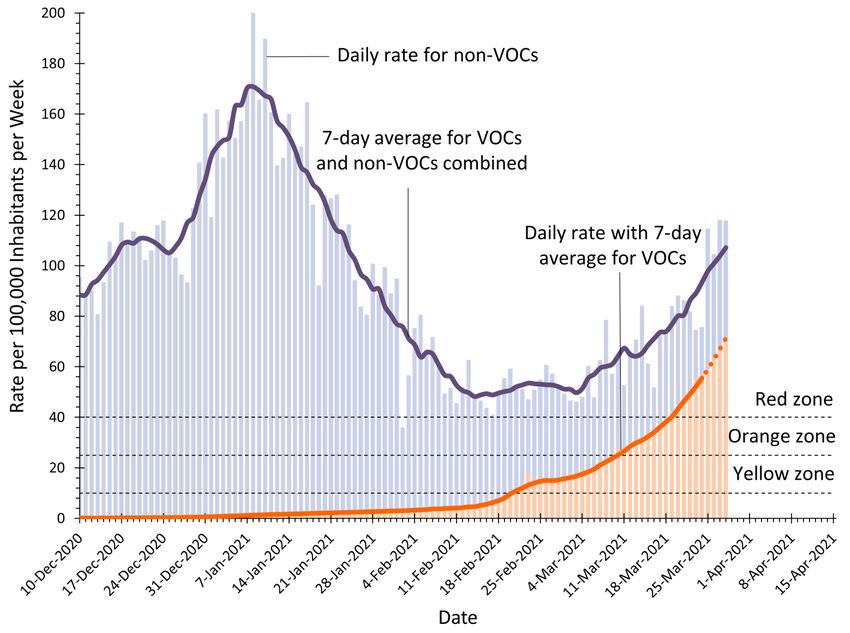
Ontario COVID-19 Science Advisory Table                                      COVID-19 Hospitalizations, ICU Admissions and Deaths Associated with the New Variants of Concern

                                                      107.1 new SARS-CoV-2 infections per 100,000 persons per week, with 35.7 new
                                                      SARS-CoV-2 infections per 100,000 Ontarians per week caused by early variants of
                                                      SARS-CoV-2 (non-VOCs), and 71.4 new SARS-CoV-2 infections per 100,000 Ontarians
                                                      per week caused by new VOCs. The VOCs accounted for an estimated 67% of new
                                                      cases of SARS-CoV-2 infections.1 VOCs are now the dominant source of SARS-CoV-2
                                                      infection in Ontario.

                                                      Figure 2. Rate of New SARS-CoV-2 Infections in Ontario
                                                      Seven-day moving averages of confirmed new SARS-CoV-2 infections overall in Ontario per 100,000 inhabitants per
                                                      week (purple line), and infections caused by new VOCs in Ontario per 100,000 inhabitants per week (orange line).
                                                      The daily rate per 100,000 inhabitants per week is represented by blue and orange bars. The incidence of new
                                                      infections related to VOCs from March 24th 2021 and onwards is predicted (dashed orange line). The color-coded
                                                      zones are the zones of public health measures established by Ontario’s COVID-19 response framework: grey/red zone
                                                      = weekly SARS-CoV-2 incidence of ≥40 per 100,000; orange zone = weekly incidence 25 to 39.9 per 100,000; and
                                                      yellow zone = weekly incidence of 10 to 24.9 per 100,000. VOC, variant of concern. Graph adapted from Ontario
                                                      COVID-19 Science Advisory Table.1

                                                      The B.1.1.7 variant, which was originally detected in Kent, United Kingdom,
                                                      currently accounts for more than 90% of all VOCs in Ontario. The B.1.351 and P.1
                                                      variants originally detected in South Africa and Brazil, respectively, account for the
                                                      remaining VOCs.2 The B.1.1.7 variant which is dominant in Ontario, is at least 40%
                                                      more transmissible than early variants of SARS-CoV-2,3 and emerging evidence
                                                      suggests it may be more virulent.4

                                                      Questions
                                                      What are the risks of COVID-19 hospitalization, ICU admission and death caused by
                                                      VOCs as compared with the early variants of SARS-CoV-2?
                                                      What is the early impact of new VOCs on Ontario’s healthcare system?

                                                      Findings
                                                      Table 1 presents the results of a retrospective cohort study of 26,314 people in
                                                      Ontario who were PCR-positive for SARS-CoV-2 between February 7 and March 11,
                                                      2021, with 9,395 people (35.7%) having an infection caused by a VOC. After
                                                      adjusting for age, sex and comorbidities, infections due to VOCs were associated

Science Briefs | https://covid19-sciencetable.ca/science-briefs                                                                                           March 29, 2021 | 3
Ontario COVID-19 Science Advisory Table                                       COVID-19 Hospitalizations, ICU Admissions and Deaths Associated with the New Variants of Concern

                                                      with a 62% relative increase in COVID-19 hospitalizations (odds ratio [OR] 1.62, 95%
                                                      confidence interval [CI] 1.41 to 1.87), a 114% relative increase in ICU admissions (OR
                                                      2.14, 95% CI 1.52 to 3.02), and a 40% relative increase in COVID-19 deaths (OR 1.40,
                                                      95% CI 1.01 to 1.94). These risk elevations for COVID-19 hospitalization, ICU
                                                      admission and death were consistent across all age groups.
                                                                                                                                 Adjusted odds ratio (95% CI)
                                                        COVID-19 Hospitalizations                                                    1.62 (1.41 to 1.87)
                                                        COVID-19 ICU admissions                                                      2.14 (1.52 to 3.02)
                                                        COVID-19 Deaths                                                              1.40 (1.01 to 1.94)

                                                      Table 1. Risk of COVID-19 Hospitalization, Intensive Care Unit Admission and Death Associated with VOCs
                                                      Compared to Early Variants in Ontario, Canada
                                                      Adjusted odds ratios and 95% confidence intervals for the risk of COVID-19 hospitalizations, intensive care unit
                                                      admissions and deaths associated with new VOCs compared to early variants. VOC, variant of concern; CI,
                                                      confidence interval; ICU, intensive care unit.

                                                      Figure 3 presents the results a meta-analysis of cohort studies in Ontario (Table 1,
                                                      above), the United Kingdom5,6 and Denmark7 comparing new VOCs with early
                                                      variants, again with the dominant VOC being B.1.1.7 in all three jurisdictions over
                                                      the study periods.3 Pooling adjusted estimates of relative risks (RRs), people infected
                                                      with VOCs had a 63% higher risk of hospitalization (RR 1.63, 95% CI 1.44 to 1.83), a
                                                      doubling of the risk of ICU admission (RR 2.03, 95% CI 1.69 to 2.45), and a 56%
                                                      higher risk of all-cause death (RR 1.56, 95% CI 1.30 to 1.87). Estimates observed in
                                                      different studies and regions were completely consistent.

                                                      Figure 3. Meta-Analysis of the Risk of COVID-19 Hospitalization, Intensive Care Unit Admission and Death
                                                      Associated with new VOCs Compared to Early Variants
                                                      Each square presents the results of an individual cohort study, with the size of the square being proportional to the
                                                      weights used in the meta-analysis and the horizontal lines indicating the 95% confidence intervals. The solid vertical
                                                      line at 1 indicates that there is no difference in prognosis between new VOCs and early variants. The diamond
                                                      indicates the pooled estimate of the relative risk combining individual studies from different regions. Estimates for
                                                      Ontario and Denmark are odds ratios; estimates for the United Kingdom are hazard ratios. The retrospective cohort
                                                      study in Ontario included 26,314 participants in Ontario with PCR confirmed SARS-CoV-2 infection between February
                                                      7 and March 11, 2021, of whom 9,395 were infected with new VOCs. The retrospective cohort study by Bager et al.
                                                      included 18,449 participants in Denmark with PCR confirmed SARS-CoV-2 infection between January 1 and February
                                                      9, 2021 with 2,155 infected with new VOCs.7 Estimates were adjusted for age, sex, calendar period, region, and
                                                      number of comorbidities during the past 5 years. The retrospective cohort study by Patone et al. included 198,420
                                                      individuals in the United Kingdom with PCR confirmed SARS-CoV-2 infection between November 1, 2020 and January
                                                      27, 2021, of whom 80,494 were infected with new VOCs. Relative risk estimates were adjusted for age, sex, region,
                                                      socio-demographic factors and comorbidities, including asthma, chronic obstructive pulmonary disease, diabetes

Science Briefs | https://covid19-sciencetable.ca/science-briefs                                                                                            March 29, 2021 | 4
Ontario COVID-19 Science Advisory Table COVID-19 Hospitalizations, ICU Admissions and Deaths Associated with the New Variants of Concern
and hypertension.5 The retrospective cohort study by Challen et al. included 109,812 individuals in the United
Kingdom with PCR confirmed SARS-CoV-2 infection between October 1, 2020 and January 29, 2021, with 54,906
participants with new VOCs matched to 54,906 participants with early variants.6 Participants were matched on age,
sex, date of specimen collection, ethnicity, geographical location, and index of multiple deprivation, which is a
marker for socioeconomic status; estimates were subsequently adjusted for age. VOC, variant of concern; CI,
confidence interval; ICU, intensive care unit.
Figure 4 shows the time to death observed in a retrospective cohort study by
Challen et al. in the United Kingdom involving 109,812 participants with positive PCR
tests for SARS-CoV-2 between October 1, 2020, to January 29, 2021, with 54,906
participants infected with new VOCs matched to 54,906 participants infected with
the early variant.6 The curves overlap until day 12 after diagnosis, at which point
the curves start to separate, with a higher risk of death among participants infected
with new VOCs compared with participants infected with early variants.
Figure 4. Time to Death Following SARS-CoV-2 Infection with New VOCs Compared with Early Variants
Curves describing the time to death from first PCR confirmation of SARS-CoV-2 infection among individuals in the United
Kingdom infected with new VOCs versus early SARS-CoV-2 variants. Participants were matched on age, sex, date of
specimen collection, ethnicity, geographical location, and index of multiple deprivation, which is a marker for socioeconomic
status, and estimates were subsequently adjusted for age. Data from Challen et al.6 VOC, variant of concern.
Figure 5 shows the risk of death associated with new VOCs compared with early
SARS-CoV-2 variants from days 0 to 14 and days 15 to 28 after diagnosis of SARS-
CoV-2 infection. Results are adapted from the aforementioned retrospective cohort
study of people with PCR confirmed SARS-CoV-2 infection in the United Kingdom by
Challen et al.6 Between days 0 and 14 after diagnosis, there was only a minimal
difference in the risk of death (RR 1.23, 95% CI 0.92 to 1.64) associated with the new
VOCs compared with early variants. However, between days 15 and 28, the risk of
death was more than doubled (RR 2.40, 95% CI 1.66 to 3.47).
Figure 5. Risk of COVID-19 Death Associated with new VOCs Compared with Early Variants by Time Since
Diagnosis of SARS-CoV-2 Infection
Adapted from a retrospective cohort study by Challen et al. which included 109,812 individuals in the United Kingdom
with PCR-confirmed SARS-CoV-2 infection between October 2020 to 29 January 2021, with 54,906 individuals with new
VOCs matched to 54,906 individuals with the early variant.6 Individuals were matched on age, sex, date of specimen
Science Briefs | https://covid19-sciencetable.ca/science-briefs March 29, 2021 | 5Ontario COVID-19 Science Advisory Table COVID-19 Hospitalizations, ICU Admissions and Deaths Associated with the New Variants of Concern
collection, ethnicity, geographical location, and index of multiple deprivation, which is a marker for socioeconomic
status. Each square presents the relative risk for death with the new VOCs versus early variants. The horizontal lines
indicate the 95% confidence intervals. The solid vertical line at 1 indicates that there is no difference in prognosis
between new VOCs and early SARS-CoV-2 variants. VOC, variant of concern; CI, confidence interval.
Figure 6 shows the risk of ICU admission associated with new VOCs versus early
SARS-CoV-2 variants at days 1, 5, 10 and 15 after diagnosis of SARS-CoV-2 infection
in a retrospective cohort study by Patone et al. The study involved 198,420
individuals in the United Kingdom with PCR-confirmed SARS-CoV-2 infection, of
whom 80,494 were infected with new VOCs.5 On day 1, there was a minimal
difference in the risk of ICU admission between people infected with new VOCs and
those infected with early variants (RR 1.20, 95% CI 0.58 to 2.48). Subsequently,
there was a progressive, lagged increase in the risk of ICU admission associated with
new VOCs, with a 58% increase at day 5 and a near fourfold increase at day 10.
Figure 6. Risk of COVID-19 ICU Admission Associated with New VOCs Compared with Early Variants by Time Since
Diagnosis of SARS-CoV-2 Infection
Adapted from a retrospective cohort study by Patone et al.5 The study involved 198,420 individuals in the United
Kingdom with PCR-confirmed SARS-CoV-2 infection, of whom 80,494 were infected with new VOCs. Relative risk
estimated were adjusted for age, sex, region, socio-demographic factors and comorbidities including asthma, chronic
obstructive pulmonary disease, diabetes and hypertension. Each square represents the relative risk for ICU admission
with the new VOCs versus early variants. The horizontal lines indicate the 95% confidence intervals. The solid vertical
line at 1 indicates that there is no difference in prognosis between new VOCs and early variants. VOC, variant of
concern; CI, confidence interval.
Figure 7 shows the 7-day moving average of daily SARS-CoV-2 infections, and daily
COVID-19 hospital and ICU occupancy in Ontario. At the time of the province-wide
lockdown near the height of Ontario’s second wave on December 26, 2020, there
were 2,236 new infections per day, 755 people were hospitalized due to COVID-19,
and 286 in ICU due to COVID-19.
Since the start of the third wave around March 1, 2021, the number of new cases, as
well as hospital and ICU occupancy have surpassed prior thresholds seen at the start
of the province-wide lockdown on December 26, 2020. The threshold of 286 COVID-
19 cases in ICUs at the time of the lockdown on December 26, 2020, was reached on
March 9, 2021. Likewise, COVID-19 hospital occupancy of 755 people was reached
on March 16, 2021. Finally, the threshold of 2,236 new SARS-CoV-2 infections per
day was reached on March 28, 2021.
We project a 2 to 4 week time lag between daily SARS-CoV-2 cases and COVID-19
hospitalizations and ICU admissions, with lagging risk increases due to the new VOCs
(see Figures 3 to 5). Therefore, hospital and ICU occupancies due to COVID-19 will
continue to increase considerably over time, and would so even if SARS-CoV-2 case
numbers were to remain at the current level seen on March 28, 2021.
Science Briefs | https://covid19-sciencetable.ca/science-briefs March 29, 2021 | 6Ontario COVID-19 Science Advisory Table COVID-19 Hospitalizations, ICU Admissions and Deaths Associated with the New Variants of Concern
Figure 7. Number of New SARS-CoV-2 Infections, COVID-19 Hospital, and ICU Occupancy in Ontario
7-day moving averages of confirmed new SARS-CoV-2 infections in Ontario per week, number of people hospitalized
with COVID-19, and number of ICU beds in Ontario occupied by COVID-19 patients. VOC, variant of concern; ICU,
intensive care unit.
Table 2 presents a comparison of the number of new SARS-CoV-2 infections and
COVID-19 hospital and ICU occupancy for key dates during the third wave compared
with the start of the province-wide lockdown on December 26, 2020 during the
second wave. As of March 28, 2021, the predicted 7-day average of SARS-CoV-2
infections during the third wave reached the 7-day midpoint average seen at the
start of the province-wide lockdown on December 26, 2020.
Key Date SARS-CoV-2 Infections Hospital Occupancy ICU Occupancy
A 26-Dec-20 2,236 755 286
B 9-Mar-21 1,269 689 290
C 16-Mar-21 1,480 761 292
D 28-Mar-21 2,236 917 366
Table 2. Comparison of Key Dates During the Third Wave in Ontario with the Start of the Province-Wide
Lockdown During the Second Wave on December 26, 2020
A, December 26, 2020, was the start date of the province-wide lockdown during the second wave; B, March 9, 2021 is the
date when the COVID-19 ICU occupancy during the third wave reached COVID-19 ICU occupancy seen on December 26,
2020; C, March 16, 2021 is the date when COVID-19 hospital occupancy during the third wave reached COVID-19 hospital
occupancy seen on December 26, 2020; D, March 28, 2021 is the date when the predicted 7-day average of SARS-CoV-2
infections during the third wave reached the 7-day midpoint average seen on December 26, 2020. ICU, intensive care unit.
Second wave, September 1, 2020 to February 28, 2021. Third wave, March 1, 2020 to ongoing.
Figure 1 above presents a comparison of COVID-19 hospital occupancy and ICU
occupancy in Ontario on March 28, 2021, compared with the start of the province-
wide lockdown on December 26, 2020. The number of people hospitalized with
COVID-19 on March 28, 2021, is 21% higher than on December 26, 2020, while ICU
occupancy is 28% higher.
Figure 8 presents the percentage of COVID-19 ICU admissions in Ontario by age group
in the week prior to the lockdown during the second wave (December 14 to 20, 2020)
with the last available week of ICU admission data during the third wave (March 15 to
21, 2021). Between December 14 to 20, 2020, there were 149 new admissions to ICU;
people aged 59 years and younger accounted for 30% of admissions. Between March
15, 2021 and March 21, 2021, there were 157 new admissions to ICU; people aged 59
years and younger accounted for 46% of admissions.
Science Briefs | https://covid19-sciencetable.ca/science-briefs March 29, 2021 | 7Ontario COVID-19 Science Advisory Table COVID-19 Hospitalizations, ICU Admissions and Deaths Associated with the New Variants of Concern
Figure 8. Weekly COVID-19 ICU Admissions in Ontario by Age
December 14 to 20, 2020 corresponds to the week prior to lockdown during the second wave, March 15 to 21, 2021
corresponds to the last available week of ICU admission data during the third wave.
Interpretation
Compared with early variants of SARS-CoV-2, new VOCs are associated with a 103%
increase in the risk of hospitalization, a 63% increase in the risk of ICU admission and
a 56% increase in the risk of death due to COVID-19, which will result in a
considerably higher burden to the health care system than observed with early
variants during the second wave. The risk increase is particularly pronounced 14 to
28 days after a diagnosis of SARS-CoV-2 infection, which in turn will result in delays
until the full burden to the health care system becomes apparent.
Since the start of the third wave around March 1, 2021, the number of new cases of
SARS-CoV-2 infection, and the COVID-19 hospital and ICU occupancies have
surpassed prior thresholds at the start of the province-wide lockdown on December
26, 2020. As of March 28, 2020, hospital occupancy was 21% higher and ICU
occupancy 28% higher than at the start of the province-wide lockdown.
Currently, patients aged 59 years and younger make up 46% of new COVID-19
admissions to ICUs, compared with 30% in the week prior to the start of the
province-wide lockdown on December 26, 2020.
Science Briefs | https://covid19-sciencetable.ca/science-briefs March 29, 2021 | 8Ontario COVID-19 Science Advisory Table COVID-19 Hospitalizations, ICU Admissions and Deaths Associated with the New Variants of Concern
Methods Used for This Science Brief
We conducted a retrospective cohort study using cases of SARS-CoV-2 infection
reported in CCM/iPHIS with a case report date between Feb 7 and March 11, 2021.
We restricted the analysis to cases that were tested for variants of concern. As
Ontario’s long-term care population was highly vaccinated with SARS-CoV-2 vaccines
as of February 2021, and were unlikely to become critically ill and require intensive
care, long term care residents were excluded from the analysis. A total of 26,314
individuals were included in the analysis, of whom 9,395 had a detected SARS-CoV-2
infection with a VOC. Associations between VOC SARS-CoV-2 infection and COVID-19
outcomes were evaluated by constructing logistic regression models with the
following prespecified covariates: age (by 10-year age categories), sex, obesity, and
any of the following medical comorbidities: asthma, immunocompromise, COPD,
hematological disease, renal disease, neurological condition, diabetes, or liver
disease. Time (date of case report) was included as a linear trend term. To account
for geographic variability in the fraction of infections caused by VOCs, public health
units were included as indicator variables. The analysis of the age distribution in
Figure 8 is based on all cases, without exclusion of long-term care residents.
We searched PubMed, Google Scholar, the COVID-19 Rapid Evidence Reviews, the
Joanna Briggs Institute’s COVID-19 Special Collection, LitCovid in PubMed, the
Oxford COVID-19 Evidence Service, the World Health Organization’s Global
Literature on Coronavirus Disease, and other COVID-19 specific resources listed by
the Guidelines International Network and the McMaster Health Forum for studies
on the prognosis associated with new VOCs compared with early variants. In
addition, we retrieved reports citing relevant articles through Google Scholar and
reviewed references from identified articles for additional studies. The search was
last updated on March 26, 2021. For the United Kingdom, the analysis by Challen et
al6 was selected for extraction of mortality data rather than the analysis by Davies et
al4 since Challen et al.’s analysis was considered to have a lower risk of confounding.
We used an inverse-variance fixed-effects meta-analysis to combine adjusted
estimates from individual studies. Analyses were done in R (R Foundation, Vienna,
Austria) and STATA (StataCorp LLC, College Station, TX).
Author Contributions
PJ conceived the Science Brief. ART, AO and PJ wrote the first draft. ART, DNF, PB
and PJ performed analyses. All authors revised the Science Brief critically for
important intellectual content and approved the final version.
References
1. Ontario COVID-19 Science Advisory Table. Ontario dashboard: tracking the third
wave. Ontario COVID-19 Science Advisory Table. Published 2021. Accessed
March 21, 2021. https://covid19-sciencetable.ca/ontario-dashboard/
2. Public Health Ontario. Epidemiologic Summary: COVID-19 in Ontario – January
15, 2020 to March 28, 2021. Ontario Agency for Health Protection and
Promotion; 2021:31. https://www.publichealthontario.ca/-/media/documents/
ncov/epi/covid-19-daily-epi-summary-report.pdf?la=en
3. Davies NG, Abbott S, Barnard RC, et al. Estimated transmissibility and impact of
SARS-CoV-2 lineage B.1.1.7 in England. Science. Published online March 3, 2021.
https://doi.org/10.1126/science.abg3055
4. Davies NG, Jarvis CI, Edmunds WJ, Jewell NP, Diaz-Ordaz K, Keogh RH. Increased
Science Briefs | https://covid19-sciencetable.ca/science-briefs March 29, 2021 | 9Ontario COVID-19 Science Advisory Table COVID-19 Hospitalizations, ICU Admissions and Deaths Associated with the New Variants of Concern
mortality in community-tested cases of SARS-CoV-2 lineage B.1.1.7. Nature.
Published online March 15, 2021:1-5. https://doi.org/10.1038/s41586-021-
03426-1
5. Patone M, Thomas K, Hatch R, et al. Analysis of severe outcomes associated with
the SARS-CoV-2 Variant of Concern 202012/01 in England using ICNARC Case
Mix Programme and QResearch databases. medRxiv. Published online March 12,
2021:2021.03.11.21253364. https://doi.org/10.1101/2021.03.11.21253364
6. Challen R, Brooks-Pollock E, Read JM, Dyson L, Tsaneva-Atanasova K, Danon L.
Risk of mortality in patients infected with SARS-CoV-2 variant of concern
202012/1: matched cohort study. BMJ. 2021;372:n579. https://doi.org/10.1136/
bmj.n579
7. Bager P, Wohlfahrt J, Fonager J, et al. Increased Risk of Hospitalisation
Associated with Infection with SARS-CoV-2 Lineage B.1.1.7 in Denmark. Social
Science Research Network; 2021. https://doi.org/10.2139/ssrn.3792894
Science Briefs | https://covid19-sciencetable.ca/science-briefs March 29, 2021 | 10You can also read