Does Homelessness Preven-on Work: Evalua-on of the NYC Homebase Program - ICPH Conference, 1/17/14
←
→
Page content transcription
If your browser does not render page correctly, please read the page content below
Does
  Homelessness
  Preven-on
  Work:

Evalua-on
  of
  the
  NYC
  Homebase
  Program


ICPH
  Conference,
  1/17/14


                                                           1
New York City Context

    Right to Shelter

Work Supports
  TANF Cash Grant
         Diversion at Intake

   Eviction Prevention         2
Over
  a
  million
  households
  in

  NYC
  live
  in
  poverty
  or
  face

steep
  rent
  burdens,
  threat
  of

evic:on,
  and
  similar
  housing

  risks,
  but
  less
  than
  10,000

    enter
  shelter
  each
  year.


                                                   3
Was
  ini:ated
  in
  2004
  in
  six
  communi:es


Non-profit organizations run 14 Homebase offices in
the highest need communities, serving over 10,000
households each year

Flexible service plans including family and landlord
mediation, budgeting, entitlements advocacy,
employment, legal advice and short-term
financial assistance
                                                               4
Program Model
Since 2005, Homebase has served almost 50,000
households    and providedto$24
 8 non-profit organizations    runmillion in financial
                                   11 Homebase
assistance….
 programs in the highest need communities serving
 over 10,000 each year
But how many would have come to shelter if not for
services?

 Flexible service plans including family and landlord
 mediation, budgeting, entitlements advocacy,
 employment, legal advice and short-term
 financial assistance

“Brief” and “full” service model

                                                    5
Need
  for
  An
  Evalua-on


• To
  determine
  how
  targeted
  and
  effec:ve

  preven:on
  programs
  are,
  researchers
  have

  long
  called
  for
  randomized
  control
  trials
  (RCT)

• Program
  evalua:on
  results
  are
  important

  indicators
  of
  the
  value
  obtained
  from

  government
  programs
  and
  expenditures


                                                                      6
In
2009,
DHS
commissioned
a
comprehensive
mul:-‐
part
evalua:on
to
examine
the
Homebase
homelessness
preven:on
program
in
order
to
measure
effec:veness,
learn
how
the
program
could
be
improved
upon,
and
contribute
to
the
na:onal
conversa:on
on
preven:on.
New
York
City
is
the
first
locality
in
the
na:on
to
examine
the
impact
of
homelessness
preven:on
programs
and
to
develop
a
research-‐based
risk
assessment
to
improve
targe:ng.
7
The
  Comprehensive
  Evalua-on
  Study


• Neighborhood
  shelter
  trends


• The
  community
  impact
  of
  Homebase

• Family
  risk
  factors
  that
  predict

  shelter
  entry

• Random
  assignment
  study


                                                 8
1. What
  makes
  a
  community
  high
  risk
  for
  shelter
  entries
  and
  is

   Homebase
  targe@ng
  services
  to
  these
  high
  risk
  communi@es?

   John
  Mollenkopf,
  City
  University
  of
  New
  York,
  Center
  for
  Urban

   Research


2. Do
  communi@es
  served
  by
  Homebase
  see
  a
  reduc@on
  in
  shelter

    entries?
  Brendan
  O’Flaherty
  and
  Peter
  Messeri,
  Columbia
  Center

    for
  Homelessness
  Preven:on
  Studies


3. What
  makes
  a
  household
  high
  risk
  for
  shelter
  entry
  and
  can

   Homebase
  target
  services
  to
  these
  high
  risk
  individuals?


   MaryBeth
  Shinn
  and
  Andrew
  Greer,
  Vanderbilt
  University


4. Do
  households
  served
  by
  Homebase
  enter
  shelter
  at
  a
  lower
  rate

    than
  those
  who
  are
  not
  served?

  Howard
  Rolston
  and
  Gretchen

    Locke,
  Abt
  Associates


                                                                                                      9
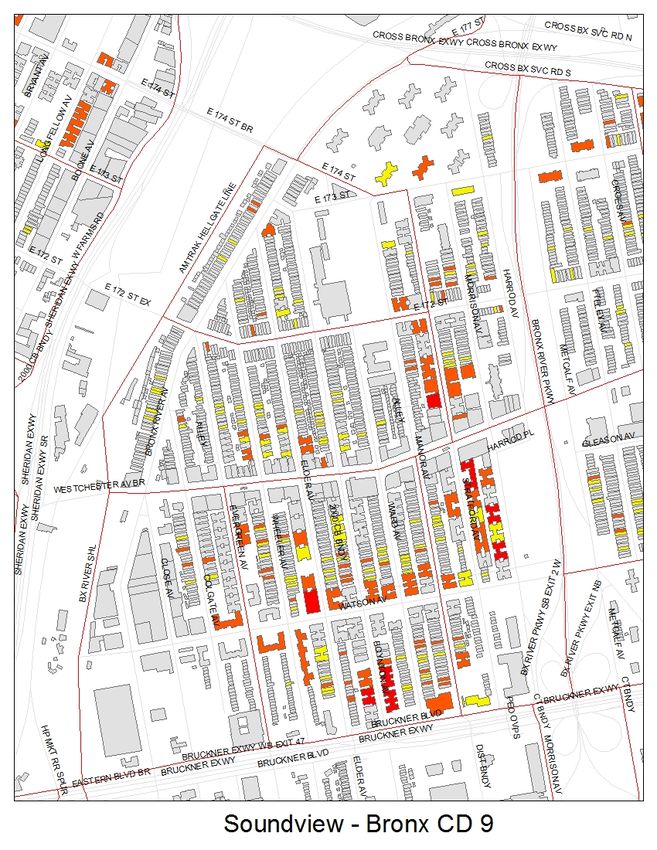
Part
I.
Neighborhood
Shelter
Trends
What
are
the
neighborhood
and
familial
factors
that
contribute
to
homelessness?
Geo-‐coded
last
addresses
of
families
found
eligible
2004
through
2009
by
census
tract
Matched
that
with
extensive
range
of
tract-‐level
data
(socio-‐economic,
housing,
etc)
from
the
2005-‐2009
combined
ACS
file,
residen:al
sales,
and
assisted
housing
loca:ons.
10
11
Neighborhood
  Shelter
  Trends


Findings:

  Shelter
  Entry…

• Correlates
  strongly
  with
  race
  and
  ethnicity

• Also
  correlates
  strongly
  with
  poverty,
  family

  form,
  marginality

• Correlates
  moderately
  with
  neighborhood

  characteris:cs
  (rent
  levels,
  rent
  to
  income

  ra:os)

• Correlates
  only
  weakly
  with
  changes
  in

  residen:al
  sales
  prices
  or
  trends
  in
  rent
  levels


                                                                          12
Part
II.
Community
Impact
of
Homebase:
A
Quasi-‐
Experimental
Do
communi@es
served
by
Homebase
see
a
reduc@on
in
shelter
entries?
Would
these
par:cipants
have
become
homeless
in
the
absence
of
preven:on
efforts?
How
many
non-‐par:cipants
became
homeless
as
a
result
of
the
preven:on
program—i.e.
“musical
chairs”
When
would
par:cipants
and
non
par:cipants
have
become
homeless?
Did
Homebase
impact
the
length
of
stay
for
non-‐par:cipants
or
households
already
in
shelter?
What
is
the
impact
of
foreclosures
on
shelter
entries?
13
Data

• Anonymous
  lis:ng
  of
  families
  entering
  NYC
  shelter
  system

  between
  January
  2003
  and
  November
  2008


• Separate
  lis:ng

  of
  HB
  cases
  opened
  between
  November
  2004

  and
  November
  2008.

• Iden:fying
  informa:on

     – Census
  tract

  and
  community
  district
  of
  residence

     – Month
  of
  shelter
  entry/HB
  case
  opened

• Other
  useful
  informa:on

     – Official

  start
  of
  HB
  opera:ons
  in
  each
  CD

     – Length
  of
  shelter
  stay

     – Distance
  between
  each
  community
  district
  and
  closest
  HB

       center

     – Monthly
  count
  of
  housing
  units
  in
  buildings
  in
  which


       foreclosure
  proceedings
  were
  ini:ated


                                                                                       14
Model

  Design
  and
  Specifica-on

• HB
  effects
  could
  be
  iden:fied
  because
  DHS
  ini:ally
  limited

  HB

  services
  to
  six
  CDs
  in
  November
  2004,
  then
  expand
  eligibility

  to
  31
  more
  CD’s
  in
  July
  2007
  and
  to
  the
  en:re
  City
  in
  January

  2008.


• Complica:ng
  the
  quasi
  experiment:

     – DHS
  purposely
  selected
  high
  shelter
  use
  neighborhoods
  for

       phasing
  in

  CD’s
  and
  loca:on
  of
  HB
  centers

     – Great
  Recession
  result
  in
  secular
  rise
  in
  shelter
  entries


                                                                                                       15
Results


During
  the
  November
  2004
  through

         November
  2008
  period:


• Homebase
  reduced
  shelter
  entries:


  Between
  10
  and
  20
  family
  entrants
  were

         averted

  per
  100
  HB
  cases
  opened.


                                                                    16
More
Results
• Homebase
is
more
effec:ve
at
aver:ng
shelter
entries
in
higher
risk
neighborhoods
• Homebase
does
not
cause
“musical
chairs.”
Shelter
entries
are
not
pushed
to
neighboring
areas.
• Families
are
not
simply
delaying
entry.
• HB
doesn’t
affect
length
of
shelter
stay.
• For
every
100
Lis
Pendens
(pre-‐foreclosure
filings
),
between
3
and
5
families
enter
shelter
17
Part
  III.
  Risk
  Assessment


                     A
  risk
  assessment
  tool


       Who
  is
  most
  likely
  to
  come
  into
  shelter


                                                                          18
Study
  Ques-ons

• Q1:
  What
  was
  the
  pamern
  of
  shelter
  entry

over
  :me
  among
  families
  who
  applied
  for

Homebase
  services?

• Q2:
  What
  families
  were
  at
  highest
  risk
  of

entering
  shelter?


• Q3:
  Is
  it
  possible
  to
  develop
  a
  short
  screening

instrument
  to
  target
  services?


• Q4:
  If
  Homebase
  adopted
  bemer
  targe:ng,

how
  much
  more
  effec:ve
  might
  it
  be?

                                                                            19
Data

11,105
  Homebase
  families
  who
  applied
  for

services
  between
  Oct
  1,
  2004
  and
  June
  30,

2008


Analyzed
  intake
  and
  program
  eligibility
  data

for
  families
  with
  children


DHS
  provided
  administra:ve
  data
  on
  shelter

entry
  over
  the
  next
  3
  years


                                                                     20
Risk
  Factor
  Domains

•   Demographics

•   Human
  capital
  and
  poverty


•   Housing

•   Disability

•   Interpersonal
  discord


•   Childhood
  experiences

•   Previous
  Shelter

•   Dependent
  Variable:
  Time
  to
  Shelter
  Entry


                                                                   21
Survival
  Analysis

What
  was
  the
  pamern
  of
  shelter
  entry?

• Survival
  Analysis

          – Technique
  borrowed
  from
  medicine
  where
  “survival”

            is
  how
  long
  a
  pa:ent
  lived
  aner
  treatment


          – For
  us,
  the
  end
  point
  was
  not
  mortality,
  but
  shelter

            entry


          – Ques:ons:


               • “how
  long
  did
  people
  stay
  out
  of
  shelter?”
  (Survival
  Curve)

               • “which
  periods
  of
  :me
  were
  applicants
  at
  greatest
  risk
  of

                 shelter
  entry?”
  (Hazard
  Es:mate)


                                                                                                      22
Results
-‐>
Q1
What
was
the
pamern
of
shelter
entry
over
:me
among
families
who
applied
for
Homebase
services?
– 12.8%
entered
shelter
within
three
years
of
applying
–
Most
families
who
entered
shelter
did
so
shortly
aner
applying
for
services
23
Results
-‐>
Q2
(Risk
Factors)
risk
of
entering
shelter?
What
families
were
at
highest
Coefficient
Haz
Ra-o
Risk
direc-on
Conf
Interval
Female
1.28
+
1.01-‐1.63
Age
.98
-‐
.98-‐.99
Child
under
2
yrs
old
1.14
+
1.01-‐1.29
Pregnant
1.24
+
1.08-‐1.43
High
School
/
GED
.85
-‐
.75-‐.96
Currently
Employed
.81
-‐
.71-‐.93
Public
Assistance
History
1.30
+
1.13-‐1.49
Name
on
lease
.816
-‐
.75-‐.96
Threatened
with
evic:on
1.20
+
1.04-‐1.38
Number
of
:mes
moved
in
past
yr
1.16
+
1.08-‐1.24
24
Results
-‐>
Q2
(Risk
Factors)
Coefficient
Risk
Direc-on
Conf
Interval
Haz
Ra-o
History
with
protec:ve
services
1.37
+
1.13-‐1.66
Av
Discord
with
landlord/ 1.09
+
1.05-‐1.13
household
Childhood
Disrup:on
index
1.15
+
1.08-‐1.22
Shelter
as
an
adult
(self
report)
1.43
+
1.22-‐1.66
Applied
for
shelter
in
last
3
mos
1.63
+
1.31-‐2.02
Seeking
to
reintegrate
into
1.29
+
1.06-‐1.59
community
#
Prior
shelter
applica:ons
1.18
+
1.08-‐1.30
25
Results
-‐>
Q3
a
short
screening
Is
it
possible
to
develop
instrument?
• Eliminated
loca:on
and
administra:ve
variables
• Eliminated
racial
categories
• Omimed
variables
that
didn’t
contribute
reliably
to
predic:on
of
shelter
entry
• Examined
hazard
ra:os
to
assign
1-‐3
points
for
each
predictor
• For
con:nuous
variables
like
age,
examined
pamerns
of
shelter
entry
at
different
ages
to
decide
on
cut
points
26
Risk
Assessment
Screener
1
point
– Reports
previous
shelter
as
an
– Pregnancy
adult
– Child
under
2
Age
– No
high
school/GED
– 1
pt:
23
-‐
28;
– Not
currently
employed
– 2
pts:
≤22
– Not
leaseholder
Moves
last
year
– Reintegra:ng
into
community
– 1
pt:
1-‐3
moves;
– 2
pts:
4+
moves
2
points
– Receiving
public
assistance
(PA)
Disrup:ve
experiences
in
childhood
– 1
pt:
1-‐2
experiences;
– Protec:ve
services
– 2
pts:
3+
experiences
– Evicted
or
asked
to
leave
by
landlord
or
leaseholder
Discord
(landlord,
leaseholder,
or
household)
– Applying
for
shelter
in
last
3
months
– 1
pt:
Moderate
(4
–
5.59);
– 2
pts:
Severe
(5.6
–
9)
3
points
27
Conclusions

• The
  short
  screener
  can
  predict
  likelihood
  of

shelter
  entry
  more
  accurately
  than
  subject
  decisions

(a
  26%
  increase
  in
  targe:ng
  accuracy)

• Predic:on
  is
  hard:

  even
  at
  the
  highest
  levels
  of

risk,
  most
  families
  avoid
  shelter.

• Workers
  should
  be
  able
  to
  override
  the

recommenda:on
  of
  the
  model
  with
  wrimen

explana:ons

• Determina:on
  of
  the
  propor:on
  of
  families
  to

serve
  is
  a
  ques:on
  of
  available
  funds
  and
  costs,

both
  to
  the
  homeless
  service
  systems
  and
  to

society.
                                                                    28
Part
  IV.
  The
  Random
  Assignment
  Study


• 295
  families
  were
  enrolled
  in
  Summer
  2010

  and
  followed
  for
  27
  months
  through

  December
  2012


• 150
  were
  in
  the
  treatment
  group
  and
  145
  in

  the
  control

• Abt
  released
  its
  final
  report
  on
  May
  28,
  2013


                                                                             29
Research
Ques-ons
• Confirmatory
– Does
the
Homebase
Community
Preven:on
program
affect
the
rate
of
shelter
use,
as
defined
by
nights
in
shelter
during
the
study’s
follow-‐up
period?
– Do
any
savings
that
result
from
reduced
shelter
costs
offset
the
cost
of
opera:ng
the
program?
• Exploratory
– Are
clients
who
are
offered
access
to
the
program
less
likely
to
spend
at
least
one
night
in
shelter
during
the
follow-‐up
period?
– Are
clients
who
are
offered
access
to
the
program
less
likely
to
apply
for
shelter
during
the
follow-‐up
period?
30
Data
• En:rely
based
on
administra:ve
records
• Baseline—Homebase
Universal
Pre-‐Screen
– Personal
iden:fiers—used
just
for
matching
– Demographic:
household
composi:on,
income,
employment,
benefits;
past
and
current
housing
situa:on;
risk
of
homelessness
• Follow-‐up:
up
to
27
months
(December
2012)
– Shelter
use:
Department
of
Homeless
Services
– Child
Protec:on
Services:
Administra:on
for
Children’s
Services
– Public
Assistance:
Human
Resources
Administra:on
– Employment:
New
York
State
Department
of
Labor
(aggregate)
31
Model
and
Significance
Tests
• Intent
to
Treat
Analysis
• Es:ma:on—Ordinary
Least
Squares
with
robust
standard
errors
• One-‐tailed
test—If
the
program
either
fails
to
reduce
nights
in
shelter
or
actually
increases
it,
the
policy
conclusion
is
that
the
program
is
not
successful
in
mee:ng
its
primary
goal
• .10—Because
there
is
limle
likelihood
that
the
program
will
produce
harm,
the
research
team
risk
greater
chance
of
a
false
posi:ve
to
decrease
risk
of
a
false
nega:ve
32
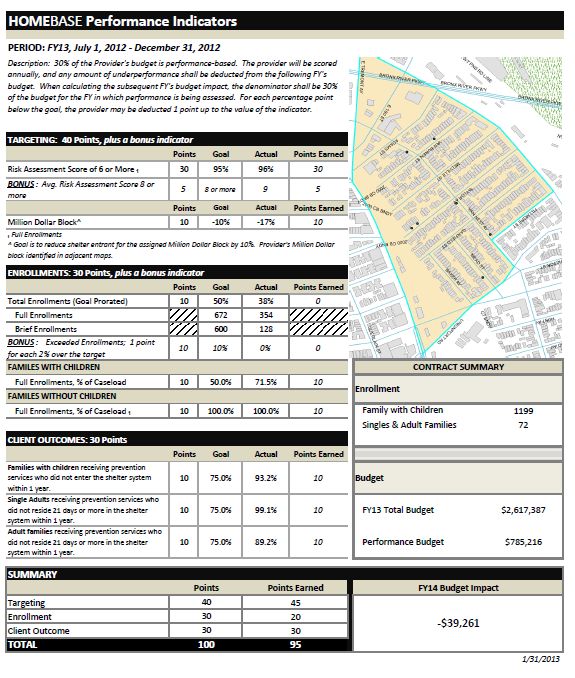
Homebase
  Successfully
  Reduces
  Shelter
  Applicants


                                                 20%

                                                                18.2%
           49%
  Fewer
  Shelter
       Homebase
  cut

                                                                                  Applicants
                    the
  number
  of

Percentage
  of
  Households
  Applying


                                                 16%

                                                                                                                  study
  households

                                                                                                                  who
  applied
  for

                                                 12%

                                                                                                9.3%
            shelter
  in
  half.


                                                  8%


                                                  4%


                                                  0%

                                                           Control
  Group
            Treatment
  Group

                                                                                                                                      33
Homebase
  Significantly
  Reduces
  Average
  Nights
  in

                      Shelter


                                 35
           32.2

                                 30

                                                                  22.6
  (70%)
  Fewer
  Nights

                                 25

   Nights
  in
  Shelter


                                 20


                                 15

                                                                                9.6

                                 10


                                   5


                                   0

                                           Control
  Group
           Treatment
  Group

                                                                                                         34
Homebase
  is
  Cost
  Effec-ve


                Average
  Shelter
  Cost
  Per
  Study
  Household

                                                                                     City
  Funds
  Only

$2,500


                                                                                    $765


                                                                                                             $558


$2,000


$1,500


                                                                               Shelter
  Cost
   Homebase
  Cost

$1,000


                                                                              Every
  dollar
  invested
  in

                                                                              Homebase
  saves
  $1.37

   $500

                                                                 in
  City
  dollars
  spent
  on

                                                                              shelter.

       $0


                        Shelter
  Cost
        Homebase
  Cost

                                      City
     State
  &
  Federal

                                                                                                                            35
Summary

• Homebase
  reduced
  average
  nights
  in
  shelter,

  shelter
  entry
  and
  applica:on
  for
  shelter

• The
  data
  suggest
  it
  did
  so
  by
  a
  combina:on
  of

  reducing
  shelter
  entry
  and
  average
  nights
  in

  shelter
  for
  those
  who
  entered
  or
  would
  have

  entered
  in
  the
  absence
  of
  the
  program

• The
  analysis
  suggests
  that
  the
  savings
  from
  the

  es:mated
  reduc:on
  in
  nights
  in
  shelter
  was

  greater
  than
  the
  es:mated
  cost
  of
  opera:ng

  Community
  Preven:on

                                                                                 36
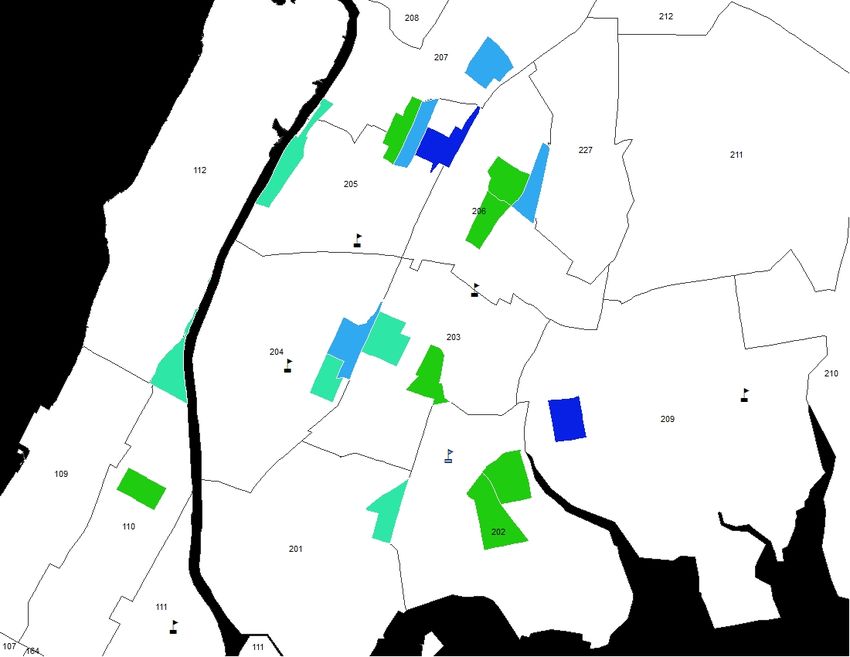
Summary
of
Key
Findings
of
the
Evalua-on
Study
Homelessness
is
concentrated
in
a
small
number
of
communi-es:
nearly
two-‐thirds
of
all
family
shelter
entrants
come
from
15
communi:es
Homebase
affects
the
paeern
of
shelter
usage
in
the
highest
risk
in
the
highest
risk
communi:es
communi-es:
Having
a
Homebase
office
prevents
at
least
10%
of
all
families
served
from
entering
shelter
New,
more
sophis-cated
tools
can
be
used
by
front-‐line
workers
to
target
at-‐risk
families:
a
new
risk
assessment
tool
created
from
years
of
program
data
will
improve
the
targe:ng
of
services
by
26%
There
are
no
families
who
are
too
hard
to
serve:
Homebase
was
most
successful
with
the
highest
need
families
Homebase
is
successful
in
preven-ng
homelessness
and
saving
government
resources.
37
Challenges
  of
  Homelessness
  Preven-on

• If
  preven:on
  were
  perfectly
  targeted
  and

     perfectly
  effec:ve
  (and
  scaled
  to
  serve

     everyone
  at
  risk),
  it
  could
  solve
  homelessness


• Preven:on
  will
  never
  be
  perfectly
  targeted
  or

     perfectly
  effec:ve
  (or
  large
  enough)

• Preven:on
  cannot
  replace
  the
  shelter
  system,

     but
  it
  can
  reduce
  the
  demand
  for
  shelter.
  It
  is

     a
  cri:cal
  component
  of
  the
  homeless
  service

     system.


                                                                               38
What
Can
We
Do?
What
makes
a
household
high
risk
for
shelter
entry
and
can
Homebase
target
services
to
these
high
risk
individuals?
Targe:ng
services
to
prevent
homelessness
is
difficult:
• Numbers
of
shelter
entrants
are
small
and
many
people
with
mul:ple
risk
factors
for
shelter
entry
avoid
shelter
• Preven:on
should
be
aimed
at
those
most
at-‐risk
of
becoming
homeless
39
Individual Risk
Assessment

Neighborhood
Targeting

Enrollment

Client
Outcomes

                  40
 Neighborhood
  TMapping
Neighborhood      arge-ng


                              41
                                              Targe-ng
  Enrollment
  Resources


                                                  Focus vast majority of
                                                  resources on highest risk
                                                  cases, but also create low
                                 1600

                                                  resource, light touch “brief”
                                                  services: workshops,
                                 1400

                                                  housing advice, meaningful
                                                  referrals
                                 1200

Number
  of
  Households


                                 1000


                                  800


                                  600


                                  400


                                  200


                                      0

                                              ARCHNY
     ARCHNY
  II
     BXW
     CAMBA
  I
     CAMBA
  II
     CCNS
             CCNS
  II
     HELP
  I
     HELP
  II
     PALLADIA
     RBSCC

                                                                                                   FULL
  SERVICE
               BRIEF
  SERVICE


                                                                                                                                                                                                                           42
Tying Client Outcomes to Risk Level
                Align incentives to support those who
                take on the higher risk cases that are
                     more likely to become homeless

                                                  43
Next
Steps:
-‐Use
analy:cs
to
create
predic:ve
models
and
real-‐:me
tools
for
neighborhood
outreach
-‐Con:nually
evaluate
and
augment
the
risk
assessment
tool
-‐Con:nue
to
evaluate
Homebase
What tools does Homebase use
service
package
and
iden:fy
best
prac:ces
to target services?
44
           For
  more
  informa-on


• Sara
  Zuiderveen:
  szuiderveen@dhs.nyc.gov


• Zhifen
  Cheng:
  zcheng@dhs.nyc.gov


                                                           45
You can also read