Q4 2018 Company Presentation

Page created by Sandra Osborne
 
CONTINUE READING
Q4 2018 Company Presentation
Q4 2018
Company Presentation
Q4 2018 Company Presentation
Safe Harbor Statement and Disclosure
    This presentation contains forward-looking statements. These statements are made under the "safe harbor" provisions of the U.S. Private
    Securities Litigation Reform Act of 1995. These forward-looking statements can be identified by terminology such as "will," "expects,"
    "anticipates," "future," "intends," "plans," "believes," "estimates," “targets, "confident" and similar statements. Among other things, statements that
    are not historical facts, including statements about 51job’s beliefs, expectations and business outlook in this presentation, as well as 51job’s
    strategic and operational plans, are or contain forward-looking statements. 51job may also make written or oral forward-looking statements in its
    periodic reports to the U.S. Securities and Exchange Commission, in its annual report to shareholders, in press releases and other written
    materials and in oral statements made by its officers, directors or employees to third parties. All forward-looking statements are based upon
    management’s expectations at the time of the statements and involve inherent risks and uncertainties. A number of factors could cause actual
    results to differ materially from those contained in any forward-looking statement, including but not limited to the following: execution of 51job’s
    strategies and business plans; behavioral and operational changes of enterprises in meeting their human resource needs as they respond to
    evolving social, political, regulatory and financial conditions in China; introduction by competitors of new or enhanced products or services; price
    competition in the market for the various human resource services that 51job provides in China; acceptance of new products and services
    developed or introduced by 51job outside of the human resources industry; risks related to acquisitions or investments 51job has made or will
    make in the future; accounting adjustments that may occur during the quarterly or annual close or auditing process; fluctuations in the value of the
    Renminbi against the U.S. dollar and other currencies; and fluctuations in general economic and business conditions in China. Further
    information regarding these and other risks are included in 51job’s filings with the U.S. Securities and Exchange Commission. All information
    provided in this presentation and in the attachments is as of the date of the presentation and based on assumptions that 51job believes to be
    reasonable as of this date, and 51job undertakes no obligation to update any forward-looking statement, except as required under applicable law.

    To supplement the consolidated financial statements presented in accordance with US GAAP, the Company uses non-GAAP financial measures
    to exclude share-based compensation expense, gain/loss from foreign currency translation, convertible senior notes issuance costs, change in
    fair value of convertible senior notes and change in fair value of zero-strike call options, as well as the related tax effect of these items. The
    Company believes excluding these items from its non-GAAP financial measures is useful for its management and investors to assess and
    analyze the Company’s core operating results as these expenses are not directly attributable to the underlying performance of the Company’s
    business operations and may not impact its cash earnings. The Company also believes that excluding these expenses are important in helping
    investors to understand the Company’s current financial performance and future prospects and to compare business trends among different
    reporting periods on a consistent basis. The presentation of these additional measures should not be considered a substitute for or superior to
    GAAP results or as being comparable to results reported or forecasted by other companies.

    The facts and statistics used in this presentation relating to the human resource services industry and economy in China are derived from various
    government and institute research publications. While 51job has taken reasonable care to ensure that these facts and statistics presented are
    accurately reproduced from such sources, 51job has not independently verified them. These facts and statistics may not be comparable to similar
    facts and statistics collected for the industry or economy in the United States and other countries.

1
Q4 2018 Company Presentation
Leading HR Services Provider in China

    One-Stop Shop for Employers’ Human Resource Needs

    Leader in Online and HR Services Segments

    Large National Footprint

    Diversified Customer Base in a Focused Vertical

2
Q4 2018 Company Presentation
Comprehensive Product Offering

                        2018
    Business Lines                 Products                          Description
                     Revenue Mix

                                   Flagship offerings:               • Leading technology platforms for
                                   • 51job.com (age 20s-30s)           entire white collar hiring range from
                                                                       college graduates to experienced
                                   • eHire (employer platform)
    Online                                                             professionals
    Recruitment              64%                                     • Job seekers can maintain an account
                                   Additional channels:
    Services                                                           and apply to jobs for free
                                   • Yingjiesheng.com (college)
                                                                     • Employers/recruiters post job ads for
                                   • 51jingying.com (experienced       a fee
                                     workers)
                                                                     • Search large database of resumes to
                                   • Lagou.com (technology talent)     identify passive candidates

                                   • Business process                • Broad portfolio of “one-stop”
                                     outsourcing                       solutions to meet wide range of HR
    Other Human                                                        needs
                                   • Training & assessment
    Resource           36%                                           • Integrated online/offline strategy to
                                   • Campus recruitment
    Related                                                            deliver complete, high quality
                                   • Executive search
    Services                                                           services
                                   • HR conferences
                                                                     • Shared sales force and resources to
                                   • Compensation analysis             drive overall scale efficiency and
                                                                       higher productivity

3
Unique Integrated Services Model

    Employment Lifecycle   Products & Services     Tangible Results
             Identifying

                                                  Vast Candidate Pool
                                                 High Quality Resumes
             Attracting

                           Online      Mobile
                                                  Superior Customer
                                                       Service
             Developing
             Retaining

                                                 End-to-End Solutions

4
Key Investment Highlights

    Economic Growth and Secular Trends Underpinning HR Market Development

    Premier HR Brand and Online Leader

    Large Direct Sales Force with Nationwide Footprint

    Consistent Profitability and Healthy Margins

    Highly Experienced Management Team with a Proven Track Record

5
China’s Economic Growth and Development

                Economic Growth Comparison                                                        Registered Businesses in China
     Recent Selected Economic and Demographic Data                                      (in MM)
                                                                                                                                              93.1
                                                                                                                                   85.4
                                              U.S.               China                                                  73.2
                                                                                                          65.3
                                                                                             56.9
      GDP (US$B)                             20,500               13,100
      GDP Growth                               2.9%                 6.6%                                           52%
      2013-2018 Avg Growth                     2.3%                 7.0%

      Population (MM)                           327                1,420                     2013         2014         2015        2016       2017
      Urban                                      82%                 56%                          Individual businesses             Private enterprises

       Increasing Contribution of Services Sector                                                   College Graduates in China
       (as % of total China GDP)                                                        (in MM)
                                                                   52%                                                             8.2         8.3
                                                                                                                          8.0
                                                                                              7.5          7.7
                                                      43%
                          40%          41%
            33%

            1995         2000          2005           2010        2018                       2015         2016         2017        2018      2019E

    Source: United States – U.S. Census, BEA
            China – National Bureau of Statistics, PRC State Administration for Industry and Commerce, PRC Ministry of Education
6
Leadership in Online Segment

                                            Growth of Internet Usage in China

                                                          2013   2014        2015     2016    2017   2018

                   Internet Users (MM)                    618    649          688     731      772    829
                        Internet Penetration %            46%    48%          50%     53%      56%    60%
                   Mobile Internet Users (MM)             500    557          620     695      753    817
                     % of Internet Users                  81%    86%          90%     95%      97%    99%
                     Source: CNNIC

      Registered User Accounts at 51job.com                              Job Seeker Resumes at 51job.com
     (in MM, year end as of Dec 31)                                (in MM, year end as of Dec 31)

                                                        138                                                        127
                                                 123                                                        114
                                          109                                                        103
                                     96                                                        90
                          84                                                            75
                73                                                              64
       64
                                                                        54

      2012     2013      2014    2015     2016   2017   2018           2012    2013    2014   2015   2016   2017   2018
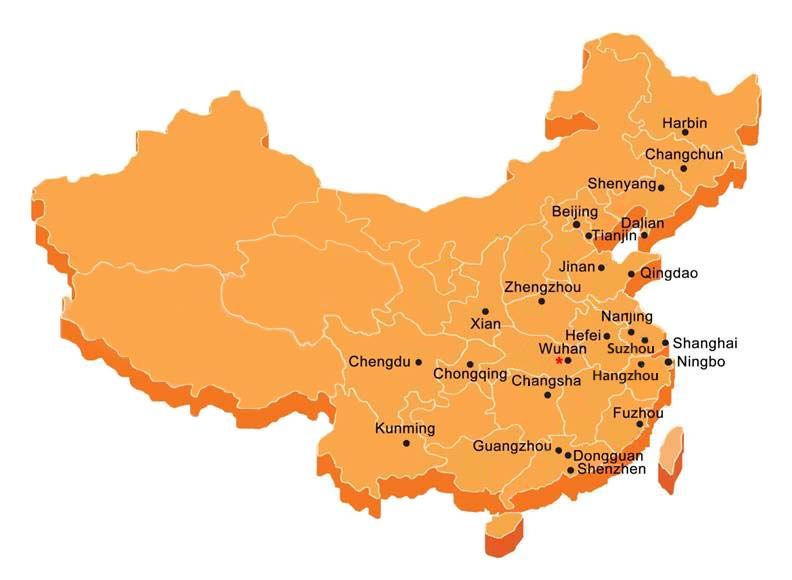
7
National Coverage with Large Direct Sales Force

                                         ~4,200*
                                    Direct Sales Force
                                        Covering
                                        196 Cities

                  25 Sales Offices
                ★     Wuhan Call Center

    * Excludes employees of Lagou.com

8
Consistent Profitability and Healthy Margins

                                                           Profit and Margin Performance
         (RMB MM, Margin Calculated as % of Net Revenues)

                                                                                                                                        2,701

                                                                                                                        2,085
                                                                                                                                                72% Gross
                                                                                                         1,675                                      Margin
                                                                                         1,485
                                                                         1,336
                                                                                                                                             1,255
                                                         1,166
                                         1,042
                          929                                                                                                 957
          686                                                                                 654             698
                                               536             554             605
                               479                                                                                                              34% Operating
               296                                                                                                                                  Margin (1)

            2010            2011            2012            2013           2014            2015            2016            2017            2018

                                            Gross Profit                                          Operating Income (1)

    (1) Excludes share-based compensation expense. Transition from business tax to value-added tax on online revenues starting June 1, 2014 and on other HR services
        revenues starting May 1, 2016 unfavorably affected revenue recognition and margin comparability to prior periods.

9
Highly Experienced Management Team

                    •   Rick Yan, Chief Executive Officer & Co-Founder
                    •   Tenure: 19 years
                    •   Director and Head of China Practice, Bain & Company (11 years)
                    •   2 HBR articles on China, speaker at many business conferences
                    •   MBA Distinction, INSEAD, B.Sc and M.Phil, Hong Kong University

          Kathleen Chien               Jingwu Chen                Tao Wang
         COO & Acting CFO,              Senior VP               Vice President
            Co-Founder               Tenure: 19 years          Tenure: 19 years
          Tenure: 20 years

10
World Class Board of Directors
                         • Co-founder and General Partner of DCM (venture capital firm) in the
        David Chao         Silicon Valley
        Chairman of
        the Board        • Previously worked at McKinsey & Company, Apple and Recruit

         Junichi Arai    • Corporate executive officer of Recruit Holdings Co., Ltd.
         Non-executive   • Responsible for Recruit’s capital market strategies in the finance
         director          department and corporate planning department

        Li-Lan Cheng     • Executive Director and COO of E-House (China) Enterprise Holdings
        Independent        Limited
        Director         • Acting CFO of Leju Holdings Limited

         Eric He         • Former CFO of YY Inc. and Giant Interactive Group Inc.
         Independent     • Director of Bilibili Inc.
         Director

         Rick Yan        • Prior experience: Director and the Head of China Practice at Bain &
         Director and      Company for 11 years
         CEO

11
Financial Highlights
Historical Revenue Performance and Contribution
      Revenue Growth Despite Economic Uncertainty, Business Transition and Regulatory Change
          Total Revenues (RMB MM)
                                                                                                                         3,782
                                                                                                                 2,881
                                                                                                         2,373
                                                                                  1,677 1,897 2,102
                                                                      1,370 1,512
                                                860           1,090
                            698      844               817
          480      596

          2004     2005    2006     2007        2008   2009   2010    2011   2012   2013   2014   2015   2016    2017    2018

                  Strategic Focus on High Potential Online and Other HR Services Businesses

          (Calculated as % of Total Revenues)

 80%
                                                                                                                                Online
 60%

 40%
                                                                                                                                Other HR
 20%

     0%                                                                                                                          Print
           2004     2005    2006     2007       2008   2009   2010    2011   2012   2013   2014   2015   2016    2017    2018

12
Capturing Attractive Online Opportunity
                                                   Unique Employers Using Online Services (1)
         (in 000s)
                                                                                                                                                   519
                                                                                                                                        461                 485
                                                                                                                    388       407
                                                                                                         334
                                                                                    244        272
                                                                          214
                                                                143
                                 75         94       103
            39         57

           2004      2005       2006      2007      2008       2009      2010       2011      2012      2013       2014      2015       2016      2017      2018

                                                   Online Recruitment Services Revenues (2)
        (RMB MM)
                                                                                                                                                            2,432

                                                                                                                                                  1,872
                                                                                                                                       1,547
                                                                                                                   1,248 1,356
                                                                                                        1,084
                                                                                               943
                                                                                     803
                                                                          543
                                 220       283       312        333
            112       159

           2004      2005       2006      2007      2008       2009      2010       2011      2012       2013      2014      2015       2016      2017      2018

     (1) An employer who purchases online services multiple times or in multiple quarters is only counted as ONE unique employer for the annual figure.
     (2) Transition to 6% value-added tax on online revenues starting June 1, 2014 unfavorably affected growth and margin comparability to prior periods.
13
Balancing Investments and Returns for Long-Term Growth
                  Sales and Marketing Expenses (1)                                                        Employee Productivity (2)
 (RMB MM, Margin Calculated as % of Net Revenues)                                        Total Revenues/Total Employees as of Dec 31 (RMB 000s)
                                                                          1,183                                                                             452
                                                              906
                                                 771                                                                                           377
                                      643
                        552                                                                             310          320          322
       451                                       33%                                        305
                                     31%                      32%         32%
                    30%
       28%

       2013         2014             2015       2016         2017         2018             2013         2014         2015        2016         2017         2018

                   Quarterly Unique Employers (3)                                                          Quarterly Online ARPU
 (in 000s)                                                                               (in RMB)

                  375               381 378           381                 371
            362                                             365                                                                                             1,881
                                                334                 337         343                                                      1,777
                              322
      302                                                                                                            1,557
                                                                                                  1,461                                               1,401
                                                                                                                                    1,282
                                                                                            1,162              1,166

            1Q                    2Q                  3Q                  4Q                   1Q                2Q                   3Q                 4Q
                              2016            2017           2018                                             2016           2017           2018
     (1) Excludes share-based compensation expense. Transition from business tax to value-added tax on online revenues starting June 1, 2014 and on other HR services
         starting May 1, 2016 unfavorably affected revenue recognition and margin comparability to prior periods.
     (2) Includes approximately 480 employees of Lagou.com in 2018.
     (3) An employer who purchases online services multiple times or in multiple quarters is only counted as ONE unique employer for the annual figure.
14
Profitable Growth and Strong Cash Flow Generation
                                                             Long History of Profitability (1)
               Non-GAAP Net Income Attributable to 51job (RMB MM)
                                                                                                                                                        1,371
                                                                                                                                               950
                                                                                                                 638       693       721
                                                                                             520       572
                                                                                   449
                                                                         265
              68          87     137       151       122       140

             2004     2005       2006     2007      2008      2009      2010      2011      2012      2013      2014      2015      2016       2017      2018

                    Cash Flow From Operations                                                         Strong Cash Position for M&A (2)
     (RMB MM)                                                                               (RMB MM)

                                                                        1,442                                                                                   8,834
                                                             1,087                                                                                    7,132
                                                                                                                                            6,080
                                                   864
                               747      756                                                                              4,495 4,951
       497         575                                                                                         3,148
                                                                                           2,054 2,531

      2011         2012        2013     2014       2015       2016       2017              2011      2012      2013      2014      2015      2016      2017     2018

     (1) Excludes share-based compensation expense, gain/loss from foreign currency translation and mark-to-market change in fair value of convertible senior notes in
         addition to convertible senior notes issuance costs and change in fair value of zero-strike call options specific to 2014.
     (2) Includes cash and short-term investments, which primarily consist of time deposits with original maturities between three months and one year.

15
Growth Initiatives
Key Growth Initiatives

           Increase customer         New product
              wallet share          development to
           through up-selling        widen service
            and cross-selling           scope

            Selectively pursue    Expand sales force to
          strategic investments   deepen coverage and
             and acquisitions      selectively acquire
                                     new employers

16
You can also read