H1 2021 RESULTS JAN JENISCH | CEO - JULY 30, 2021 - Analyst presentation
←
→
Page content transcription
If your browser does not render page correctly, please read the page content below

H1 2021
RESULTS
JAN JENISCH | CEO   GÉRALDINE PICAUD | CFO
JULY 30, 2021
Torre Unipol, Milan - Italy

01.
HIGHLIGHTS
AND KEY
DEVELOPMENTS
JAN JENISCH | CHIEF EXECUTIVE OFFICER

H1 2021 KEY DEVELOPMENTS
PROFITABLE GROWTH CONTINUES, RECORD RESULTS

                                                            Future growth fueled with 7   bolt-on
    Growth momentum continues,                              acquisitions

    Net Sales up   16.6% LFL                                Successful start of   Firestone Building
                                                            Products
    Significant margin increase in all regions & segments   At the forefront of
    Recurring EBIT up   72.2% LFL                           innovative and sustainable
    Strong over-proportional growth                         building solutions

                                                            Growth trends expected to continue in 2021
    Record Cash generation, robust balance sheet
    Free Cash Flow of   CHF 814 m, +9%                      Guidance upgraded
                                                            FY 2021 recurring EBIT growth of at least   18% LFL

3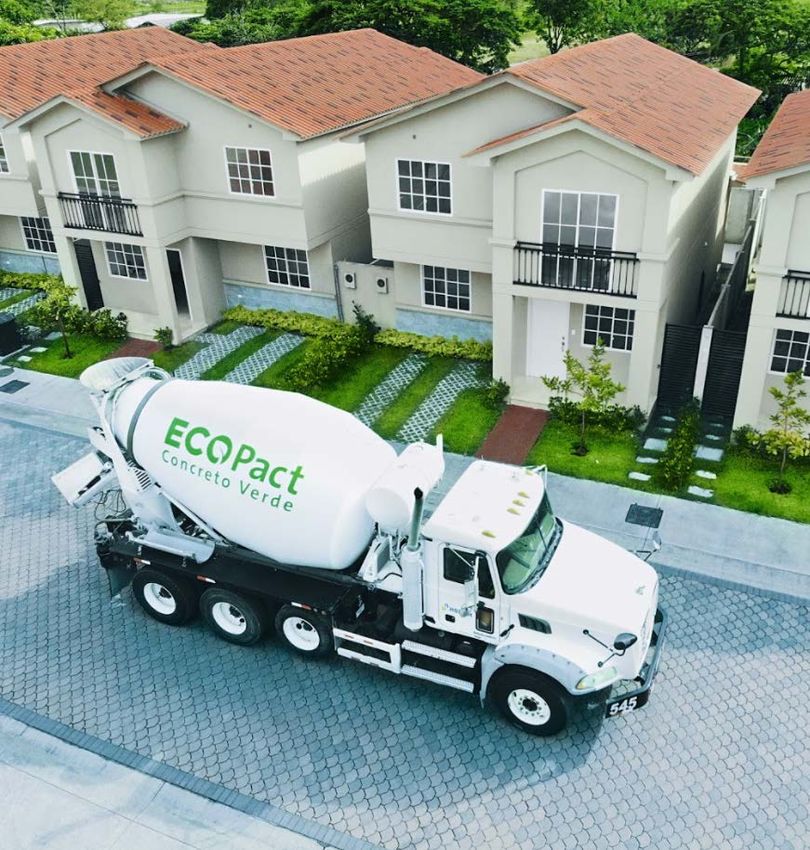
H1 2021 KEY PERFORMANCE
PROFITABLE GROWTH CONTINUES, RECORD RESULTS

     NET                                              RECURRING
     SALES                                            EBIT
                                                                                       +131%
                                                                                               +56%

                                              +26%

                                                                                +14%
                                                                       +10%
                                      +7%
                               +1%

       -3%             -3%                              -3%

               -17%

                                                                -26%

      Q1 20   Q2 20   Q3 20   Q4 20   Q1 21   Q2 21    Q1 20   Q2 20   Q3 20   Q4 20   Q1 21    Q2 21

              % LFL

4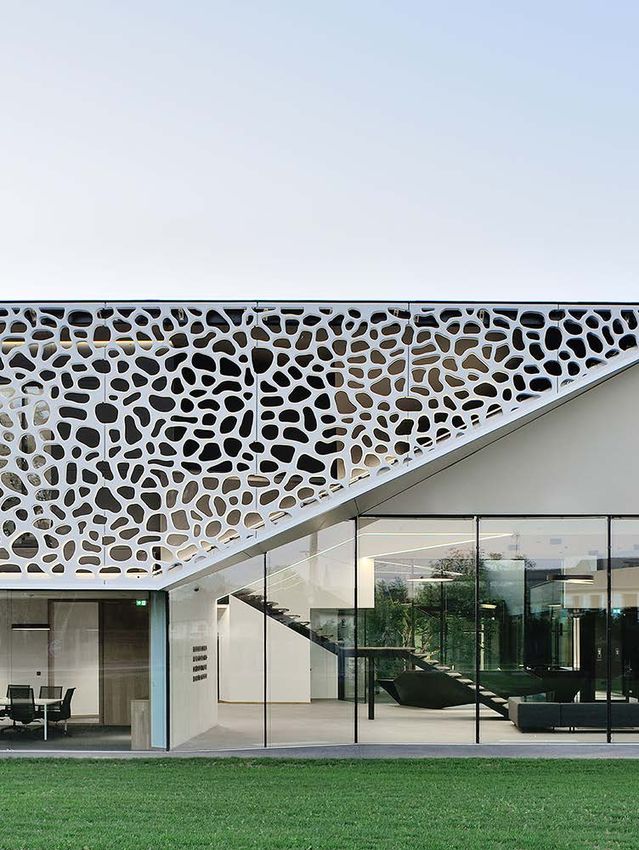
FIRESTONE BUILDING PRODUCTS
A SUCCESSFUL START AS OF APRIL 1ST, 2021

         Strong market                                                       Expansion in                                                      Industry leader in
         DEMAND                                                              LATAM                                                             INNOVATION
         Growth in all product lines and                                     Holcim GacoFlex TechoProtec                                       Environmental and energy
         all regions                                                         launched in Mexico                                                efficient solutions
         Volumes up 21% in Q2

     Thammasat University Rooftop Farm, Thailand                        GacoFlex “TechoProtec” liquid applied waterproofing and roofing   New FullForce highly reflective, self-adhering membrane
     Asia’s largest rooftop farm with UltraPly TPO covering 20’000 m2   solutions for residential and commercial applications
     green roof

5
BOLT-ON ACQUISITIONS AND ASSET DIVESTMENTS
FUTURE GROWTH FUELED WITH 7 BOLT-ON ACQUISITIONS

                                                                                           Xtree
                                                                                         France
                                                                               20% stake in large
                                                                                scale 3D printing

                Beton Mobile /
             Canada / Montreal
                         RMX                                                              Buhler
                                                                                     Switzerland
                                                                                            AGG

                          Cemex
                    France / Lyon
                      AGG / RMX                                                             Edile
                                                                                   Commerciale
                                                                                    Italy / Milan
                                                                                            RMX

                   Heinrich Teufel
                         Germany
                       AGG / RMX                                               HALYPS Domika
                                                                                       Ylika SA
                                                                                Greece / Athens
                                                                                    AGG / RMX
    Acquisitions                          Lafarge Zambia &     LafargeHolcim
                                     Lafarge Cement Malawi      Indian Ocean
    Disposals                                        CEM     CEM / AGG / RMX

6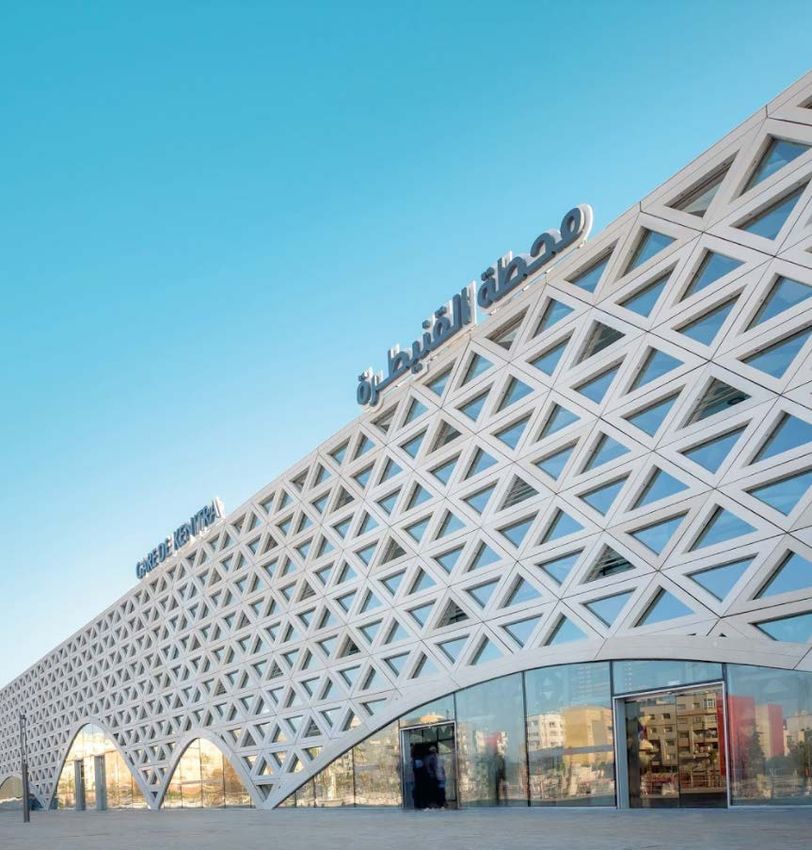
AT THE FOREFRONT OF INNOVATIVE AND SUSTAINABLE BUILDING SOLUTIONS
FURTHER STRENGTHENING OUR LEADERSHIP

    Holcim achieves                      3D printing, a new language for            ECOPact now available in
    Highest rating of A1+                concrete that is digital and               24 markets, across all five regions just
                                         environmental, from complex                one year since global launch
    Top 2% ranking worldwide             infrastructure to affordable housing
                                                                                    Holcim to offer ECOPact Zero in all
    Best Energy Transition               Striatus in Venice, 3D printed school in   countries by 2030
    score within the industry by Vigeo   Malawi, wind turbine tower with GE

    5 CCUS advanced pilot                Holcim deploys its industry-leading        Holcim launches
    projects in Europe and North         Transport Analytics                        ECOPlanet, the first
    America
                                         Center (TAC) to optimize its               global range of green cement
    Westküste 100 in Germany, CO2MENT
                                         logistics for enhanced efficiency,
    project in Canada & the US,                                                     Offers at least 30% lower carbon
                                         safety and sustainability
    Carbon2Product in Austria,                                                      footprint with no compromise on
    ECCO2 in Spain                                                                  performance

7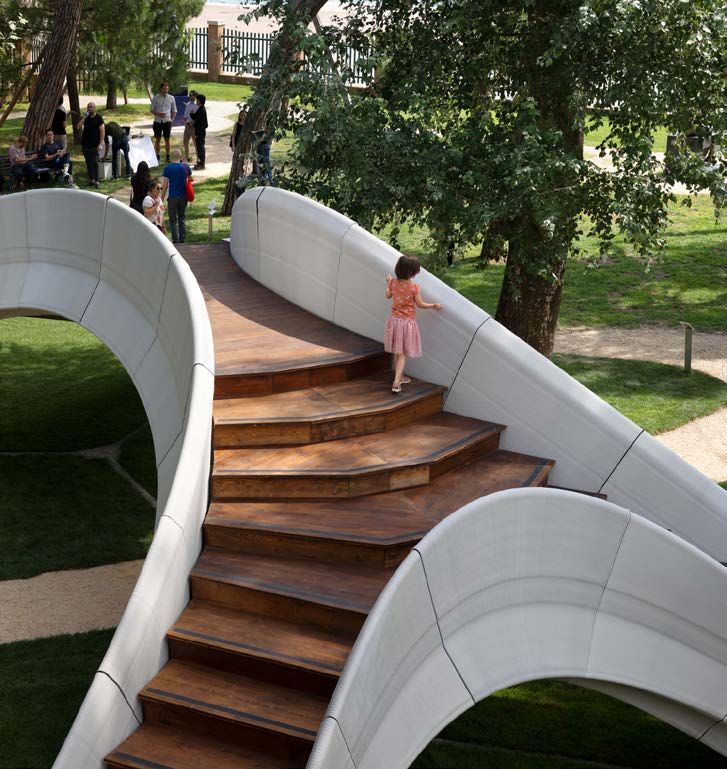
AT THE FOREFRONT OF INNOVATIVE AND SUSTAINABLE BUILDING SOLUTIONS
GLOBAL ROLL OUT OF ECOPACT ACCELERATING

    THE GREEN CONCRETE

                                                                                                     Picture
                                                                                                     Placeholder

          North America           Europe                 Middle East Africa        Latin America          Asia Pacific

    2020                  2020                        2021                    2020                  2021
    US | CANADA           SWITZERLAND |               QATAR | JORDAN          COLOMBIA | MEXICO |   INDIA | AUSTRALIA
                          GERMANY | FRANCE | UK                               ECUADOR

                          2021                                                2021
                          BELGIUM | ROMANIA |                                 EL SALVADOR |
                          SPAIN | ITALY | POLAND                              ARGENTINA | BRAZIL
                          GREECE | SERBIA | AUSTRIA

8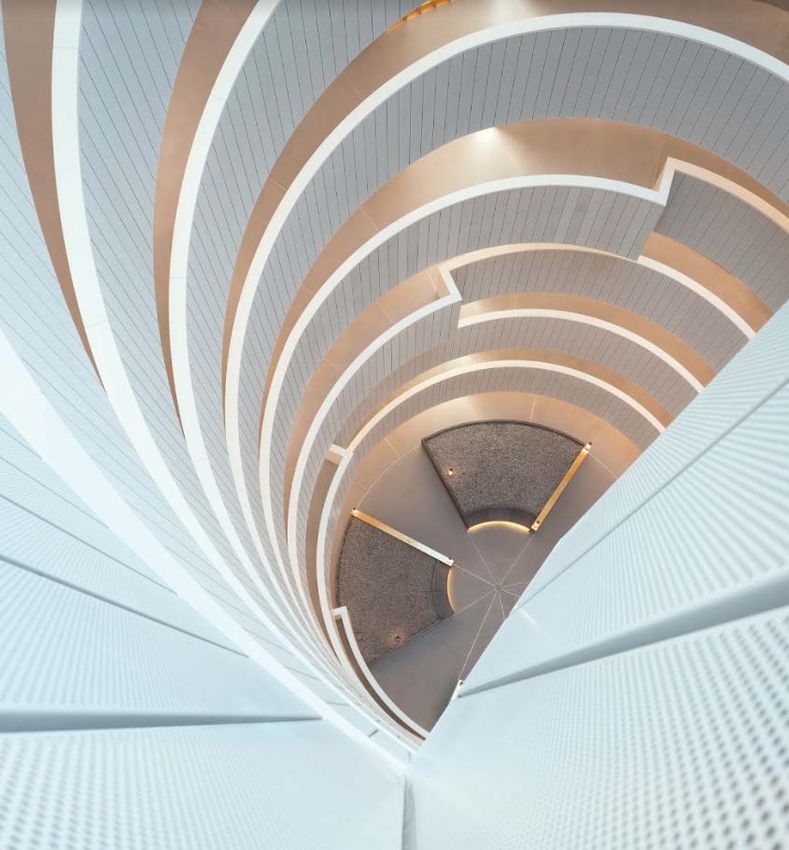
H1 2021                                        Yuhang Opera, Hangzhou - China

02.
FINANCIAL
HIGHLIGHTS
GÉRALDINEPICAUD
GÉRALDINE PICAUD| CHIEF
                  | CHIEF FINANCIAL
                        FINANCIAL    OFFICER
                                  OFFICER
H1 2021 PERFORMANCE HIGHLIGHTS
RECORD RECURRING EBIT, EPS AND FREE CASH FLOW GROWTH IN H1

      NET                      RECURRING                                                EPS2                              FREE CASH
      SALES                    EBIT                                                                                       FLOW3
                                                                                                  CHF                        CHF
                      1                                         1
     +16.6%
     +4.9% VS H1 2019
                          +72.2%
                          +35.5% VS H1 2019
                                                                                            1.43
                                                                                         PER SHARE
                                                                                                                          814 M
      CHF 12’556 M             CHF 1’983 M                                                       +78%                        +9%

          Q2 2021                      Q2 2021

        +25.5%1                    +55.8%1
        CHF 7’194 M                CHF 1’455 M

                           1   Variance on a like for like basis | 2 Before impairment and divestments | 3 After leases
10
H1 2021 VOLUMES DEVELOPMENT
VOLUMES GROWTH IN ALL REGIONS
+9%
LFL
-1%
+6% M ton
GROUP
+18% M m3
vs 2020
+2% 22.2 56.1 9.9
+3%
CEM AGG RMX
+6% 9.1 45.2 4.7
+13%
Europe +28%
CEM AGG RMX
North America
+12%
+43% +8% +12%
+14% 17.8 2.0 1.4 +9%
CEM AGG RMX
35.8 16.9 3.9
Middle East CEM AGG RMX
99.0 123.0 22.1
+28% Africa
CEM 1 AGG RMX Asia Pacific
+34% +39%
1 Includes volumes from trading activities 13.3 2.9 2.3
CEM AGG RMX
Latin America
11H1 2021 NET SALES BRIDGE
STRONG INCREASE IN NET SALES
+16.6%
LFL
-468 12’556
+1’770
10’693 +561
H1 2020 Scope LFL FX H1 2021
+17.4%
CHF M
12H1 2021 RECURRING EBIT BRIDGE
RECORD RECURRING EBIT, INCREASE OF 72.2% LFL
+72.2%
LFL
+24 -3
-134 1’983
+255
+586
+61
1’194
H1 2020 Scope Volume Price over cost JVs contribution Depreciation FX H1 2021
+66.1%
CHF M
13H1 2021 NET SALES AND RECURRING EBIT BY SEGMENT
SIGNIFICANT MARGIN IMPROVEMENT IN ALL BUSINESS SEGMENTS
CEMENT AGGREGATES RMX SOLUTIONS &
PRODUCTS 1
CHF M
7’932 1’864 2’462 1’423
Net Sales +20.3% LFL +7.2% LFL +14.3% LFL +8.7% LFL
Recurring EBITDA 2’343 357 108 121
after leases +36.1% LFL +42.1% LFL +414.3% LFL +32.5% LFL
1’654 217 40 72
Recurring EBIT CHF +655 m LFL CHF +108 m LFL CHF +87 m LFL CHF +15 m LFL
+57.5% LFL +107.0% LFL +183.9% LFL n.m.
1 Including Firestone Building Products
14SOLUTIONS AND PRODUCTS BUSINESS UNIT
SIGNIFICANT STEP ACHIEVED WITH NEW ROOFING SYSTEMS PLATFORM
Roofing systems Q2 2021 Net Sales
Solutions and Products
Net Sales of
CHF 499 m in Q2 Other regions
Volumes up
9%
21% in Q2
30%
•
61%
Concrete Products, Asphalt, Europe
Contracting & Services
Net Sales of
North America
CHF 560 m in Q2,
+19% LFL
15H1 2021 REGIONAL PERFORMANCE
SIGNIFICANT MARGIN IMPROVEMENT IN ALL REGIONS
+14.2%
+1.4% +25.9%
+3,6%
+15.1%
+48.8%
+31.7% +78.7% +58.5% +76.7% +65.8%
2’984 380 1’269 425 3’886 469 1’162 198 2’998 713
North America Latin America Europe Middle East Africa Asia Pacific
+2.5pp +5.3pp +3.3pp +4.8pp +5.7pp
NET SALES RECURRING EBIT % LFL
Rec EBIT margin growth
to external customers (CHF m) (CHF m) Growth / Decline
16NORTH AMERICA
GOOD MOMENTUM AND STRONG OPERATING LEVERAGE
Green city, New York - USA
Q2 2021 H1 2021
CHF M
Net Sales1 2’071 2’984
+6.6% LFL +1.4% LFL
Recurring EBIT 433 380
+18.3% LFL +31.7% LFL
1 Net Sales to external customers
→ Strong market demand in the US, good recovery in
Canada West
→ Demand growth in Canada East supported by key
projects in Montreal and Toronto
→ Volumes growth in all business segments in Q2,
positive pricing
→ Continued strong operating leverage
17LATIN AMERICA
ANOTHER QUARTER OF OUTSTANDING PERFORMANCE
Q2 2021 H1 2021
CHF M
Net Sales1 655 1’269
+72.5% LFL +48.8% LFL
Recurring EBIT 202 425
+92.1% LFL +78.7% LFL
1 Net Sales to external customers
→ Outstanding volumes growth in all business
segments
→ New grinding station started in Merida, Mexico, to
capture the market growth
→ Strong recurring EBIT margin improvement
→ Expansion of Firestone business in Latin America
Affordable housing project - Ecuador
18EUROPE
GOOD MOMENTUM CONTINUES
Extension of Kunsthaus Zürich - Switzerland
Q2 2021 H1 2021
CHF M
Net Sales1 2’243 3’886
+24.0% LFL +14.2% LFL
Recurring EBIT 412 469
+53.9% LFL +58.5% LFL
1 Net Sales to external customers
→ Strong recovery in the UK, solid demand in France,
continuous growth in Eastern European markets
→ Robust market demand across all business segments
→ Significant over-proportional recurring EBIT growth
→ Plant modernization of Martres, France, on track
19MIDDLE EAST AFRICA
STRONG PERFORMANCE
Kenitra Train station - Morocco
Q2 2021 H1 2021
CHF M
Net Sales1 599 1’162
+27.3% LFL +15.1% LFL
Recurring EBIT2 111 198
+110.2% LFL +76.7% LFL
1 Net Sales to external customers
2 Contribution from share of net income from JVs: CHF 35 m in H1 2021 vs. CHF 18 m in H1 2020
→ Strong volumes growth across all business
segments
→ Strong market demand in Nigeria and Iraq
→ Kenya benefitting from infrastructure spending,
recovery in East Africa
→ Record recurring EBIT margin improvement
20ASIA PACIFIC
REGION WITH THE HIGHEST MARGIN EXPANSION IN H1
Chengdu Yintai Center - China
Q2 2021 H1 2021
CHF M
Net Sales1 1’490 2’998
+36.8% LFL +25.9% LFL
Recurring EBIT2 410 713
+53.1% LFL +65.8% LFL
1 Net Sales to external customers
2 Contribution from share of net income from JVs: CHF 167 m in H1 2021 vs. CHF 160 m in H1 2020
→ Robust volume growth in the region
→ Good performance in Australia, benefitting from
stimulus programs
→ Outstanding margin improvement in India despite
2nd Covid-19 wave and inflationary pressure
→ Marwar Mundwa cement capacity expansion in
India to commence operations in Q3 2021
21H1 2021 FINANCIAL PERFORMANCE
RECORD EPS INCREASE OF 78%
CHF M H1 2020 H1 2021
Before impairment & Before impairment & Change
divestments divestments
Net Sales 10’693 12’556 1’863
RECURRING EBITDA after leases 2’152 2’928 777 +36%
Depreciation & amortization -958 -945 12
RECURRING EBIT 1’194 1’983 789 +66%
Restructuring, litigation and others -39 -175 -137
OPERATING PROFIT (EBIT) 1’156 1’808 652
Profit/loss on disposals and other non-operating items -32 -11 21
Share of profit of associates 4 -19 -23
Net financial expenses -316 -272 45
NET INCOME BEFORE TAXES 812 1’506 694
Income taxes -212 -391 -179
Effective Tax Rate 26.0% 26.0%
NET INCOME 601 1’114 513
Net Income, Non-controlling interests 100 233 133
NET INCOME GROUP SHARE 501 881 380
EPS (CHF per share) 0.80 1.43 0.63 +78%
22H1 2021 FREE CASH FLOW1
RECORD FREE CASH FLOW OF CHF 814 M
CHF M
H1 2020 H1 2021 Change
RECURRING EBITDA after leases 2’152 2’928 777
Right of use assets 184 176 -8
Change in net working capital -314 -879 -565
Income taxes paid -254 -328 -75
Net financial expenses paid & FX -264 -217 46
Share of profit of JVs, net of dividends received -138 -51 87
Others incl. employee benefits -36 -172 -135
CASH FLOW FROM OPERATING ACTIVITIES 1’330 1’457 127
CAPEX net -412 -468 -56
Repayment of long-term lease liabilities -169 -176 -7
FREE CASH FLOW after leases 749 814 65 +9%
1 After leases
23NET FINANCIAL DEBT BRIDGE
STRONG FREE CASH FLOW SUPPORTING FIRESTONE ACQUISITION
CHF M
+136 12’438
+307
+1’222
10’652
-2’501 +3’436
-814
NFD 1 FCF 2 FCF 2 Disposals / Group Non-controlling Others NFD 1
June 2020 H2 2020 H1 2021 acquisitions shareholders interests June 2021
1 Excluding hybrid bond Dividends
2 After leases
24H1 2021
03.
OUTLOOK AND
GUIDANCE 2021
JAN JENISCH | CHIEF EXECUTIVE OFFICER
JAN JENISCH | CHIEF EXECUTIVE OFFICER
JAN JENISCH | CHIEF EXECUTIVE OFFICER
Cepovett head office – France - Architect: Agence AUM Pierre Minassian / Photo: ©Studio Erick SailletOUTLOOK AND TARGETS 2021
GROWTH TRENDS TO CONTINUE IN 2021, GUIDANCE UPGRADED
Growth momentum continues in all regions,
supported as of H2 2021 by various stimulus programs
Unleash Firestone growth platform, continue
acceleration of bolt-on acquisitions
Accelerated progress towards 2030 sustainability
targets
Over-proportional growth in recurring EBIT of
at least 18% LFL (from at least 10% LFL previously)
Capex less than CHF 1.4 bn
ROIC of above 8%
Strategy 2022 targets to be achieved one year
Striatus 3D concrete printed bridge, Venice - Italy in advance
26STRATEGY 2022
TARGETS TO BE ACHIEVED ONE YEAR IN ADVANCE
STRATEGY 2022 2021 OUTLOOK
NET 3%-5% LFL
SALES P.A.
RECURRING AT LEAST 7%
EBIT LFL P.A.
CASH
CONVERSION > 40%
ROIC > 8%
LEVERAGE BELOW 2x
27UPCOMING EVENTS
OCTOBER 29, 2021 Q3 2021 Trading Update
NOVEMBER 18, 2021 Capital Markets Day
FEBRUARY 25, 2022 Full-Year 2021 Results
APRIL 22, 2022 Q1 2022 Trading Update
28DISCLAIMER
These materials are being provided to you on a confidential basis, may not be distributed to the press or to any other persons, may not be redistributed or passed on, directly or indirectly, to
any person, or published or reproduced, in whole or in part, by any medium or for any purpose.
This document does not constitute or form part of any offer or invitation to sell or issue, or any solicitation of any offer to purchase or subscribe for, any securities of Holcim or any subsidiary
or affiliate of Holcim nor should it or any part of it form the basis of, or be relied on in connection with, any purchase, sale or subscription for any securities of Holcim or any subsidiary or
affiliate of Holcim or be relied on in connection with any contract or commitment whatsoever.
The information contained herein has been obtained from sources believed by Holcim to be reliable. Whilst all reasonable care has been taken to ensure that the facts stated herein are
accurate and that the opinions and expectations contained herein are fair and reasonable, it has not been independently verified and no representation or warranty, expressed or implied, is
made by Holcim or any subsidiary or affiliate of Holcim with respect to the fairness, completeness, correctness, reasonableness or accuracy of any information and opinions contained herein.
In particular, certain of the financial information contained herein has been derived from sources such as accounts maintained by management of Holcim in the ordinary course of business,
which have not been independently verified or audited and may differ from the results of operations presented in the historical audited financial statements of Holcim and its subsidiaries.
Neither Holcim nor any of its respective affiliates, advisers or representatives shall have any liability whatsoever (in negligence or otherwise) for any loss or damage howsoever arising from
any use of this presentation or its contents, or any action taken by you or any of your officers, employees, agents or associates on the basis of the this presentation or its contents or otherwise
arising in connection therewith.
The information contained in this presentation has not been subject to any independent audit or review and may contain forward-looking statements, estimates and projections. Statements
herein, other than statements of historical fact, regarding future events or prospects, are forward-looking statements, including forward-looking statements regarding the group’s business and
earnings performance, which are based on management’s current plans, estimates, forecasts and expectations. These statements are subject to a number of assumptions and entail known
and unknown risks and uncertainties, as there are a variety of factors that may cause actual results and developments to differ materially from any future results and developments expressed
or implied by such forward-looking statements. Forward-looking statements contained in this presentation regarding past trends or activities should not be taken as a representation that such
trends or activities will continue in the future. Although Holcim believes that the estimates and projections reflected in the forward-looking statements are reasonable, they may prove
materially incorrect, and actual results may materially differ. As a result, you should not rely on these forward-looking statements. Holcim undertakes no obligation to update or revise any
forward-looking statements in the future or to adjust them in line with future events or developments, except to the extent required by law.
29You can also read