Investor Presentation | HY 2019 - B&S Group

Page created by Nathan Herrera
 
CONTINUE READING
Investor Presentation | HY 2019 - B&S Group
Investor Presentation | HY 2019

                                  1
Investor Presentation | HY 2019 - B&S Group
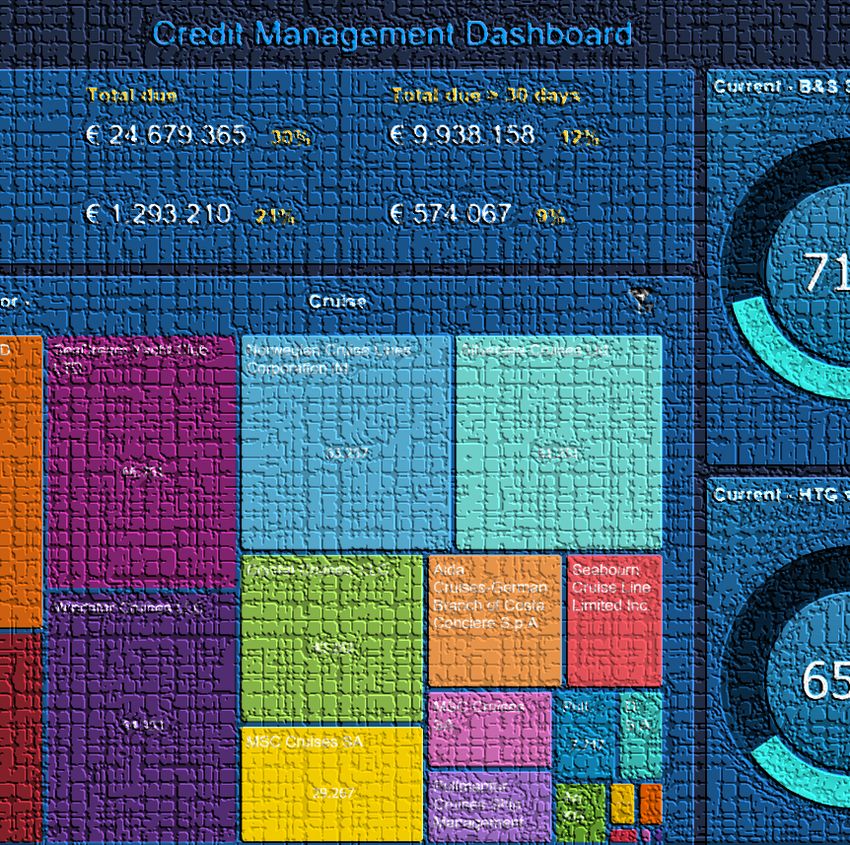
A unique value adding proposition

                                          Differentiated
               Long term relation-                                                           Broad and relevant
                                            sourcing
               ships with A-brand                                         Supply chain
                                                                           excellence
                                                                                           assortment of FMCG
               suppliers

       Linking suppliers
                                                                                              Delivering to the right place,
and customers that are difficult to
                                                                                                    at the right time
            connect
                                      Fully bonded
                                                                             Regulatory
                                      supply chain
                                                                              expertise
               Providing customers                                                        Serving complex niche
               tailored solutions                                                            markets worldwide

                                                       Highly efficient
                                                          logistical
                                                           platform

                                                                                                                               2
Investor Presentation | HY 2019 - B&S Group
Serving a diversified customer base worldwide

  Empowering wholesalers and retailers (B2B)   Serving complex end-markets in maritime

  Partner in remote distribution               Experienced in retail (B2C)

                                                                                         3
Investor Presentation | HY 2019 - B&S Group
Entrepreneurial segments supported by centralised backbone

                                                     Legal &
       IT                   Distribution                                     HR                 Finance & Control
                                                    Compliance

Distribution of bonded liquors and          Specialty distribution of FMCG        Specialty retail at high traffic
   health & beauty products to             products to maritime and remote        airports and remote locations
specialty retailers and online end-                    markets
            customers

             67%                                        25%                                    8%

                                               of 2018 Group turnover                of 2018 Group turnover
     of 2018 Group turnover

                                                                                                                     4
Investor Presentation | HY 2019 - B&S Group
Key elements defining
 our model

1Trusted and reliable partner with a clear
 value proposition

2Leading  positions in attractive channels and
                                                 VALUE
 specialised markets

3Entrepreneurial segments powered by our         ADDING
4
 centralised Group platform

  Track record of strong and consistent
                                                 distribution
  profitable growth

5Focused   on organic growth complemented
 with strategic M&A
                                                 partner
                                                                5
Investor Presentation | HY 2019 - B&S Group
Solid sales channels that are exposed to attractive long term trends
                  Business segments           B&S Group markets/ channels                  Attractive long term trends
               Turnover per segment 2018   Contribution to B&S Group turnover 2018

                                                                                          Market             Channel
                                                              40.7%

                                                                                        Outsourcing
                                                              27.2%                                           Value retail

€ 1,197 M
                                                                                     Fragmentation and
                                                                                         complexity
                                                                6.7%

                                                                                       Globalisation         E-commerce
                                                                7.3%

                                                                                       A-brands and
                                                              10.3%                       luxury
 € 446 M
                                                                                                                Travel
                                                                                        Compliance
 € 137 M                                                        7.8%
                        Column1

                                                                                                                             6
Investor Presentation | HY 2019 - B&S Group
A defensive profile towards macro economic developments

Robust and global       Bonded supplier       Diversified supplier
product categories      status                and customer basis

with mainly A-          limiting the impact   with limited
branded products that   of geopolitical       dependency on a
outperform in           developments          single market
economic hardship

                                                                     7
Investor Presentation | HY 2019 - B&S Group
Striving for continuous
economies of scale

Investments in logistics
and IT solutions on
Group level

Combining segmental
purchasing and sourcing
activities

Utilising our global
footprint to leverage
price position

                           8
Firmly focused on continuous organic turnover growth
complemented with selective M&A

                                                                    Discontinuation of                             FragranceNet.com
                                                                    non-premium-brand
                                                                    perfumes
                                                                                                                    Alcodis

                                                                                                                    114
                                                                                               Topbrands

                                                                                                           103

                                                                                          65

(in million €)                                Capi
  Acquisitive
                                UCVF                  38
  Organic
                                        58
                          9                                                                                        1,633

                                                                       1,338                               1,393
                                                                                         1,275
                                                            1,152
                                                     964
                         816           845
                  695
            573

          2009    2010   2011          2012          2013   2014       2015              2016              2017    2018

                                 Dutch GAAP                                                           IFRS

                                                                                                                                      9
Resulting in a strong track record of profitable growth

                              Discontinuation of non-
                              premium-brand
                              perfumes                               1,747

Turnover                                                                     EBITDA
CAGR ’09 - ’18                                               1,495           CAGR ’09 - ’18                                                     109
                                                                                                                                          106
                                                     1,339
13.2% p.a.                                   1,338                            17.3% p.a.

                                                                                                                                  89
                                     1,152                                                           Pressure on           84
                                                                                                     China luxury
                                                                                                     gifting
                            1,002
                     903                                                                                            65
              825                                                                                    59
                                                                                                               52
       677                                                                                 47
573
                                                                                    38

                                                                             26

2009   2010   2011   2012     2013   2014    2015    2016     2017   2018    2009   2010   2011     2012   2013     2014   2015   2016   2017   2018
                                                                                                  Dutch GAAP                             IFRS
                 Dutch GAAP                                  IFRS

                                                                                                                                                       10
Well positioned to capture growth opportunities
                                                                                Synergy
                                                                                effects
                                             Acquisitive
                                             growth                                 Boosting organic
Organic                                                                             growth of acquired
                                                                                    company
growth
                                                  •    Business model fit
     Expansion by increasing presence in          •    Integration focused          Value chain expansion
     our current markets                               on organic growth

                                                                                    Sourcing synergies
     Tapping into new products and
     markets                                                Strategy
                                                      Disciplined on price          Combined market
                                                                                    knowledge
     Cross-selling of products to existing            Initially structured as
                                                        partnership or JV
     customers                                                                      Centralised backbone
                                                   Rapid back office and            – plug & play
                                                    sourcing integration
     Utilising the growth of existing
     customers by matching
     their increased demand for our
     products
                                                                                                            11
HY 2019 Highlights

                     12
HY 2019 – Financial Highlights

Overall turnover growth   ▪   17.1% to € 898.3 M (15.1% at constant currency)

                          ▪   Growth of 7.4% (5.4% at constant currency)
Organic turnover growth
                          ▪   Of this growth, 0.9% stems from FragranceNet.com

  Business segment
                          ▪   HTG +28.5% | B&S +0.5% | Retail +1.6%
    contribution

                          ▪   EBITDA amounted to € 52.9 M
        EBITDA            ▪   pre IFRS 16 EBITDA came in at € 48.1 M

                          ▪   Solvency close to 34%
   Financial position     ▪   Net debt / EBITDA at 2.9

                                                                                 13
Key developments HY 2019

Investments on Group level                Performance on Segment level
▪ Expansion of robotised warehouse in
                                          ▪   Growth driven by Health & Beauty value retail and e-commerce markets
  HTG segment and combined with
  FNET technology to further boost        ▪   Strengthened international positions, intensified relationships in value
  Health & Beauty category                    retail and increased focus on the online platform business
                                          ▪   Synergies from combined sourcing in Health & Beauty category
▪ Logistics operations in B&S Segment
  on track
                                          ▪   Maritime market circumstances remain unfavourable
▪ Acquisition Lagaay Medical Group in     ▪   Opportunities identified in remote markets
  B&S Segment enhances single source      ▪   Performance in B&S Segment as expected given market conditions and
  supply concept                              additional costs in logistics (as communicated) with clear performance
                                              improvement in B&S Segment trend noticeable in H2
▪ Acquisition Rotterdam & Weeze
  Airport in Retail Segment strengthens   ▪   Lagaay integration into the B&S Segment in preparation
  regional store portfolio
                                          ▪   Retail segment performed as expected

                                                                                                                         14
Key figures HY 2019
€ million (unless otherwise   HY 2019       HY 2019    HY 2018       Δ (%)
                                                                                         Commentary
indicated)                    reported   pre IFRS 16   reported   reported

Profit or loss account
                                                                             ▪ Turnover grew 17.1%, gross
Turnover                         898.3         898.3      766.9     17.1%      profit grew 19.9%, margin was
Gross profit                     126.3         126.3      108.5     19.9%      14.1%
EBITDA                            52.9          48.1       45.9     15.2%
Depreciation & Amortisation       12.1           7.6        4.4              ▪ EBITDA grew 15.2%
Profit before tax                 35.1          35.5       38.4     (8.6%)   ▪ IFRS 16 positively impacted
                                                                               EBITDA by € 4.8 M, logistical
                                                                               costs B&S Segment negatively
                                                                               impacted EBITDA
                                                                             ▪ FragranceNet.com straight-line
                                                                               amortisation of intangible fixed
                                                                               assets has a material impact
                                                                               on contribution to results in H1
                                                                               from Fnet

                                                                                                                  15
HY 2019 – Segmental breakdown

                                                                       Commentary
€ million                   HY 2019   HY 2018   Change

                                                         ▪ HTG overall growth mainly
            Turnover          643.5     500.8    28.5%     attributable to Health & Beauty
HTG
            Gross profit       82.9      58.7    41.1%     category: value retail, e-
            EBITDA             40.4      30.8    31.4%
                                                           commerce platforms and online
            EBITDA margin     6.3%      6.1%      0.2%
                                                           B2C
                                                         ▪ Organic growth of HTG was
            Turnover          221.3     220.3     0.5%
                                                           13.6% (12.1% on a constant
            Gross profit       27.2      31.3   -13.0%
B&S         EBITDA              9.5      11.5   -17.1%
                                                           currency basis): strengthened
            EBITDA margin     4.3%      5.2%     -0.9%     international positions, intensified
                                                           relationships in value retail and
                                                           increased focus on online
            Turnover           64.7      63.7     1.6%     platform business
            Gross profit       16.5      15.8     4.3%
Retail      EBITDA              4.2       4.1     0.6%   ▪ B&S EBITDA impacted by
            EBITDA margin     6.4%      6.5%     -0.1%     additional € 4 M logistics costs
                                                           (as communicated in CMD)
                                                         ▪ Retail performed as expected

                                                                                                  16
Overall turnover growth analysis
                                               Commentary

                                   ▪ The HTG segment is the main
                                     contributor to Group organic
                                     growth in H1 2019
                                   ▪ The inclusion of the acquisition
                                     of FragranceNet.com
                                     contributed € 81.8 M of which
                                     € 6.9 M was organic growth
                                     stemming largely from
                                     combined sourcing advantages
                                   ▪ The development of the
                                     EUR/USD exchange rate had a
                                     positive effect of € 15.3 M on
                                     turnover growth

                                                                        17
Financial Position

                     18
HY 2019 - Financial position
                      € million (unless stated otherwise)   HY 2019     HY 2018                Commentary

                      Financial position                                           ▪ Financial position within pre-
                                                                                     determined objectives
                      Solvency ratio                           33.7%       37.3%
                                                                                   ▪ Balance sheet and as such
                      Net debt                                 329.8       277.0
                                                                                     solvency impacted by € 87 M
                      Net debt / EBITDA                          2.9*        2.7     intangibles following Fnet
                      Inventory in days                           98         103
                                                                                     acquisition
                      Working capital in days                    100         107   ▪ Net debt increase mainly
                                                                                     resulting from Fnet acquisition
                                                                                     and associated consolidation,
                                                                                     and the investment in working
                                                                                     capital
                                                                                   ▪ Increase in working capital:
                                                                                     mainly related to inventory
                                                                                     supporting our growth
                                                                                     expectations; working capital in
                                                                                     days improved

*Taking into account the LTM EBITDA of FragranceNet.com

                                                                                                                        19
Net debt development HY 2019
                                           Commentary

                               ▪ HY 18 negative cash flow from
                                 operating activities: € 48.2 M
                               ▪ HY 19 only € 0.4 M. Investment
                                 in inventory in 2019 set-of by
                                 cash inflow from late Q4 2018
                                 sales as indicated at FY18
                               ▪ Dividend represents payment to
                                 minority shareholders
                                 FragranceNet.com
                               ▪ Investing activities mainly
                                 investment in software € 3.0 M
                                 and logistical infrastructure €
                                 7.1M
                               ▪ Net debt excluding IFRS 16

                                                                   20
Working capital development
(€ x 1,000)            HY 2019 HY 2018                                         Commentary

          Inventory                      ▪ Inventory development (+14%) in line with business
                        431.9   379.0
            (days)
                         (98)   (103)
                                           development (+17.1%)

   Trade receivables
                                         ▪ Trade receivables in line with business development
         (days)         193.4   160.5
                         (38)    (37)

                                         ▪ Increase in trade payables is fully in line with the increase in
                                           turnover and inventory
     Trade payables     112.6   79.2

                                         550.0                                                                                 2,100.0
                                         500.0                                                                                 1,900.0
     Working capital                     450.0
                        512.7   460.3                                                                                          1,700.0
         (days)                          400.0
                        (100)   (107)
                                         350.0                                                                                 1,500.0

                                         300.0                                                                                 1,300.0
                                                 2016 HY   2016 FY   2017 HY     2017 FY         2018 HY   2018 FY   2019 HY

                                                                               WC          Turnover

                                                                                                                                         21
Outlook

          22
Outlook

                                      Expectations H2 and beyond

                                      ▪   Strong H2 in Health & Beauty with new business opportunities in B2B
Management focus
                                          distribution to value retailers and e-commerce platforms

▪   Expanding e-commerce              ▪   Demand in online B2C business of FragranceNet.com continues to grow
    platform business

                                      ▪   Seasonality further amplified and continued trend in sales shifting to late Q4
▪   Integration of Lagaay into B&S
    Segment
                                      ▪   Turnover growth and - over time - profitability at stable margins in B&S
                                          Segment by serving volume contracts in a cost-efficient way
▪   Capturing further opportunities
    for organic growth
                                      ▪   Lagaay expected to contribute to maritime and remote business in B&S
                                          segment

                                      ▪   New shop openings to contribute to turnover and profitability in Retail
                                                                                                                           23
Appendices

             24
Our balance as at December 31, 2018

                                                      Net debt to be seen    76% of assets = WC
 Non-current assets;
       157.3
                                                      in combination
                                   Equity; 273.1                                 Other
                                                      with/as part of WC         24%
                                                                                                   AR
                                                                                                  27%

                                                                                         Invent
   Inventory; 377.9                                                                        ory
                                                                                          49%

                                 Net Debt; 312.7

                                                      High turnaround       IFRS 16 and
                                                      inventory and AR =    Options
 Accounts receivable;             Trade payables;
                                       90.8
                                                      high turn-around      following Fnet
       205.7
                                                      Net debt              acq ≠ Net Debt
                                   Other current
                                  liabilities; 93.7
Other current assets; 29.4

      Assets                 Equity and Liabilities

                                                                                                        25
Effects of prepayment to suppliers

  PRODUCTS          INCREASED               ACCOUNTS PAYABLE
  AVAILABLE         INVENTORY               REPLACED BY BANK
  AT BEST PRICES    POSITION                DEBT

  Competitive       Inventory already       AP days low compared to
  advantage         recognised at balance   ‘classic’ distributor model
  in the market     during transit

                                                                          26
Our balance as at December 31, 2018
Net debt/EBITDA 2.9 | Days WC 103                            Net debt/EBITDA 1.4 | Days WC 70

   Non-current assets;                                         Non-current assets; 157.3
         157.3

                                     Equity; 273.1                                                  Equity; 273.1

    Inventory; 377.9                                                Inventory; 377.9
                                                        OR                                        Net Debt; 156.8

                                   Net Debt; 312.7

                                                                                               Trade payables; 246.7

   Accounts receivable;             Trade payables;
                                         90.8                  Accounts receivable; 205.7
         205.7

                                     Other current                                          Other current liabilities; 93.7
      Other current                 liabilities; 93.7
                                                               Other current assets; 29.4
      assets; 29.4
        Assets                 Equity and Liabilities                  Assets               Equity and Liabilities
              Accounts payable as is                                      Accounts payable at 60 days
                                                                                                                              27
Working capital development
WC                                                                                                                               Turnover
€ mln                                                                                                                            € mln

 560                                                                                                                               2,000

 510
                                                                                                                                   1,800
 460

 410                                                                                                                               1,600

 360                                                                                                          Start of
                                                                                                              inventory            1,400

 310                                                                                                          build-up

                                                                                                                                   1,200
 260
                                                                                           Peak
                                                                                           following
 210                                                                                       seasonal                                1,000
                                                                                           sales
 160
                                                                                                                                   800
 110

  60                                                                                                                               600
        1612   1703            1706    1709             1712       1803            1806    1809            1812           1903
                 Accounts receivable    Inventory                   Accounts payable       Working capital
                 Turnover LTM           Linear (Working capital)   Linear (Turnover LTM)

                                                                                                                                            28
Managing
 our portfolio
1Extensive KYC procedures
2Allguaranteed
       debtors insured or payment
                by other means

3IT controls on credit limits
4Dashboards      to follow our
 portfolio real time

 Controls proven to be effective
 Provision for doubtful debt (as %
 of turnover)
 2016: 0.12%
 2017: 0.08%
 2018: 0.06%
                                     29
Managing
 our inventory
1Sourcing worldwide and building
 up inventory for seasonal sales

2Dedicated departments with
 category management

3Mainly A-brands with limited
 exposure to economic hardship

4Weekly  KPI reporting for tracking
 developments

 Controls proven to be effective
 Write down (as % of turnover)
 2016: 0.32%
 2017: 0.29%
 2018: 0.19%
                                      30
Our balance as at December 31, 2018

                                                                   Balance sheet          WC forms main part
                 Non-current assets;
                       157.3                                       remained solid post    of asset side
                                               Equity; 273.1
                                                                   FragranceNet           balance sheet
                                                                   acquisition

                   Inventory; 377.9
   Healthy
positions with                               Net Debt; 312.7       Inventories and       As result of M&A price
     high
 turnaround
                                                                   receivables partly    discipline, goodwill on
  and cash                                                         financed by debt      balance sheet limited
 generation
                                                                                         (€ 59.9 M)
                 Accounts receivable;
                       205.7                    Other current
                                              liabilities; 184.5
                 Other current assets;
                         29.4
                       ASSETS            EQUITY AND LIABILITIES

                                                                                                                   31
Net debt development 2018

                                                           Increase of 16.3%
                                                           Turnover +16.8%
                                       Increase of 12.1%
                                       Turnover +12.5%

Acq.
Topbrands                    30.4

                     174.1

            *After dividend distribution

                                                                               32
Tax position explained
Januari 1,
    2018     January 1, 2018
             Transfer pricing agreement for all 100% group companies worldwide

             2018
             Expected tax charge: 19%
             Actual tax charge: 21%

             Result of:
             ▪ Increased contribution of Topbrands and JTG to result however taxed
               at 25%
December     ▪ FragranceNet taxed at 28%
 31, 2018

             Expectations 2019
             Delay of tax decrease in Netherlands to 2020 (22.55%)
             No significant change in composition of result expected

                                                                                     33
Forward-looking information / disclaimer

This presentation includes forward-looking statements. Other than reported financial results and historical information, all
statements included in this presentation, including, without limitation, those regarding our financial position, business strategy and
management plans and objectives for future operations, are, or may be deemed to be, forward-looking statements. These forward-
looking statements may be identified by the use of forward-looking terminology, including the terms ''believes'', ''estimates'',
''plans'', ''projects'', ''anticipates'', ''expects'', ''intends'', ''may'', ''will'' or ''should'' or, in each case, their negative or other variations or
comparable terminology, or by discussions of strategy, plans, objectives, goals, future events or intentions.
These forward-looking statements are based on our current expectations and projections about future events and are subject to
risks and uncertainties that could cause actual results to differ materially from those expressed in the forward-looking statements.
Many of these risks and uncertainties relate to factors that are beyond B&S Group’s ability to control or estimate precisely, such as
future market conditions, the behaviour of other market participants and the actions of governmental regulators. Readers are
cautioned not to place undue reliance on these forward-looking statements, which speak only as of the date of this presentation
and are subject to change without notice. Other than as required by applicable law or the applicable rules of any exchange on
which our securities may be traded, we have no intention or obligation to update forward-looking statements.

                                                                                                                                                              34
35
You can also read