Changing patterns of employment in south east Queensland - Department of State Development
←
→
Page content transcription
If your browser does not render page correctly, please read the page content below
Changing patterns of employment in south east Queensland
The plug…
Employment in south east Queensland:
Recent history.
Roughly 1.2 million workers across south east Queensland (2011)
Roughly half in Brisbane, roughly half elsewhere
                                               Toowoomba
                                                 60,000 jobs

                                          Ipswich
            Scenic Rim                   51,000 jobs
             11,000 jobs
                                                  Brisbane
                                                 630,000 jobs   Moreton Bay   Sunshine Coast
                                                                 90,000jobs     90,000 jobs
                             Logan
                           74,000 jobs            Redland
                                                 35,500 jobs

            Gold Coast
            185,000 jobs
Employment in south east Queensland

Median income (2011) for SEQ: $46,883
                                      Toowoomba
                                            $42,300

                                  Ipswich
           Scenic Rim             $45,000
            $35,700
                                            Brisbane
                                            $53,700    Moreton Bay   Sunshine Coast
                                                         $38,900        $39,000
                        Logan
                        $41,000         Redland
                                            $38,500

           Gold Coast
            $41,000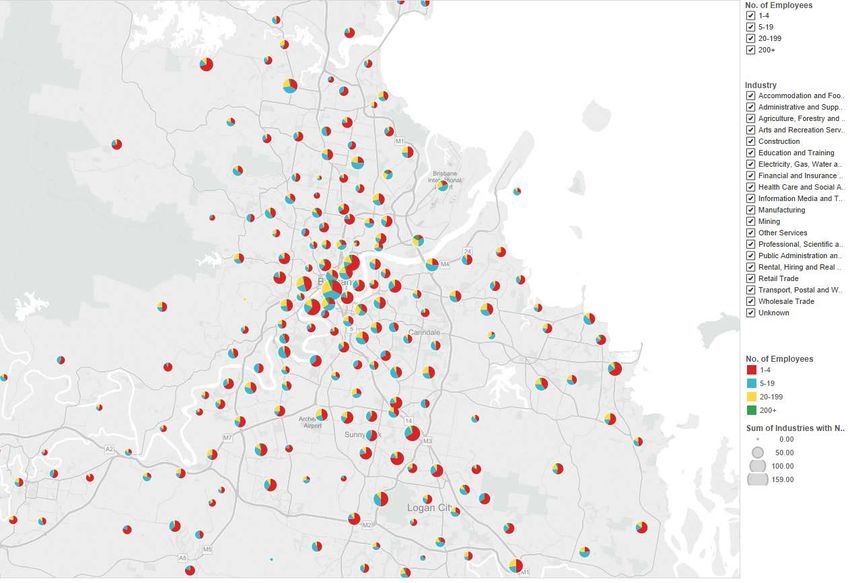
Inner city workers (2011)

                                              Valley
                                              20,109
                         Spring Hill
                           14,549                                    New Farm
                                                                       3,374

                                     CBD
                                    116,132            Kangaroo Pt
    West End                                              2,107
      6,820
                  South Brisbane
                      22,758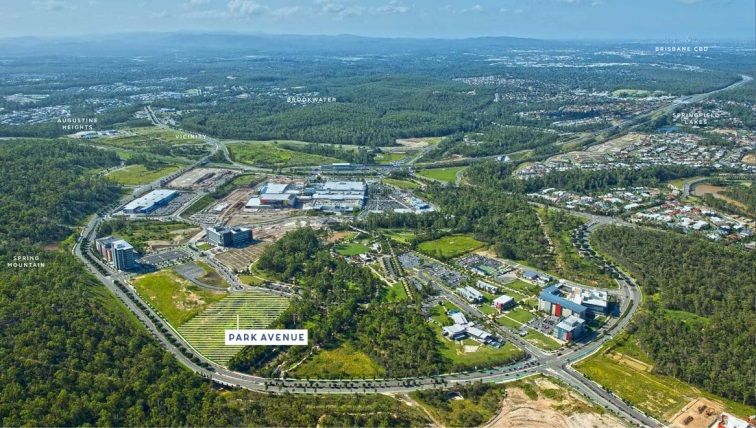
Metro wide shares of employment 2011
Job ads – Brisbane region – 2010 to late 2015

    Business, finance, HR                Engineers

                                     ICT

                Legal, social, welfare               Medical, nursing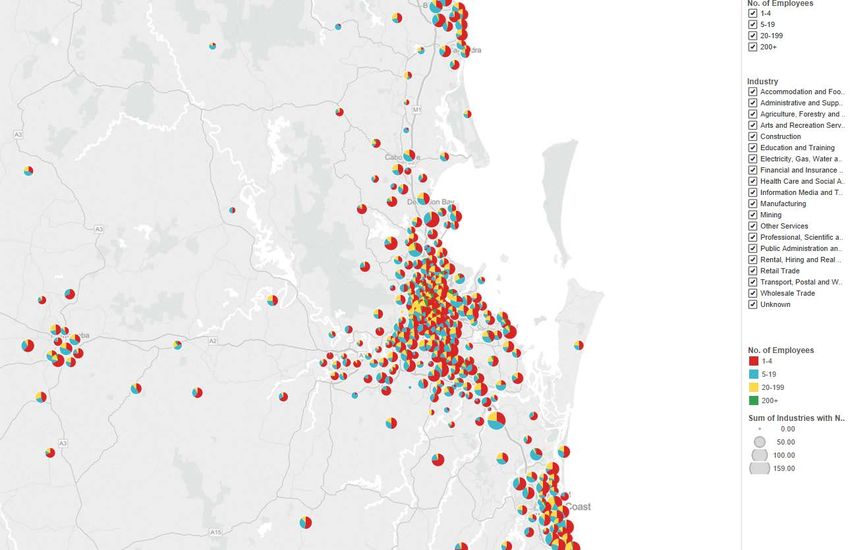
Latest (24th Feb) national job ads. 2006=100

                                Source: Fed Dept of Employment & Education.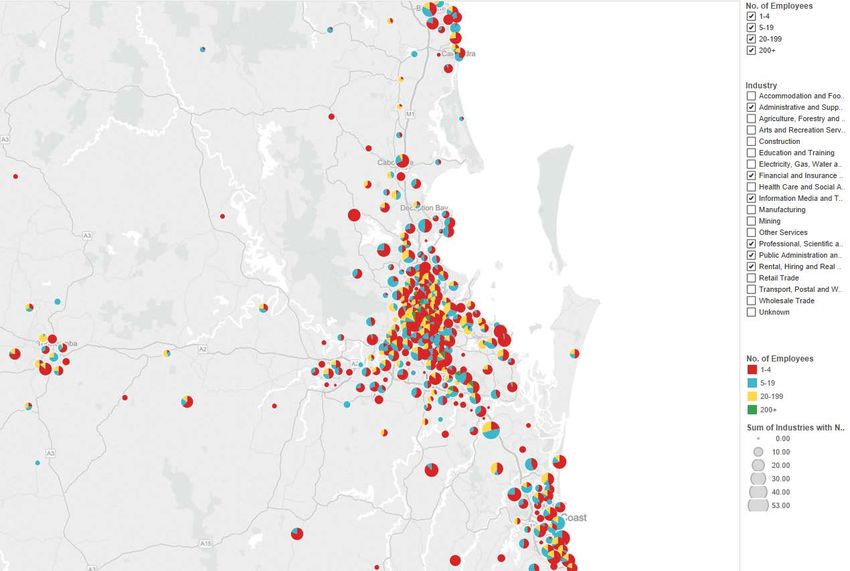
Latest (24th Feb) national job ads. 2010=100.

                                      Less More

                   Source: Fed Dept of Employment & Education.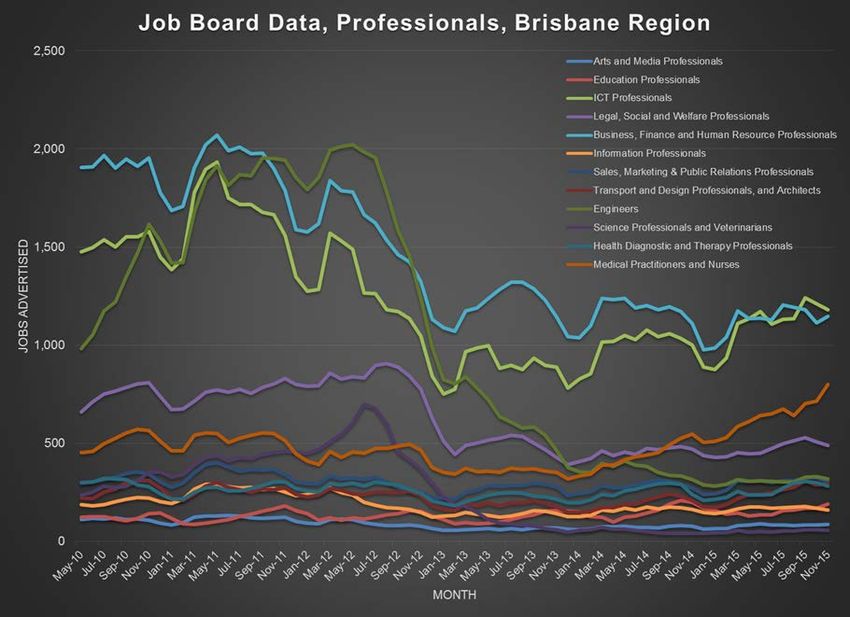
Brisbane vs national job ads. 2010=100.
‘National winners’                   Less                 More

                     Source: Fed Dept of Employment & Education.
Business locations SEQ by size and type 2014
‘White collar’ businesses 2014
‘Blue collar’ 2014
(agriculture, forestry, utilities, construction, manufacturing, transport, wholesale & retail trades)
Decline in SEQ business counts 2012 to 2014 all size business
Growth in business counts 2012 to 2014 all sizes, types
Growth in ‘white collar’ businesses 2012 to 2014 all sizes
Growth in ‘white collar’ businesses more than 5 employees
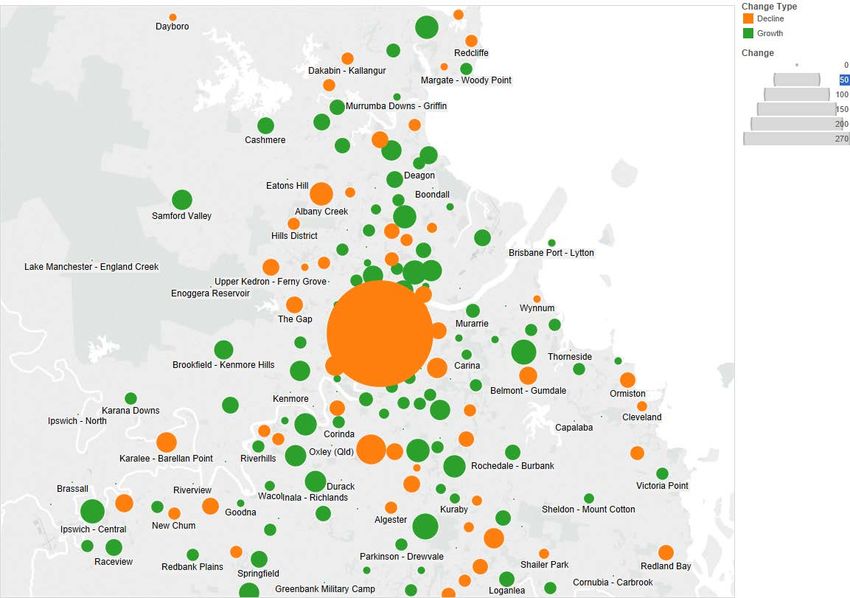
Zoom on Brisbane: growth in business counts 2012 to 2014
Brisbane: growth in businesses 2012 to 2014 all types, more than
5 employees
Brisbane growth in ‘white collar’ businesses 2012 to 2014
more than 5 employees
Brisbane: decline in ‘white collar’ businesses 2012 to 2014
more than 5 employees
Change in
business counts of
20+ employees
2011 to 2015
Change in business counts of 20+ employees
2011 to 2015
Verification…
Only 7% of total trips (not including CBD) were to ‘principal activity centres’ – the other 93% were to
other suburban destinations

 Source: Queensland Household Travel Survey
Conclusions: the evidence on recent history of
employment in South East Queensland

• Spatial patterns of employment have been changing
• Employment is growing, but lately not in ‘traditional’ centres
• Increasing tendency for employment growth in non-central
  locations
• This appears to include ‘white collar’ workers also
• Is this a reflection of recent history (high rents, limited
  carparking in CBD) or signs of a longer term trend?
• Does this present opportunities for enhanced commercial
  development in regional and suburban locations?
Future Employment Patterns in SEQ
Queensland’s Economic Transition
Recently Queensland’s growth has been underpinned by the energy and
resources investment boom, which is now over. Drag on growth from mining
expenditure downturn is reducing, while exports are supporting growth.
We are moving into a services sector era – unlike any in our history.
This will result in structural change that will require different methodologies
for understanding and forecasting jobs and economic growth.
The future employment will have implications for how we live, work and
amuse ourselves.Jobs – Queensland’s Key Economic Driver
Globalisation, international trade, technology, wealth and demographics are
driving growth and change in the service sector:
Household services
Business services
Key growth industries for SEQ over the next five years – health care and social
assistance; professional, scientific and technical services; education and training;
accommodation and food services; and construction.
Impacts on property
New and different formats for workspace and residential formats4 Keys Drivers of the Emerging Services Sector Globalisation Digital Trade Information and Communication Technology Demographics and Wealth
Globalisation Digital Trade
Queensland’s global opportunity will be driven by Digital trade i.e. domestic commerce and
Asian population and economic growth. international trade conducted on the internet has
already had far reaching effects on global economies
Significant opportunities from demand for Qld
and city shapes in Australia (e.g. Bitcoin)
education and tourism subject to competitive price
points It has fundamentally transformed many aspects of the
way businesses operate and interact with each other.
The globalisation of services is a key driver of
This includes:
structural change in the Australian economy and
Australian city building is a key to Australia’s Lowering barriers to market entry for small and medium
services sector competitiveness. size enterprises (SME’s)
Increasing production efficiency. For example in the
QLD examples – gathering pace of offshore services sector the way ideas are recorded, developed and
accountancy, legal, financial professionals and replicated.
technicians in India, China, Malaysia.
Blockchain and Bitcoin by passing financial intermediaries
“ Blockchain will revolutionise the world” (Blythe Masters:
economist and former executive at JPMorgan Chase; Paul
Brody: former IBM executive and EY strategy leader for
the technology sector)
Other example includes
Distribution of services via ‘on demand’ technologies (e.g.
movies via Netflix or Hulu)
Creation of major new services e.g. Online gaming, which
is now a bigger industry than the film industryTechnology & Information and Population:
Communication Technology Fast Growth Implications
The fast-changing dynamics and location preferences By 2031, South East Asia will accommodate a 1.7
billion person middle class, an increase of 1.2
for employees will be driven by information
billion persons.
technology and new growth industries (e.g. health, Australia demographics to drive household
finance, retail, tourism, education) services sector into the 2030’s
Real gross national income per person will increase by
This works in concert with emerging household 32% (2014 to 2034)
characteristics (such as growth in single person Real expenditure per person on health will increase by
households, remote and mobile workers, rapid 25% (2014 to 2034)
increases in the workforce participation rate of the Real expenditure on aged care per person will increase
by 44% (2014 to 2034)
65+ age group, increased job churn in two person
households). Real consumption directed to services will increase in
terms of percentage share
Nationally, we just hit 24 million population -
increased life expectancy, immigration and a spike
in birth rate. 17 years earlier than previous
forecasts predicted.
QLD Demographics
The population will increase by 2.4 million people
(50.2%) from 4.7 million in 2014 to 7.1 million in 2036
Household formation and dwelling numbers will
increase by 65.2% from 1.8 million in 2011 to 2.9
million in 2036 Largest growth will be in the
following industries
Retail Trade - 2,954 jobs
Construction – 3,379 jobs
Health Care and Social Assistance
– 5,148 jobs
Accommodation and Services –
3,106 jobs
Professionals, Scientific and
Technical Services – 1,666 jobs
Across the Moreton Bay LGA, it
forecast that there will be
approx. an additional 23,500
jobs (2014 to 2019) by
November 2019. The majority
of these jobs will be across the
5 categories above with an
additional contribution of
Transport, Postal and
Warehousing
Diverse urban, coastal
hinterland and rural
communities - slowly less reliant
Hassell architects’ impression of the planned USC campus for Moreton on traditional industries.
Bay University Precinct20-year MBRC employment projections
MRBC Employment by Industry (POW) 2015-16 to 2035-36 Top 3 MBRC POW Employment Projections 2015-16 to 2035
Average
2035-36 2015-16
Total Job annual
Other Services
Growth Growth
Arts and Recreation Services
Agri cul ture, Fores try a nd Fi s hi ng 239 12
Health Care and Social Assistance
Mi ni ng 396 20
Education and Training
Manufacturing 5,343 267
Public Administration and Safety
El ectri ci ty, Ga s , Wa ter a nd Wa s te Servi ces 3,025 151
Administrative and Support Services
Construction 7,509 375
Professional, Scientific and Technical…
Whol es a l e Tra de 540 27
Rental, Hiring and Real Estate Services
Reta i l Tra de 772 39
Financial and Insurance Services
Accommodation and Food Services 2,962 148
Information Media and…
Tra ns port, Pos ta l a nd Wa rehous i ng 1,138 57
Transport, Postal and Warehousing
Informa ti on Medi a a nd Tel ecommuni ca ti o 136 7
Accommodation and Food Services
Fi na nci a l a nd Ins ura nce Servi ces -84 -4
Retail Trade
Renta l , Hi ri ng a nd Rea l Es ta te Servi ces 1,742 87
Wholesale Trade
Professional, Scientific and Technical 4,231 212
Construction Admi ni s tra ti ve a nd Support Servi ces 2,404 120
Electricity, Gas, Water and Waste… Publ i c Admi ni s tra ti on a nd Sa fety 2,180 109
Manufacturing Education and Training 6,542 327
Mining Health Care and Social Assistance 11,773 589
Agriculture, Forestry and Fishing Arts a nd Recrea ti on Servi ces 358 18
0 10,000 20,000 30,000 40,000 Other Servi ces 1,514 76
Total persons employed 52,719 2636
Source: QGSO/ MacroPlan
Source: QGSO/ MacroPlan For Logan LGA, the largest growth
will be in the following industries
Health Care and Social Assistance –
2,411 jobs
Education and Training – 1,316 jobs
Public Administration and Safety –
878 jobs
Accommodation and Food Services –
1,112 jobs
Professionals, Scientific and Technical
Services – 606 jobs
Across the Logan LGA it forecast
that there will be approx. an
additional 9,000 jobs (2014 to
2019) by November 2019.
The majority of these jobs will be
across the 5 categories above, as
well as the construction industry,
which is forecast to increase by 7%
or 1,163 jobs
Employment containment boost
through investment across range of
services industries
Upgrade of M1:
Major link connecting Logan Central and SEQ For Ipswich, the largest growth
will be in the following
industries
Health Care and Social
Assistance – 4,342 jobs
Education and Training – 2,121
jobs
Accommodation and Services –
1,400 jobs
Professionals, Scientific and
Technical Services – 1,382 jobs
Administrative and Support
Services – 1,101 jobs
Across the Ipswich LGA, it
forecast that there will be
approx. an additional 15,100
jobs (2014 to 2019) by
November 2019.
The majority of these jobs will
be across the 5 categories
above – emerging signs of the
second CBD
Hub of the Western Corridor
accommodating significant
numbers of new dwellings and
jobs – enabled by
infrastructure
Springfield CBDSEQ - Top 5 Employment by Industry
50,000
44,989
45,000
40,000
35,000 31,289 Construction
30,000
Accommodation and Food Services
25,000
19,481 19,613 Professional, Scientific and Technical Services
20,000 18,008
Education and Training
15,000
Health Care and Social Assistance
10,000
5,000
-
Top 5 SEQ Industries
Source: Dep’t Employment and Training; MacroPlan
Top 5 SEQ’s employment by Industry (2014-2019)
• Health Care and Social Assistance – 44,989 jobs
• Professionals, Scientific and Technical Services – 31,289 jobs
• Education and Training – 19,613 jobs
• Accommodation and Food Services – 19,481 jobs
• Construction – 18,008 jobsGeographic distribution of LGA all projected employment
Employment data for LGA Projected increase Share %
Somerset, Lockyer
Valley, Scenic Rim and Brisbane 80,324 42%
Redland is not included Gold Coast 44,952 23%
Brisbane generates 42% Moreton Bay 23,489 12%
projected jobs (all
industries) of SEQ for Sunshine Coast 18,543 10%
the 2019 forecast
Ipswich 15,077 8%
Top 5 industries
Logan 8,906 5%
generate approximately
130,000 jobs SEQ (Total) 191,291 100%
45% 42%
40%
35%
Brisbane
30%
Gold Coast
25% 23%
Moreton Bay
20%
Sunshine Coast
15% 12%
10% Ipswich
10% 8%
5% Logan
5%
0%
LGA
Source: Dep’t Employment and Training; MacroPlan2019 LGA Total Additional Jobs Forecast
Ipswich
15,077
Logan Sunshine Coast
8,906 Brisbane/Redland 18,543
Moreton Bay
80,324 23,489
Gold Coast
44,952Major Projects/infrastructure
Sunshine Coast
Sunshine Coast Airport Expansion (A$347 million, due to be
completed in2020), generates 1,538 operational jobs once
completed
Maroochydore CBD (Anticipated Gross Land Value: A$375
million, development and investment opportunities offered over
the next 20 years), projected to create 10,000 jobs for the
region
Light Rail Extension (A$2 billion, first stage completed in 2020)
Public University Hospital (A$1.8 billion, opens in late 2016),
generates 1,500 jobs, has capacity for expansion
Moreton Bay
University Precinct for University of Sunshine
Coast, cater for 10,000 students within the first
10 years (from 2020), generates approximately
1,000 jobs
University Hospital
Moreton Bay Rail Link: 12 km, completion
expected by the end of 2016
Ipswich
Logan
Another CBD in the form of Springfield
Logan Hospital expansion, $145 million
($85 billion investment
Hubs for Cultural Services and Activities
GE Headquarters ($72 million office
Wembley Road and Logan Motorway
complex).
Interchange with 3,000 industry jobs
QLD Rail: Springfield and Springfield
Widen 16 km Pacific Motorway through
Central station
City of Logan
Amberley (ADF) and Ebenezer
South East Busway Extension
(industrial)
Upgrade of Mt Lindesay highwayMajor Projects/infrastructure
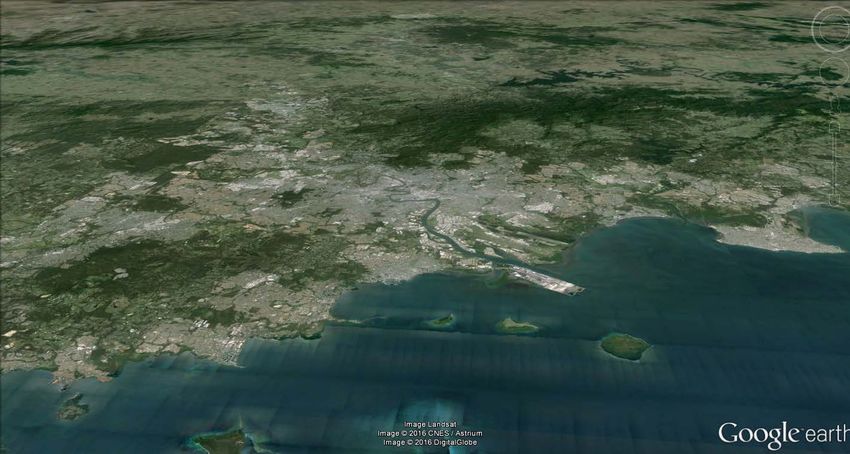
Brisbane
Queen Wharf Precinct: Priority Development Area
(PDA), 3,000 jobs during construction and 8,000
ongoing jobs
1 William Street (1,000 in construction)
Brisbane Airport Corporation with its new
development plan for new Brisbane Charter Terminal,
generates 5,000 additional full-time jobs (investment
phase), by 2034, 5,200 full-time equivalent jobs
$1.54 billion Brisbane Metro (Light Rail), built over
six years for a 100 year life
Queens Wharf Precinct
Gold Coast
2018 Commonwealth Games ($41 million Gold Coast
Aquatic Centre, $114 million upgrade to the Carrara
Sports Precinct, $40 million Coomera Sports and
Leisure Centre construction)
Gold Coast CBD (Southport): attracting an additional
workforce of 24,857 people (Construction kicks off in
2014)
Health and Knowledge Precinct (Gold Coast
University Hospital, Griffith University): potential for
over 11,000 jobs; commence greenfield development
in early 2019
Light Rail: 13 km, $1.6 billion
Gold Coast Light RailStrategy implications/risks?
• Growth industries of the future (eg health, social, education) are reliant on proximity to
their markets, not so much proximity to each other (which is a CBD model). They are not
‘centralised’ industries but are suburban or regional by nature – good opportunity for
Moreton Bay
• Requires policies that provides Moreton Bay with blend of local population based non-
tradable services jobs – education and training, administration, health care and social
assistance & construction with tradable jobs in tourism, international education, advanced
manufacturing.
• Ongoing Research to de-risk the strategy: Investigate the growth sectors, Identify which
companies within that sector are potential targets, Investigate their locational preferences,
What industry drivers will influence future location decisions, Are there suitable sites - On
Logan Council land and other sites?
• IF the nature of work is changing to a more suburban/regional model in SEQ, what does this
mean for traditional location strategies for development in Moreton Bay?
• This is a big “IF”. But the alternative is to suggest that the nature of work is NOT changing.THANK YOU
You can also read