Payments and E-commerce Report - Eastern Europe and the CIS - Gain expertise and get granular insights on e-commerce in Eastern Europe and the ...
←
→
Page content transcription
If your browser does not render page correctly, please read the page content below
Payments and E-commerce Report
Eastern Europe and the CIS

Gain expertise and get granular insights on e-commerce in Eastern
Europe and the CIS: consumer demographics, payment preferences,
cross-border shopping stats and more.
                                                                    1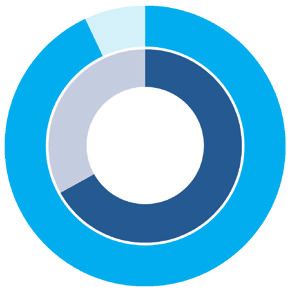
Eastern Europe and the Commonwealth
of Independent States
In the markets covered by this report – in Eastern Europe          increased by 42 % (highly significant, given that agriculture
and the Commonwealth of Independent States – the value             accounts for around 1 2% of economic output) and con-
of e-commerce is growing at a rate of 14 %¹. This is all the       sumer demand started to rise again⁹.
more eye-opening, given that recent months have been
challenging for most of the countries involved.                    In 2018, the economies of all three Baltic states – Lithuania,
                                                                   Latvia and Estonia – grew by close to or more than 4 %¹⁰.
In October, the World Bank revised its forecast for the            In 2019, analysts expect Lithuania to grow by 3.7 %¹¹ and
Russian economy, predicting it would grow by just 1 %              both Latvia and Estonia by 3.2 %¹², ¹³ By the end of 2019,
rather than 1.2 % as previously forecast. The bank cites the       consumer confidence in Latvia and Lithuania was in positive
effects of US sanctions, economic turmoil in emerging              figures (indicting relatively high confidence)¹⁴, ¹⁵. In Estonia,
markets and the continued low price of oil as key factors          confidence was negative but rising rapidly16.
which are preventing the Russian economy from performing
at its peak².                                                      In Romania, the economy grew by 4.1 % in 2018¹⁷ and was
                                                                   expected to grow by 4 % in 2019¹⁸. Respectable as a 4 %
However, there are signs that things could be picking up. In       growth rate is, it’s significantly down on the incredible 7 %
the third quarter of 2019, year-on-year growth rebounded           growth rate Romania posted in 2017¹⁷. S&P attributes the
to 1.7 %³. The statistics service Rosstat explained the uptick     slow down to global headwinds and rising pension costs
as the result of improved productivity in the second half of       making it harder for the state to spend in other areas¹⁹.
the year, with mining output up 2.9 % and agricultural
output up 5.1 %³. At least some of this is almost certainly        In Central Asia, Kazakhstan’s GDP grew by 4.1 % in 2018²⁰
down to the US China trade dispute, with Chinese buyers            and experts expect it to grow by 3.4 % in 2020²¹. This is
turning to Russian farmers to replace American suppliers⁴, ⁵.      strong by global standards but other countries in the
                                                                   region are growing faster (Tajikistan by 7 % and Turkme-
The Ukrainian economy is expected to grow by around                nistan by 6 %, for instance²¹). Much of the slow down is due
3 % in 2019, down from 3.3 % in 2018⁶. This is still an improve-   to the relatively low price of oil (45 % of the country’s
ment on the performance of a few years ago, when the               exports²²) and the slackening of demand for industrial
economy was depressed by war against separatists in the            commodities (the country is a major exporter of copper
country’s eastern provinces and by factors such as the             and uranium²²). In Uzbekistan the economy grew by 5.1 %
continued uncertainty over Ukraine’s future as a gas-transit       in 2018²³. The Asian Development Bank expected the
country once the Russo-German Nordstream-2 pipeline                Uzbek GDP to expand by almost 6% in 2019²⁴.
is completed⁷, ⁸. In the first half of 2019, grain exports

2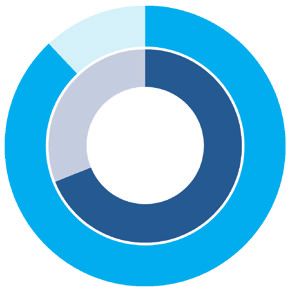
The region covered by this report – from the Bug river on         Russian online sales were from non-Russian sites¹. For the
the Polish-Ukrainian border to the plains of Central Asia –       region as a whole, 21 % of all online sales were cross-border.
is large and diverse. But in all the countries covered, despite   Though this excludes the Central Asian states, for which
global headwinds, economies and e-commerce markets                this data is not yet available.
are showing strong growth.

                                                                  THE LOCAL PAYMENT CULTURE
THE EASTERN EUROPEAN E-COMMERCE
MARKET                                                            The most common payment method across the region is
                                                                  credit or debit card – used in 34 % of all online transactions¹.
To understand what was happening in e-commerce in                 However, this average figure hides wide regional discrep-
Eastern Europe and the Commonwealth of Independent                ancies. In Kazakstan, for instance, consumers pay for 60 %
states, PPRO researched eleven of the region’s most pro-          of online transactions with cash and only 20 % using a
mising markets. These markets were Bulgaria, Estonia,             card¹. In Latvia, these figures are almost completely re-
Latvia, Lithuania, Romania, Russia, Ukraine, Kazakhstan           versed, with consumers using cards in 49 % of e-commerce
and Uzbekistan.                                                   purchases and cash in just 12.5 %¹. Even when a large per-
                                                                  centage of transactions are paid for by card, the cards used
E-commerce in these markets is growing at an average rate         may be local, rather than the big international brands. In
of 14 %. 5 % of all retail sales are made online. The average     Russia, for instance, 20 % of the card market has been
online consumer spends $702 a year¹. The growth in                captured by local schemes¹.
e-commerce is driven by the same factors as in other
markets – the increasing ubiquity of high-speed Internet,
consumer price sensitivity and the improvement in delivery        ENABLING AND LIMITING FACTORS
networks.
                                                                  67 % of Eastern Europeans have a bank account and 18 %
There are, however, some factors specific to the region –         have a credit card¹. As the data from the payment market
or at least to countries within the region. In Russia, for        demonstrates, to maximise acceptance and conversion, you
instance, a hunger for consumer goods in remote regions           will need to understand the preferred payment methods
is being met by a wave of new Chinese cross-border                in each market.
e-commerce stores. In 2018, 56 % of Russian e-commerce
users had shopped abroad at least once and 28 % of

                                                                                                                                3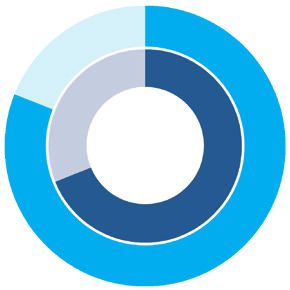
69 % of Eastern Europeans have an Internet connection
and 57 % have an Internet-enabled smartphone¹. According
to the International Telecoms Union (ITU), on average 18 %
of households in the countries studied had a fixed-line
broadband connection²⁵.

Fixed-line penetration ranges from 12 % in Ukraine to 33 %
in Estonia. The number of mobile-phone subscriptions
per 100 inhabitants, however, ranges from 76 in Uzbekistan
to 164 in Lithuania²⁶. Any e-commerce platform and e-com-
merce strategy for this region must be cross-channel but
mobile-first.

CONCLUSION

Eastern Europe and CIS are highly diverse regions,
economically, culturally and in almost every other way.
Their growing e-commerce markets are ripe for investment,
with consumers hungry for products and for leading
brands. But any successful strategy must be built on a
detailed knowledge of the local and regional markets and
must factor in a high degree of localisation.

4

1. Original PPRO research
2. The World Bank in Russia, 29 October 2019, The World Bank
3. UPDATE 1-Russia’s economic growth picks up in Q3 to 1.7 %, 13 November 2019, Reuters
4. A Surprise Winner From the U.S.-China Trade Spat: Russian Soybean Farmers, 21 February 2019, Thomas Grove and Anatoly Kurmanaev,
  The Wall Street Journal
5. China approves wheat, soy imports from Russia, 26 July 2019, Reuters
6. Ukraine PM targets economic growth of 5 % next year, 2 September 2019, Reuters
7. When javelins aren’t enough, 3 April 2019, Diane Francis, Atlantic Council
8. What Nord Stream 2 means for Europe, 5 November 2019, Maik Günther, Atlantic Council
9. Ukraine’s Economy Enjoys a Hopeful Moment, 15 August 2019, Leonid Bershidsky, Bloomberg
10. GDP growth (annual %) – Latvia, Estonia, Lithuania, The World Bank
11. Analysts: Lithuania is expected to post strongest GDP growth in Baltics, 7 November 2019, Delfi
12. Finance Ministry cuts Latvia’s economic growth forecast for 2020, 21 August 2019, The Baltic Course
13. IMF raises Estonia’s 2019 economic growth forecast to 3.2 percent
14. Lithuania – Consumer Confidence, Moody’s Analytics
15. Latvia – Consumer Confidence, Moody’s Analytics
16. Estonia – Consumer Confidence, Moody’s Analytics
17. GDP growth (annual %) – Romania, The World Bank
18. IMF raises Romania’s 2019 GDP growth forecast to 4 %, 15 October 2019, Nicoleta Banila, SeeNews
19. Standard & Poor’s: Romania’s economic growth will slow down starting 2020-2021, 2 September 2019, Aurel Dragan, BR Review
20. GDP growth (annual %) – Kazakhstan, The World Bank
21. Kazakhstan: Economy, Asian Development Bank
22. Kazakhstan, Observatory of Economic Complexity
23. GDP growth (annual %) – Uzbekistan
24. Uzbekistan: Economy, Asian Development Bank
25. Fixed-broadband subscriptions per 100 inhabitants, International Telecoms Union
26. Mobile-cellular telephone subscriptions per 100 inhabitants, International Telecoms Union

                                                                                                                                       5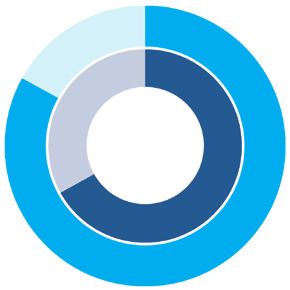
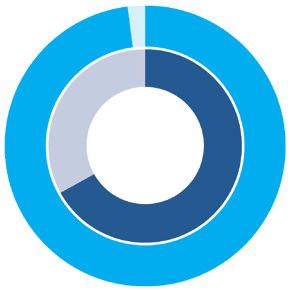
Regional Payment Trends                                                                                          67 %

                                                                                                                 74 %

                                                                                                             Banked
                                                            Region                  World                   population

    Population                                               272.9 m                7.6 bn

    Population (15+)                                         220.7 m                5.6 bn

    GDP                                                        2.4 tr               85.8 tr

                                                                                                                                 World
                                                                                                                 18 %

    GDP per capita                                            10,967                11,299                       21 %

    B2C e-commerce                                           45.8 bn                3.4 tr                 Credit card
                                                                                                           penetration

                                                                                                                                 Region
    B2C e-commerce growth                                      14 %                  18 %

    Online population                                        188.3 m                4.5 bn

    Smartphone penetration                                     57 %                  58 %
                                                                                                                 69 %
    Mobile e-commerce                                          27 %                  50 %
                                                                                                                 60 %

    Average online spend                                        702                 2,594
                                                                                                            Internet
                                                                                                           penetration
    E-commerce % of total retail                                5%                   16 %
                            Currencies in this report are always depicted in $USD

                       3%                                                                     2%

                                                                                    16 %
          23 %                                              Card                                                         Visa
                                        34 %
                                                            Cash                                                         Mastercard
                   Payment                                                                      Card     39 %
                   method                                    ank
                                                            B                                 scheme                     AMEX
                                                            transfer
                  breakdown                                                                  breakdown                   Local
                                                            E-wallet                                                     schemes
        16 %
                                                            Other                                                        Other
                                                                                    43 %
                            24 %

6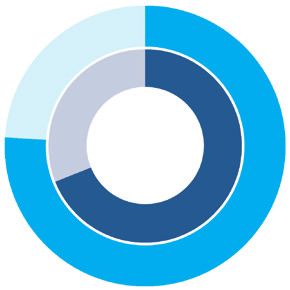
Bulgaria     . . . . . . . . . . . . . . . . . . 10

Estonia      . . . . . . . . . . . . . . . . . . 12

Kazakhstan   . . . . . . . . . . . . . . . . . . 14

Latvia       . . . . . . . . . . . . . . . . . . 16

Lithuania    . . . . . . . . . . . . . . . . . . 18

Romania      . . . . . . . . . . . . . . . . . . 20

Russia       . . . . . . . . . . . . . . . . . . 22

Ukraine      . . . . . . . . . . . . . . . . . . 24

                                                      7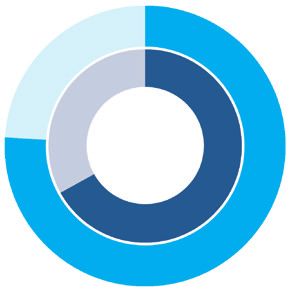
Bulgaria                                                                                                17 %
                                                                                                  e-commerce growth

                                        Bulgaria            Region            World
    Population                                7m            272.9 m            7.6 bn

    Population (15+)                          6m            220.7 m            5.6 bn    TOP E-COMM SEGMENTS
    GDP                                   65.1 bn               2.4 tr         85.8 tr

    GDP per capita                            9,273             10,967         11,299

    Online population                         4.5 m         188.3 m            4.5 bn
                                                                                             Airlines & Hotels
    Smartphone penetration                    56 %              57 %            58 %

    Average online spend                      334                702           2,594

    E-commerce % of total retail               2%                5%             16 %

                                                                                           Clothing & Footwear
        Banked                       Credit card                          Internet
       population                    penetration                         penetration
                 72 %                           14 %                          63 %

                 67 %                           18 %                          69 %
                                                                                             Electrical goods

                                   Bulgaria            Region                             Media & Entertainment

                                                                                              Food & Drink
          B2C e-comm.              Mobile e-comm.           Cross-border e-comm.
             0.7 bn                 12 % of total               17 % of total

8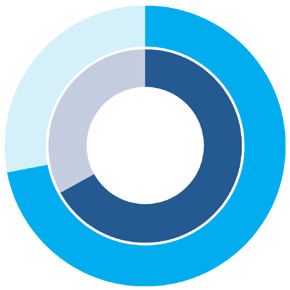
5%
       7%
                                                             26 % Card total
                          26 %
                                                             26 % ICS
                                             Card            0.4 % BORICA
             Payment                         Cash
             method
            breakdown                        Bank transfer

                                             E-wallet

       63 %

               1%

                                                             0.1 bn
                                                             Cross-border
                                            Card scheme      e-commerce value
                                            breakdown
                               45 %                          35 % shop cross-border
53 %                                         Visa

                                             Mastercard
                                                                  Germany

                                             Local schemes
                                                                  China

                                                                  Russia

                        SEPA Direct Debit

                                                                                      9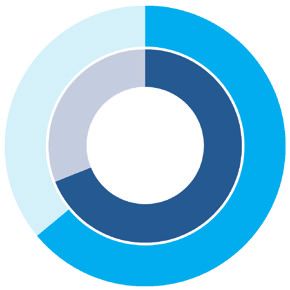
Estonia                                                                                             20 %
                                                                                              e-commerce growth

                                     Estonia            Region            World
 Population                               1.3 m         272.9 m            7.6 bn

 Population (15+)                         1.1 m         220.7 m            5.6 bn    TOP E-COMM SEGMENTS
 GDP                                  30.3 bn               2.4 tr         85.8 tr

 GDP per capita                       22,928                10,967         11,299

 Online population                        1.2 m         188.3 m            4.5 bn
                                                                                        Airlines & Hotels
 Smartphone penetration                   65 %              57 %            58 %

 Average online spend                     415                702           2,594

 E-commerce % of total retail              7%                5%             16 %

                                                                                       Clothing & Footwear
      Banked                     Credit card                          Internet
     population                  penetration                         penetration
              98 %                          29 %                          88 %

              67 %                          18 %                          69 %

                                                                                         Electrical goods

                                                                                      Homeware & Furniture
                                Estonia            Region

                                                                                          Food & Drink
       B2C e-comm.              Mobile e-comm.          Cross-border e-comm.
          0.3 bn                 9 % of total               29 % of total

10
1%
9%
21 %
Card
Cash
Payment
method Bank transfer
breakdown 12 %
E-wallet
Other
57 %
2%
0.1 bn
Cross-border
e-commerce value
Card scheme
breakdown 61 % shop cross-border
Visa
Russia
Mastercard
Germany
98 %
Finland
Estonian Bank Links
11Kazakhstan 34 %
e-commerce growth
Kazakhstan Region World
Population 18.3 m 272.9 m 7.6 bn
Population (15+) 13.1 m 220.7 m 5.6 bn TOP E-COMM SEGMENTS
GDP 170.5 bn 2.4 tr 85.8 tr
GDP per capita 9,331 10,967 11,299
Online population 14 m 188.3 m 4.5 bn
Airlines & Hotels
Smartphone penetration 65 % 57 % 58 %
Average online spend 89 702 2,594
E-commerce % of total retail 7% 5% 16 %
Electrical goods
Banked Credit card Internet
population penetration penetration
59 % 20 % 76 %
67 % 18 % 69 %
Clothing & Footwear
Kazakhstan Region
Media & Entertainment
Homeware & Furniture
B2C e-comm.
1.1 bn
1220 % 20 %
Card
Payment
method Cash
breakdown
Bank transfer
60 %
6%
Top cross-border
markets
Card scheme 50 % shop cross-border
31 % breakdown
Russia
Visa
62 % China
Mastercard
Other
Germany
QIWI Wallet Wallet One
13Latvia 8%
e-commerce growth
Latvia Region World
Population 1.9 m 272.9 m 7.6 bn
Population (15+) 1.6 m 220.7 m 5.6 bn TOP E-COMM SEGMENTS
GDP 34.8 bn 2.4 tr 85.8 tr
GDP per capita 18,089 10,967 11,299
Online population 1.6 m 188.3 m 4.5 bn
Airlines & Hotels
Smartphone penetration 49 % 57 % 58 %
Average online spend 433 702 2,594
E-commerce % of total retail 4% 5% 16 %
Electrical goods
Banked Credit card Internet
population penetration penetration
93 % 17 % 81 %
67 % 18 % 69 %
Media & Entertainment
Latvia Region Clothing & Footwear
Homeware & Furniture
B2C e-comm. Mobile e-comm. Cross-border e-comm.
0.3 bn 8 % of total 28 % of total
145%
14 %
Card
Cash
Payment
method 49 % Bank transfer
breakdown
20 % E-wallet
Other
13 %
17 % 0.1 bn
Cross-border
Card scheme e-commerce value
breakdown 45 % shop cross-border
Visa China: 56 %
Mastercard
UK: 11 %
83 %
Germany: 9 %
Latvian Bank Links
15Lithuania 10 %
e-commerce growth
Lithuania Region World
Population 2.8 m 272.9 m 7.6 bn
Population (15+) 2.4 m 220.7 m 5.6 bn TOP E-COMM SEGMENTS
GDP 53.3 bn 2.4 tr 85.8 tr
GDP per capita 19,090 10,967 11,299
Online population 2.2 m 188.3 m 4.5 bn
Airlines & Hotels
Smartphone penetration 57 % 57 % 58 %
Average online spend 549 702 2,594
E-commerce % of total retail 5% 5% 16 %
Electrical goods
Banked Credit card Internet
population penetration penetration
83 % 16 % 78 %
67 % 18 % 69 %
Media & Entertainment
Lithuania Region Clothing & Footwear
Homeware & Furniture
B2C e-comm. Mobile e-comm. Cross-border e-comm.
0.7 bn 11 % of total 20 % of total
165%
9%
24 %
Card
Cash
Payment
method Bank transfer
breakdown
E-wallet
13 %
Other
49 %
17 % 0.2 bn
Cross-border
Card scheme e-commerce value
breakdown 43 % shop cross-border
Visa Germany
Mastercard
Poland
83 %
Russia
Lithuanian Bank Links
17Romania 30 %
e-commerce growth
Romania Region World
Population 19.5 m 272.9 m 7.6 bn
Population (15+) 16.5 m 220.7 m 5.6 bn TOP E-COMM SEGMENTS
GDP 239.6 bn 2.4 tr 85.8 tr
GDP per capita 12,301 10,967 11,299
Online population 12.4 m 188.3 m 4.5 bn
Airlines & Hotels
Smartphone penetration 60 % 57 % 58 %
Average online spend 804 702 2,594
E-commerce % of total retail 7% 5% 16 %
Electrical goods
Banked Credit card Internet
population penetration penetration
58 % 12 % 64 %
67 % 18 % 69 %
Media & Entertainment
Romania Region Clothing & Footwear
Homeware & Furniture
B2C e-comm. Mobile e-comm. Cross-border e-comm.
3.1 bn 42 % of total 13 % of total
182% 1%
19 %
Card
Payment Cash
method
breakdown Bank transfer
Other
78 %
0.4 bn
Cross-border
Card scheme e-commerce value
45 % breakdown 20 % shop cross-border
54 % Visa Germany
Mastercard
Italy
Hungary
SEPA Direct Debit
19Russia 11 %
e-commerce growth
Russia Region World
Population 144.5 m 272.9 m 7.6 bn
Population (15+) 118.7 m 220.7 m 5.6 bn TOP E-COMM SEGMENTS
GDP 1.7 tr 2.4 tr 85.8 tr
GDP per capita 11,289 10,967 11,299
Online population 109.8 m 188.3 m 4.5 bn
Airlines & Hotels: 18 %
Smartphone penetration 64 % 57 % 58 %
Average online spend 781 702 2,594
E-commerce % of total retail 5% 5% 16 %
Clothing & Footwear: 18 %
Banked Credit card Internet
population penetration penetration
76 % 20 % 76 %
67 % 18 % 69 %
Homeware & Furniture: 11 %
Electrical goods: 10 %
Russia Region
Food & Drink: 9 %
B2C e-comm. Mobile e-comm. Cross-border e-comm.
36.1 bn 29 % of total 28 % of total
203%
37 % Card total
30 % ICS
28 % Card
37 % 7 % MIR
Cash
Payment
method Bank transfer
breakdown
E-wallet 28 % E-wallet total
Other 8 % PayPal
17 %
8 % WebMoney
15 % 6 % Yandex.Money
4 % QIWI Wallet
2 % Other
1%
20 %
10.1 bn
Card scheme Cross-border
breakdown e-commerce value
37 %
Visa
56 % shop cross-border
Mastercard China: 83 %
Local schemes
Other USA: 5 %
42 %
Germany: 2%
QIWI Wallet
21Ukraine 26 %
e-commerce growth
Ukraine Region World
Population 44.6 m 272.9 m 7.6 bn
Population (15+) 37.6 m 220.7 m 5.6 bn TOP E-COMM SEGMENTS
GDP 130.8 bn 2.4 tr 85.8 tr
GDP per capita 3,095 10,967 11,299
Online population 25.5 m 188.3 m 4.5 bn
Airlines & Hotels
Smartphone penetration 48 % 57 % 58 %
Average online spend 149 702 2,594
E-commerce % of total retail 4% 5% 16 %
Clothing & Footwear
Banked Credit card Internet
population penetration penetration
63 % 27 % 57 %
67 % 18 % 69 %
Electrical goods
Ukraine Region Media & Entertainment
Homeware & Furniture
B2C e-comm. Mobile e-comm. Cross-border e-comm.
2.9 bn 10 % of total 12 % of total
222%
5%
5%
28 % Card total
28 % 27 % ICS
Card
1 % PROSTIR
Cash
Payment
method Bank transfer
breakdown
E-wallet
Other
60 %
2%
6%
Card scheme
0.4 bn
Cross-border
breakdown e-commerce value
Visa 26 % shop cross-border
33 % Mastercard
59 % Russia
AMEX
Local schemes
Germany
Other
Poland
QIWI Wallet
23As one of the very first payment service providers, Computop offers its customers around the world local and innovative
omnichannel solutions for payment processing and fraud prevention. The internally developed Computop Paygate payment
platform enables seamless integrated payment processes for e-commerce, at POS and on mobile devices. Retailers and
service providers have the flexibility and freedom to choose from over 350 payment methods enabling them to specifically
tailor their payment options per country. Technologies such as biometric authentication and self-learning algorithms improve
security and convenience for retailers and consumers alike.
Computop, a global player with its head office in Germany and locations in China, England and the USA, has been servicing
large international companies in the service, retail, mobility, gaming and travel industries for more than 20 years. These com-
panies include global brands such as Amway, C&A, Fossil, the entire Otto Group, Sixt, Swarovski and Wargaming. Computop
also provides its payment system to banks and financial service providers as a white-label solution. In total, Computop
processes commercial payment transactions with a combined value of USD 36 billion annually in 127 currencies. With its
individual and secure solutions, Computop makes a major contribution to the future of international payment processing.
Sources: PPRO and Edgar, Dunn & Company
05/20 Copyright 2020 – Computop Wirtschaftsinformatik GmbH • All rights reserved
Computop has been partnering with PPRO for a number of years and many of the alternative payment methods mentioned
in this guide are provided through this partnership. PPRO provides Computop with the ability to accept locally preferred
payment methods like e-wallets, bank transfers, cash, and local cards in more than 175 countries across the globe. Through
one contract and one API.
https://www.ppro.com/almanac
For questions and inquiries about Computop’s solutions, contact a payment specialist in your area
or visit www.computop.com.
Computop GmbH Computop Inc.
T: +49 951–980-0922 T: +1–800–701-7806
sales@computop.com usa@computop.com
Computop Ltd. Computop China
T: +44 1932–895735 T: +86–21-64685053
uk@computop.com info@computop-china.cn
24You can also read