Glenmede Small Cap Equity Second Quarter 2021 Review - Christopher J. Colarik Portfolio Manager

Page created by Marshall Sherman
 
CONTINUE READING
Glenmede Small Cap Equity Second Quarter 2021 Review - Christopher J. Colarik Portfolio Manager
For Institutional Investor Use Only.

Glenmede Small Cap Equity    Christopher J. Colarik
Second Quarter 2021 Review   Portfolio Manager
Equity market review: Russell Index style performance

                                                                                           Second Quarter 2021

      11.9%
                                                                                   11.1%

                                 8.5%
                                                                                                             7.5%

                                                                                                                                        5.7%
                                                          5.2%
                                                                                                                                                                                    4.3%   4.6%
                                                                                                                                                               3.9%

         LG                       LB                        LV                      MG                        MB                        MV                      SG                  SB     SV

                                                        LG – Russell 1000 Growth Index              MG – Russell Mid Cap Growth Index              SG – Russell 2000 Growth Index
                                                        LB – Russell 1000 Index                     MB – Russell Mid Cap Index                     SB – Russell 2000 Index
                                                        LV – Russell 1000 Value Index               MV – Russell Mid Cap Value Index               SV – Russell 2000 Value Index

Source: FactSet
All information is as of 6/30/2021, unless otherwise noted, and is subject to change. Investing involves risk. Past performance is not indicative of
future performance. You cannot invest directly in an Index. See Additional Disclosures at the end of this document. For Institutional Investor Use Only

                                                                                                                                          Clear investor preference for growth
Russell 2000 Index has another strong quarter

                                             Summary performance (%)
                                             As of June 30, 2021
                                                                                                                  2Q21 (%)                    YTD (%)                One year (%)

                                              Glenmede Small Cap Equity (gross)                                         4.8                      19.6                      67.6

                                              Glenmede Small Cap Equity (net)                                           4.5                      19.0                      66.0

                                              Russell 2000 Index                                                        4.3                      17.5                      62.0

                                              Excess return (gross)                                                    0.5                        2.1                      5.2

Source: FactSet. Returns shown are gross of fees.
All data as of 6/30/2021, unless otherwise noted. This represents past performance which is not indicative of future results. As with all investments, loss is possible.
The Russell 2000 Index is an unmanaged, market value weighted index, which measures performance of the 2,000 companies that are between the 1,000th and
3,000th largest in the market. One cannot invest directly in an index. See Additional Disclosures at the end of this document. For Institutional Investor Use Only.

                                                                                                                               GIM Small Cap strategy outperformed for the quarter
Attribution: Quarter-to-date (3/31/2021 – 6/30/2021)

                                                                  Small Cap Equity (%)                                           Russell 2000 %                                      Attribution analysis %
 Sector                                                     Average            Total             Contrib.          Average               Total             Contrib.          Allocation            Selection            Total
                                                             weight           return            to return           weight              return            to return              effect        + Interaction           effect
 Communication services                                            2.1            7.8                  0.2                2.6             33.0                   0.8                 -0.1                   -0.5         -0.6
 Consumer discretionary                                          11.3             1.1                  0.2              14.6                5.8                  0.8                  0.0                   -0.5         -0.5
 Consumer staples                                                  2.2            2.6                  0.0                3.3               2.1                  0.1                  0.0                   0.0          0.0
 Energy                                                            2.7          10.8                   0.3                2.9             20.7                   0.5                  0.0                   -0.2         -0.2
 Financials                                                      17.9             1.0                  0.2              15.9                0.8                  0.2                 -0.1                   0.0          0.0
 Health care                                                     16.9             8.0                  1.4              18.7                2.9                  0.5                  0.1                   0.8          0.9
 Industrials                                                     21.2             2.6                  0.7              15.7                0.4                  0.1                  -0.2                  0.6          0.4
 Information technology                                          12.2             9.6                  1.1              12.5                6.1                  0.8                  0.0                   0.3          0.3
 Materials                                                         4.6            8.8                  0.4                4.6               4.3                  0.2                  0.0                   0.2          0.2
 Real Estate                                                       5.0            8.4                  0.4                6.2               7.4                  0.4                  0.0                   0.0          0.0
 Utilities                                                         2.7            1.5                  0.0                2.7              -1.5                  0.0                  0.0                   0.1          0.1
 Cash                                                              1.1            0.0                  0.0                  --                 --                   --                0.0                      --        0.0
 Total                                                         100.0              4.8                  4.8            100.0                 4.3                  4.3                 -0.3                   0.8          0.5

All data as of 6/30/2021, unless otherwise noted. This represents past performance which is not indicative of future results. Securities mentioned are for informational purposes only and do not represent a
recommendation or an offer to buy, hold or sell any securities. As with all investments, loss is possible. The Russell 2000 Index is an unmanaged, market value weighted index, which measures performance of the
2,000 companies that are between the 1,000th and 3,000th largest in the market. One cannot invest directly in an index. See Additional Disclosures at the end of this document. For Institutional Investor Use Only.

                                                                                                                 Health care and Industrials led while Communication services lagged
2Q21 Contributors and Detractors (3/31/2021 – 6/30/2021)

                                                                          Average           Contribution                                                                                         Average           Contribution
Top five contributors                                                                                                  Top five detractors
                                                                           weight              to return                                                                                          weight              to return

Matador Resources Company                                                       0.8                    0.4             Dycom Industries, Inc.                                                           0.9                   -0.2

NCR Corporation                                                                 1.6                    0.3             La-Z-Boy Incorporated                                                            1.2                   -0.1

AMN Healthcare Services, Inc.                                                   1.2                    0.3             Asbury Automotive Group, Inc.                                                    1.4                   -0.1

Valvoline, Inc.                                                                 1.4                    0.3             Pacira Biosciences, Inc.                                                         0.8                   -0.1

CommVault Systems, Inc.                                                         1.4                    0.3             Virtu Financial, Inc. Class A                                                    0.9                   -0.1

5 Highest                                                                       6.4                    1.6             5 Lowest                                                                         5.3                   -0.7

Source: FactSet
All data as of 6/30/2021, unless otherwise noted. The views expressed represent the opinions of the portfolio managers. For further information relating to the calculation of every holding’s contribution to the strategy’s performance,
contact a GIM representative listed in the end of this presentation. There can be no assurance that the same factors would result in the same decisions being made in the future. This represents past performance which is not indicative
of future results. Securities mentioned are for informational purposes only and do not represent a recommendation or an offer to buy, hold or sell any securities. The holdings above do not represent all the securities purchased, sold or
recommended for the strategy during this period. As with all investments, loss is possible. For Institutional Investor Use Only.

                                                                                                                                           Positive contributors drove return
Composition of Negative Earners in the Russell 2000

                                                         % of Index Weight (Rolling 12 Months)
                                                          Data from August 30, 1993 to June 30, 2021
                                  40

                                  35
                                                                                                                                                                                All Other Sectors

                                  30
% of Index Weight (Rolling 12M)

                                                                                                                                                                                Technology: Other
                                  25

                                                                                                                                                                                Technology: Software & Services
                                  20

                                  15                                                                                                                                            Financials

                                  10                                                                                                                                            Health Care: Pharma, Biotech & Life Sciences

                                   5
                                                                                                                                                                                Health Care: Equipment & Services

                                   0
                                    1994   1996   1998   2000   2002   2004   2006        2008       2010       2012        2014       2016        2018       2020

Source: Glenmede Investment Management LP, FactSet
All information is as of 6/30/2021, unless otherwise noted, and is subject to change. The views expressed represent the opinions of GIM’s portfolio managers. Past performance is not indicative of future results.
Investing involves risk and as with all investments, loss is possible. You cannot invest directly in an index. See Additional Disclosures at the end of this document. For Institutional Investor Use Only

                                                                                                                                           Record high % of negative earners
Growth stocks have led the current market cycle

                                                           Small Cap Value and Growth Stocks                                                                   P/E FWD 4Q - Relative Multiple
                                                      Relative 60-Month Total Returns (Annualized)                                                          Russell 2000 Value vs. Russell 2000 Growth
                                                       December 31, 1978 through June 30, 2021                                                                         As of June 30, 2021
                                         30%                                                                                                       35

                                         25%                                                                                                                                                          Favors Value
Russell 2000 Value less Growth Indexes

                                                                                                                                                   30
  Relative 60-M Return (Annualized)

                                         20%
                                                                                                                                                   25

                                                                                                                           Growth/Value Multiple
                                         15%
                                                                                                                                                   20
                                         10%
                                                                                                             Median
                                                                                                                                                   15
                                          5%                                                                       4.1%
                                                                                                                                                   10
                                          0%
                                                                                                                                                   5
                                          -5%                                                                      -5.1%                                                                  Median: 1.45                      3.09
                                         -10%                                                                                                      0
                                                                                                                                                                                                    Favors Growth
                                         -15%                                                                                                      -5
                                             1983   1988   1992   1996   2000   2004   2008   2012   2016   2020                                     1993    1997    2001     2005    2009     2013      2017        2021

Sources: FactSet and Glenmede Investment Management LP
All data as of 6/30/2021, unless otherwise noted. The views expressed represent the opinions of the portfolio managers. There can be no assurance that the same
factors would result in the same decisions being made in the future. Past performance is not indicative of future performance. For Institutional Investor Use Only.

                                                                                                                                                   Rotation to value leadership could be emerging
Portfolio details
Sector group diversification (%)                                                                                         Top ten holdings                                                                     % Weight

  Communication services                  2.2                                                                            MasTec, Inc.                                                                              1.7
                                                3.7
                                                                                                                         Boyd Gaming Corporation                                                                   1.7
  Consumer discretionary                                                  10.9
                                                                            11.8
                                                                                                                         Evercore Inc Class A                                                                      1.7
         Consumer staples                 2.3
                                             3.2                                                                         First Horizon Corporation                                                                 1.6
                    Energy                      3.4
                                                   4.3                                                                   Core-Mark Holding Company, Inc.                                                           1.6

                 Financials                                                                  17.6                        CommVault Systems, Inc.                                                                   1.6
                                                                                     14.8
                                                                                             17.6                        Valvoline, Inc.                                                                           1.5
               Health care
                                                                                                       21.1
                                                                                                                         F.N.B. Corporation                                                                        1.5
                Industrials                                                                         19.7
                                                                                    14.3                                 Wintrust Financial Corporation                                                            1.5
   Information technology                                                     12.8
                                                                                13.6                                     Diodes Incorporated                                                                       1.5

                  Materials                         4.7                                                                  Total                                                                                    16.1
                                                 3.8

                Real estate                            5.2
                                                             6.8                                                         Market cap
                    Utilities               3.2                                                                          distribution                       Glenmede Small Cap %                        Russell 2000 %
                                          2.4
                                                                                                                         >$3.0 B                                          72.5                                  49.9
                      Cash          0.6
                                  0.0                                                                                    $1.5 B – $3.0 B                                  24.3                                  29.0
                                0.0              5.0               10.0            15.0        20.0           25.0       $500 M – $1.5 B                                   3.2                                  17.3

                                      Glenmede Small Cap Equity               Russell 2000                               < $500 M                                           --                                   3.8

Source: FactSet
All data as of 6/30/2021, unless otherwise noted. This represents past performance which is not indicative of future results. Securities mentioned are for informational purposes only and do not represent a recommendation or an offer
to buy, hold or sell any securities, or all of the securities held in client portfolios. As with all investments, loss is possible. See Additional Disclosures at the end of this document. For Institutional Investor Use Only.

                                                                                                                           Targeting a well diversified strategy with cyclical bias
Characteristics aligned with strategy objective

                                                                                                                    Small Cap Equity              Russell 2000
                                                Price/Earnings (NTM)                                                          16.4                     35.5

                                                Price/Earnings FY2                                                            15.2                     27.0

                                                FY2/FY1 Earnings Growth (%)                                                    2.1                     7.0

                                                PEG Ratio                                                                      1.1                     1.3

                                                Return on Equity (%)                                                           9.8                     0.8

                                                Price/Book                                                                     2.2                     2.5

                                                Dividend Yield (%)                                                             1.0                     0.9

                                                Weighted Average Market Cap (mil)                                           $4,266                   $3,392

Source: FactSet
All data as of 6/30/2021, unless otherwise noted. This represents past performance which is not indicative of future results. As with
all investments, loss is possible. See Additional Disclosures at the end of this document. For Institutional Investor Use Only.

                                                                                                                              Strategy remains undervalued relative to benchmark
Strategy at historic relative lows

                                                                                                               Small Cap Equity vs. Russell 2000 Index
                                                                                                                               P/E NTM (incl neg values)

                                     65                                                                                                                                                         0%

                                     55                                                                                                                                                       -10%
P/E NTM (incl. negative values)

                                                                                                                                                           Relative P/E Premium (Discount)
                                                                                                                                                                                              -20%
                                     45
                                                                                                                                                                                              -30%
                                                                                                                                                                                                                                                                -32.6%
                                     35                                                                                                 34.4
                                                                                                                                                                                              -40%
                                     25
                                                                                                                                                                                              -50%
                                                                                                                                                                                                                                                                -52.2%
                                     15                                                                                                 16.4
                                                                                                                                                                                              -60%

                                       5                                                                                                                                                      -70%
                                        2011 2012 2013 2014 2015 2016 2017 2018 2019 2020 2021                                                                                                    2011 2012 2013 2014 2015 2016 2017 2018 2019 2020 2021

                                                              Glenmede Small Cap                       Russell 2000                                                                                         Median            Relative P/E Premium (Discount)

                                  Sources: FactSet and Glenmede Investment Management LP
                                  All data as of 6/30/2021, unless otherwise noted. The views expressed represent the opinions of the portfolio managers. There can be no assurance that the same
                                  factors would result in the same decisions being made in the future. Past performance is not indicative of future performance. For Institutional Investor Use Only.

                                                                                                                                                                                             Strategy remains positioned in inexpensive stocks
Team contacts

Institutions, Consultants,          Advisors
Platforms and Sub-Advisory
                                    Jason Laird
                                    Business Development Officer
Jeffrey W. Coron, CIMA
                                    Direct: 215-419-6902
Director of Institutional Sales
                                    Email: jason.laird@glenmede.com
Direct: 215-419-6627
Email: jeffrey.coron@glenmede.com
                                    Kevin Heckman, CFA
                                    Business Development Officer
                                    Direct: 215-419-6193
                                    Email: kevin.heckman@glenmede.com

                                    Jarrett Naiden, CIMA
                                    Business Development Associate
                                    Direct: 215-419-6793
                                    Email: jarrett.naiden@glenmede.com
Additional
information
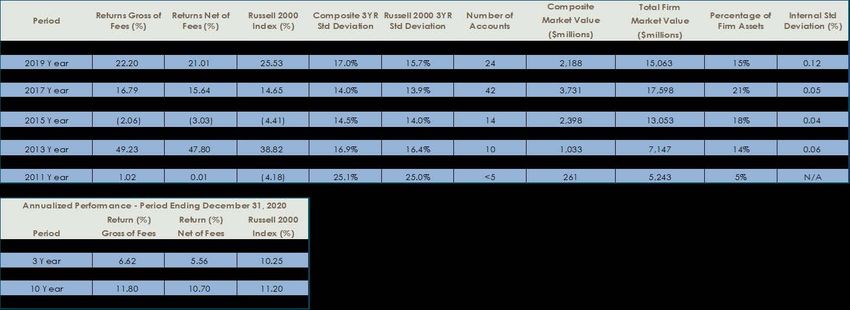
Composite Performance Presentation
Small Cap Equity Composite                                                                                                                                                                       April 1, 1991 through December 31, 2020

Past performance is not indicative of future performance.
Glenmede Investment Management, LP (the “Firm” or GIM) claims compliance with the Global Investment Performance Standards (GIPS®) and has prepared and presented this report in compliance with the GIPS standards. Glenmede Investment
Management, LP has been independently verified for the period of 01/01/1993 to 06/30/2020. The verification reports are available upon request. A firm that claims compliance with the GIPS standards must establish policies and procedures for complying with
all the applicable requirements of the GIPS standards. Verification provides assurance on whether the firm’s policies and procedures related to composite and pooled fund maintenance, as well as the calculation, presentation, and distribution of performance,
have been designed in compliance with the GIPS standards and have been implemented on a firm-wide basis. Verification does not provide assurance on the accuracy of any specific performance report.

Glenmede Investment Management, LP, a registered Investment Advisor, is an affiliate of the Glenmede Trust Company, NA (GTC). Effective January 1, 2007, the Investment Product Management Group of GTC became Glenmede Investment Management, LP.
All performance prior to January 1, 2007, shown here as the performance of GIM, was previously reported as the performance of the Investment Product Management Group of the Glenmede Trust Company. “Firm” assets are defined as all assets managed by
the Glenmede Investment Management, LP. A list of composite descriptions and a list of broad distribution pooled funds are available upon request.

The Small Cap Equity Composite objective is to provide maximum long-term total return consistent with reasonable risk to principal, by investing primarily in common stocks with market capitalization at the time of purchase less than the maximum
capitalization permitted for a stock in the Russell 2000 Index.
Composite Performance Presentation
Small Cap Equity Composite

The composite was created on 05/01/2000 and has an inception date of 04/01/1991. The composite is comprised of all the Glenmede Investment Management, LP Small Cap non-restricted, discretionary and actively managed accounts over $1 million.
Prior to 01/01/2013, the minimum market value was $5 million. Accounts are included in the composite beginning with the first full month of performance through the last full month of performance. Prior to 04/01/2017, accounts were included with the first
full quarter of performance. Accounts falling below the minimum or experiencing net cash flows of 30% or greater of beginning market value are excluded from the composite for that month. Performance results are calculated on a total return basis and
include all realized and unrealized capital gains and losses as well as dividends and interest. Portfolios in the composite presented record transactions based on trade date. Portfolio performance calculations are time-weighted to account for periodic
contributions and withdrawals. Composite returns consist of size-weighted portfolio returns using beginning of period values to weight portfolio returns. Monthly linking of interim performance results is used to calculate year-to-date and annual returns. All
of the composite’s valuations and returns are computed and stated in U.S. Dollars. Policies for valuing portfolios, calculating performance and preparing GIPS reports are available upon request. The gross of fee returns reflect composite performance results
that include transaction costs. Net of fee returns reflect composite performance results that have been adjusted to reflect a deduction for investment management fees at the highest model rate of 1.00% reflected on the performance presentation.

Internal Standard Deviation measures the consistency of a composite’s performance results with respect to the individual portfolio returns within that composite. The dispersion of the gross returns of each composite is calculated by the asset-weighted
deviation method. Only portfolios that have been managed for the full period have been included in the presented dispersion calculations of each composite. For periods with five or fewer portfolios, disclosure of dispersion and the number of accounts is not
presented. The three-year annualized ex-post standard deviation measures the variability of the gross composite and index returns over the preceding 36-month period.

The Russell 2000 Index is an unmanaged, market value weighted index, which measures performance of the 2,000 companies that are between the 1,000th and 3,000th largest in the market. One cannot invest directly in an index.

GIPS® is a registered trademark of CFA Institute. CFA Institute does not endorse or promote this organization, nor does it warrant the accuracy or quality of the content contained herein.
Disclosures
Past performance is not indicative of future results.
All materials presented herewith are illustrative and for discussion purposes with professional or sophisticated investors. This information contains confidential and proprietary information of Glenmede Investment Management, LP (“GIM”) and should be
shared only with those persons assisting a prospect or investor with the selection of managers or investment strategies who agree to keep it confidential. This document should not be circulated to anyone else without the expressed approval of GIM.

Nothing in this document alters the terms and conditions of the relationship between GIM and its client, which are governed by the Investment Management Agreement or other similar documentation. It is not a specific offer of services.

This document has no regard to the specific investment objectives, financial situation or particular needs of any recipient and is not a solicitation or offer to buy or sell securities. Though all factual information herein was gathered in good faith and is
believed to be accurate, no representation or warranty is provided in relation to the accuracy or reliability, nor is this document intended to be a complete statement or summary of the markets, securities, risks or developments referred to. This material
should not be regarded by recipients as a substitute for the exercise of their own judgement. Opinions or objectives expressed herein are the current opinions or objectives as of the dates indicated, and may differ from those expressed by other persons or
business units affiliated with GIM, which may use different assumptions or criteria. GIM is under no obligation to update opinions as they change.

References to the manager’s investment process and objectives, including but not limited to investment screens, portfolio constraints and risk control are intended to provide the recipient with an idea of the portfolio manager’s goals. There is not a
guarantee of such goals will not be changed, or that the current goals can be achieved. No investment is without risk.

All performance results reported are historical. PAST PERFORMANCE IS NOT INDICATIVE OF FUTURE RESULTS. Unless otherwise indicated, performance numbers included herein are reported gross of management fees. You will be charged management
fees and management and other fees reduce returns. To see the performance of the relevant composite net of a standardized set of fees, see the GIPS Compliant Presentation on the prior page. Performance of individual accounts during the indicated
period may be lower or higher than the performance in the composite.

Price to Earnings (P/E): ratio of stock price to earnings. 3-Year EPS Growth: historical earnings per share growth over the last 3 years. Return on Equity (ROE): net income divided by equity. Free Cash Flow Yield: an indicator that compares free cash flow and
market cap. It is a representation of the income (free cash flow) created by an investment. A yield of 12 percent means that a company is generating 12 percent of its Market Capitalization in free cash flow yearly. Dividend Yield: a dividend expressed as a
percentage of a current share price.

The Russell 1000 Growth Index is an unmanaged, market value weighted index, which measures performance of the largest 1,000 companies in the U.S. equity market that have higher price/book ratios and higher forecasted growth values. The Russell
1000 Index is an unmanaged, market value weighted index, which measures performance of the largest 1,000 companies in the U.S. equity market. The Russell 1000 Value Index Is an unmanaged, market value weighted index, which measures the
performance of those 1,000 largest companies in the Russell 3000 Index with lower price-to-book ratios and lower forecasted growth values. The Russell Midcap Growth Index measures the performance of the midcap growth segment of the US equity
universe. It includes those Russell Midcap Index companies with higher price-to-book ratios and higher forecasted growth values. The Russell Midcap Value Index measures the performance of the midcap value segment of the US equity universe. It includes
those Russell Midcap Index companies with lower price-to-book ratios and lower forecasted growth values. The Russell 2000 Index is an unmanaged, market value weighted index, which measures performance of the 2,000 companies that are between the
1,000th and 3,000th largest in the market. The Russell 2000 Growth Index measures the performance of the small cap growth segment of the US equity universe. It includes those Russell 2000 companies with higher price-to-value ratios and higher
forecasted growth values. The Russell 2000 Value Index measures the performance of small-cap value segment of the US equity universe. It includes those Russell 2000 companies with lower price-to-book ratios and lower forecasted growth values. One
cannot invest directly in an index.
Team contacts

Institutions, Consultants,          Advisors
Platforms and Sub-Advisory
                                    Jason Laird
                                    Business Development Officer
Jeffrey W. Coron, CIMA
                                    Direct: 215-419-6902
Director of Institutional Sales
                                    Email: jason.laird@glenmede.com
Direct: 215-419-6627
Email: jeffrey.coron@glenmede.com
                                    Kevin Heckman, CFA
                                    Business Development Officer
                                    Direct: 215-419-6193
                                    Email: kevin.heckman@glenmede.com

                                    Jarrett Naiden, CIMA
                                    Business Development Associate
                                    Direct: 215-419-6793
                                    Email: jarrett.naiden@glenmede.com
You can also read