FOURTH QUARTER February 3, 2020 - Tele2

Page created by Jim Watts
 
CONTINUE READING
FOURTH QUARTER February 3, 2020 - Tele2
FOURTH QUARTER
     February 3, 2020
FOURTH QUARTER February 3, 2020 - Tele2
Group highlights

    SEK billion (YoY organic growth)                Q4 2019                      Jan-Dec 2019                       Guidance

    End-user
    service revenue                                5.0 (0%)                       19.9 (0%)                          ~0%

    Underlying EBITDA
    ex. IFRS 16
                                                  2.4 (10%)                        9.3 (6%)                 Mid-single digit

    Capex ex. spectrum and
    leases
                                                       0.7                              2.4                         2.3-2.6

2                                      Growth numbers based on constant currencies and including Com Hem proforma
FOURTH QUARTER February 3, 2020 - Tele2
Phase 1 completed: Tele2 is now an integrated operator
                  —   Launched FMC more-for-more strategy across all brands - 219k customers now on benefits
                  —   Rebranded Tele2, introduced new family plans and made first ever frontbook price adjustment
    Sweden B2C    —   Launched Com Hem mobile brand
                  —   First year of positive total mobile net intake since 2015, driven by all brands

                  — Separated SME and LE units for more efficient and focused setup
    Sweden B2B    — Built SME commercial unit with new sales capabilities, mobile product portfolio and FMC offer
                  — Added 30k mobile RGUs during the year

                  — Continued great performance
    The Baltics   — Estonia turnaround with full-year growth in end-user service revenue
                  — Created network JV in Latvia and Lithuania

                  —   Focused geographical footprint with Kazakhstan and Netherlands transactions completed
                  —   Finished Com Hem integration with synergy run-rate of 800m
      Group
                  —   Changed organizational structure, removed group functions, set up for a lean, flat organization
                  —   Paid SEK 7.2 billion in dividends while reducing leverage from 2.8x to 2.5x

3
FOURTH QUARTER February 3, 2020 - Tele2
Smartest telco in the world
    creating a society of unlimited possibilities

4
FOURTH QUARTER February 3, 2020 - Tele2
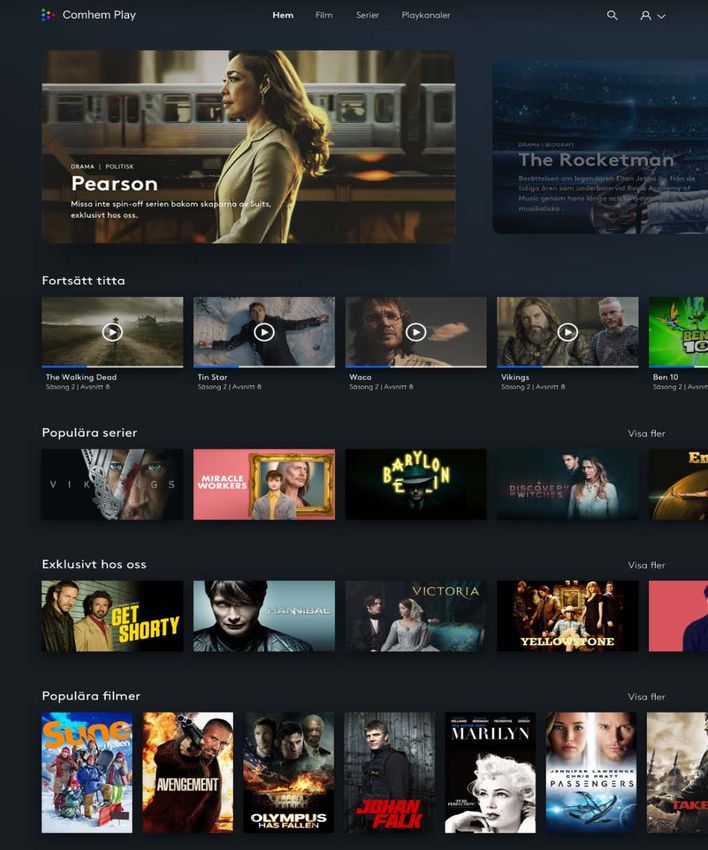
Phase 2 initiated: become the smartest telco in the world
                  —   Continue more-for-more FMC strategy to reduce churn and build pricing power
                  —   Two new growth drivers – launching standalone OTT service and new digital FMC brand
    Sweden B2C    —   Backbook pricing to be initiated in Q1 2020
                  —   Optimize brand portfolio over time

                  — Aiming for gradual improvement and eventual turnaround
    Sweden B2B    — SME: use foundation built in 2019 to take market share and reduce churn
                  — LE: focus on private sector, take high-margin contracts and improve profitability

                  — Continue great momentum
    The Baltics   — Capitalize on mobile-centric-convergence strategy with launch of TV-offers
                  — Investigate need for fixed services

                  — New vision: Tele2 to become the smartest telco in the world
      Group       — New three-year transformation program with at least SEK 1 billion in opex reduction
                  — Secure excellent network quality through rollout of 5G and remote PHY

5
FOURTH QUARTER February 3, 2020 - Tele2
SWEDEN
Sweden Consumer
     RGUs & net intake - core and legacy services                                 ASPU year-on-year growth                                                        End-user service revenue*
     (thousands, proforma)                                                        (% proforma)                                                                    (SEK million, proforma, year-on-year growth %)

                                                                                 5%
                                   +34            +35              +23                                                                                        +4%            +3%            +2%           +3%           +2%
 +28              +20

                                                  664               665          3%                                                                                                                       454           451
 658               661              663                                                                                                                       474            466            464
                   +3               +2             +1                +1                                                                                                                     -3%           -4%           -5%
 +3                                                                                                                                                           +0%            -1%
                                                                                  1%
 827               839              852           863               873                                                                                                                                   632           640
         -81                                                        +10
                                                                                                                                                  +0.1%       613            618            627
 +13               +12    -49       +13    -12    +11     -11              -56   -1%                                                                          +10%                          +5%           +5%           +4%
                                                                                                                                                                             +8%
         325                                                                                                                                       -1.3%
                          313              298            286              282
         399              387              378            368              357
                                                                                 -3%                                                                                  -12%           -11%           -8%           -6%           -7%
                                                                                                                                                                       116           106            98            96            90
 1,817            1,822            1,841          1,863            1,875                                                                                      1,122                         1,123         1,173         1,160
                                                                                                                                                                             1,111
                                                                                 -5%                                                                                  353            341            344           340           326
 +12     1,131     +5 1,105         +19 1,117     +23 1,128         +11 1,088                                                                                 +3%            +2%            +2%           +4%           +3%
                                                                                                                                                   -6,1%              270            260            272           285           268
                                                                                 -7%
 Q4 ’18            Q1 ’19           Q2 ’19         Q3 ’19           Q4 ’19              Q4 ’18           Q1 ’19       Q2 ’19        Q3 ’19     Q4 ’19         Q4 ’18         Q1 ’19         Q2 ’19        Q3 ’19        Q4 ’19
Core:            Mobile Postpaid       Fixed Broadband      Digital TV Cable &                                                           Digital TV Cable &
                                                                                       Mobile Postpaid            Fixed Broadband
                                                            Fiber                                                                        Fiber
Legacy:          Mobile Prepaid        DTT TV               Fixed Tele & DSL

     Q4 highlights
     –     Continued momentum in postpaid volume with the sixth consecutive quarter of positive net intake while ASPU was flat as effects from 2020 backbook price
           increase not expected until Q2 2020
     –     Stable net intake in fixed broadband and DTV cable & fiber but smaller price increases compared to last year remain a drag on ASPU while impact from 2020
           backbook price increases expected from Q2 2020
     –     Total end-user service revenue roughly flat as growth in postpaid and fixed broadband was offset by DTV and fixed telephony & DSL
 7
                                *End-user service revenue differs from previously reported numbers due to retroactive reclassification of revenue, as communicated on January 16, 2020
Penny: The only FMC-offer in the digital no-frills segment

    A future telco supported by a unique FMC-offering

    Launching a digitally disruptive FMC brand to grab a fair share of the growing no-frills
    segment.

    Proposition
    — For the modern Swede who’s adopted Spotify, Airbnb, who swish, swipe and doesn’t
      mind looking a bit uncool while riding a Voi
    — Penny is a simple app for Mobile, Broadband, and TV
    — Positioned in the no-frills segment targeting ”status seekers” and ”price hunters”

    Go to market plan
    — First launch in February offering Mobile and Broadband
               — Mobile: Free voice and text and a choice of 3, 6, 15 and 40 GB data
               — Broadband: First launch in coax and later available in open LAN
    — Full-service launch in early Q2 including an entertainment offering

8
Comhem Play+: Launching our own streaming service

    Taking the next step to solidify our leadership in the TV market

    Entering the rapidly growing SVOD segment by leveraging our platform, content
    agreements, and the entire Tele2 Sweden customer base. A natural next step in our TV
    transformation and a powerful tool in the FMC strategy.

    Three main pillars building Comhem Play+
    — Attractive content. Leverage our ability to bundle best on-demand content
    — Great customer experience. Enhancing the existing Comhem Play app
    — Rollout boosted by existing customer relationships and sales channels

    Roll-out plan
    — 12 months discount to existing Tele2 Sweden customers to build volume and
      enhance customer loyalty
    — Gradual roll-out per brand to our existing customer base aimed to be fully
      completed by July 2020
    — 1 month free for non Tele2 Sweden customers
    — Price point at 69 SEK/month

9
Sweden Business
     Mobile RGUs & net intake                                       Mobile ASPU                                                         End-user service revenue*
     (thousands, proforma)                                          (SEK, proforma)                                                     (SEK million, proforma, year-on-year growth %)

                                                                  200                                                                  -1%           -2%                                      -2%
                                                                                                                                                                   -3%           -3%
                                                                   190
                  +7         +17           +4           +3                                                                              276
     +8                                                                                                                                              264           282           257           288
                                                                   180                                                                 +3%           +0%                                       +4%
                                                                                                                                                                   +6%           +4%
                                                                   170                                                   163           296           295           276           271           271
                                                                   160                                                                 -12%          -9%           -11%          -12%          -8%
 889             896         913          916           920
                                                                   150
                                                                   140                                                                  510          500           482           490           502

                                                                   130                                                                 +5%           +1%           -3%           -1%           -2%

Q4 ’18          Q1 ’19     Q2 ’19       Q3 ’19        Q4 ’19                Q4 ’18     Q1 ’19     Q2 ’19     Q3 ’19     Q4 ’19          Q4 ’18       Q1 ’19      Q2 ’19       Q3 ’19        Q4 ’19
                                                                                                                                                   Mobile          Fixed        Solutions

     Q4 highlights
     –    Continued volume growth with a net intake of 3,000 in the quarter driven by lower churn and new sale sin both SME and Large Enterprise
     –    Total end-user service revenue (including IoT) declined by 2 percent driven by price pressure in the mobile market (-9% mobile ASPU) and continued decline in
          legacy fixed services
     –    Continued improvement in Solutions business with greater mix of higher-margin revenue

10
 *End-user service revenue differs from previously reported numbers due to retroactive reclassification of revenue and inclusion of IoT EUSR within Sweden Business, as communicated on January 16, 2020
Sweden overview
     End-user service revenue                                        Underlying EBITDA ex. IFRS 16 and margin                         Underlying EBITDAaL - Capex* and cash
     (SEK million, proforma, year-on-year growth %)                  (SEK million, proforma)                                          conversion, rolling 12m (SEK million, proforma)

                                                                                               +11%                                                                             5,480
                                                                                                                                       5,216     5,200      5,212     5,251
         -1%      -1%        -2%         0%          -1%
                                                                                                           2,032     1,925     100%
     1,083
                                                             2,000                1,842        1,792
                  1,059     1,040       1,018        1,061           1,741                                                     90%
                                                                                                                                        73%
                                         -3%         -2%                                                                                          72%       72%        71%       73%
         -1%       -2%       -3%                                                                                               80%
                                                             1,500                                                             70%
                                                                                                                               60%
                                                             1,000                                                             50%
     3,125        3,078     3,105       3,156        3,111                                                     37%             40%
                                                                                   33%          32%                   33%      30%
                                                                      29%
         -1%       -1%       -1%         +0%          -0% ,500
                                                                                                                               20%
                                                                                                                               10%
                                                                ,0                                                             0%
     Q4 ’18       Q1 ’19    Q2 ’19     Q3 ’19       Q4 ’19           Q4 ’18       Q1 ’19      Q2 ’19       Q3 ’19    Q4 ’19           Q4 ’18     Q1 ’19    Q2 ’19    Q3 ’19    Q4 ’19
               Consumer              Business (incl. IoT)

     Q4 highlights
     –    Total end-user service revenue decreased by 1%, with consumer roughly flat while business continued to decline
     –    Underlying EBITDA excluding IFRS 16 increased by 11% (9% excluding profit from sale of bad debt), driven by cost reduction
     –    Strong cash conversion of 73% LTM due to low capex spend in between investment cycles

                                                                              *Capex ex. spectrum and leases
11
                                                       Cash conversion = (Underlying EBITDAaL – Capex) / Underlying EBITDAaL
BALTICS
Baltics – Operational highlights
     RGUs & net intake – mobile services                                                         ASPU year-on-year growth
     (thousands)                                                                                 (%)

          -35                -14          +41             +28              -18
                                                                                                                                                                           +11%
                                                                                                  8%                                                                       +7%
                                                          1,902
                                                                                                                                                                           +6%
         1,861              1,857         1,875                            1,895
                                                                                                  3%

                                                                                                 -2%
          951                946          961              963             954

          437                431          439              440             437                   -7%
         Q4 ’18             Q1 ’19       Q2 ’19          Q3 ’19           Q4 ’19                          Q4 ’18             Q1 ’19    Q2 ’19         Q3 ’19          Q4 ’19
                  Estonia              Latvia                Lithuania                                             Estonia             Latvia                  Lithuania

     Q4 highlights
     –     Net intake impacted by seasonal mobile prepaid churn in all three countries
     –     Continued ASPU growth in all three countries driven by successful upselling in Lithuania and continued effect from price increases in Latvia and Estonia

13
Baltics – Financials
     End-User service revenue                                          Underlying EBITDA ex. IFRS 16 and margin                          Underlying EBITDAaL - Capex* and cash
     (SEK million, year-on-year growth %)                              (SEK million)                                                     conversion, rolling 12m (SEK million)

                                        +10%            +8%                                 +9%                               1,400                                                 1,295    100%
                              +6%                                                                                                                                          1,255
         +7%       +7%                                                                                                                             1,165     1,205
                                                                 500
                                                                                                                              1,200
                                                                                                                                   80%    1,115                                              90%
                                                                                                          436         420
                                                                 450                         413                              1,00070%
                                           391           392 400        374        385                                                                                                       80%
                              368                                                                                                                                           78%      79%
         351        351                                          350
                                                                                                                                   60%    76%      77%        77%
                                                                                                                               ,800
                                           +12%         +8% 300                                                                    50%                                                       70%
                              +7%
         +14%      +11%                                                                                                        ,60040%
                                                                 250
                                                                 200               34%       35%          34%         32%                                                                    60%
                                           222           217            31%                                                    ,40030%
         197        199       219                                150
         +5%       +6%        +10%         +9%          +7%                                                                        20%
                                                                 100                                                           ,200                                                          50%
                                                                  50                                                               10%
         114        110        116         125           129
         -7%        -3%       -2%          +8%          +9%       0                                                              ,00%                                                        40%
     Q4 ’18       Q1 ’19     Q2 ’19    Q3 ’19           Q4 ’19         Q4 ’18      Q1 ’19   Q2 ’19       Q3 ’19      Q4 ’19              Q4 ’18   Q1 ’19    Q2 ’19         Q3 ’19   Q4 ’19
                 Estonia      Latvia        Lithuania

     Q4 highlights
     –     Total end-user service revenue increased by 8% and underlying EBITDA excluding IFRS by 9% with growth in all three countries in the quarter
     –     Operational improvements in Estonia resulted in end-user service revenue returning to growth for the full year
     –     Strong cash conversion of 79% LTM due to low capex spend in between investment cycles

                                                                                                                      *Capex ex. spectrum and leases
14
                                 Organic      Adjusted for currency rate movements and M&A
                                                                                                   Cash conversion = (Underlying EBITDAaL – Capex) / Underlying EBITDAaL
FINANCIAL OVERVIEW
Group results Q4 2019
     SEK million                           Q4 2019       Q4 2018*             Comments
     Revenue                                    7,270           6,606          1   Items affecting comparability mainly include cost related to
     Underlying EBITDA                          2,695            1,875             the integration with Com Hem

     Margin (%)                                  37%              28%          2   D&A includes SEK 305m amortization of surplus value from
     Items affecting comparability          1   -104             -347
                                                                                   acquisitions (SEK 199m in Q4 2018) and SEK 320m
                                                                                   depreciation of right-of-use assets (leased assets)
     D&A                                    2   -1,391           -867
                                                                               3   Tax cost in Q4 2018 was elevated due to an impairment of
     Impairment                                    -1                0
                                                                                   deferred tax assets
     JVs and associated companies                 -20               -5
                                                                               4   Significant improvement to net profit due to Com Hem
     Operating profit                           1,179             656
                                                                                   merger and transaction in the Netherlands removing negative
     Interest income/expenses                    -110             -94              drag
     Other financial items                         -11             -17
     Taxes                                  3   -268            -1,224
     Net profit, continuing operations           790             -679
     Net profit, discontinued operations          153             350
     Net profit, total operations           4    943             -329

16
                                                   *Com Hem included from November 5, 2018
Group cash flow Q4 2019
                                              Q4       Q4        FY      Comments
     SEK million
                                             2019     2018      2019
                                                                         1   EBITDA from discontinued operations impacted by positive
     Underlying EBITDA, continuing                                           effect from earnout related to the sale of Tele2 Austria
                                              2,695    1,875    10,525
     operations
     Items affecting comp., continuing
                                              -104     -347       -711   2   Capex paid lower year-on-year as Q4 2018 included capex
     operations
                                                                             related to assets in Kazakhstan and the Netherlands which are
     EBITDA continuing operations             2,591    1,527     9,814       now divested
     EBITDA discontinued operations      1     239       617    3,089
                                                                         3   Working capital turned negative in Q4 2019, mainly due to
     Amortization of lease liabilities         -313        0    -1,269       seasonal effect of holiday equipment sales
     Capex paid                          2    -665     -1,129    3,607
                                                                         4   Taxes paid were positive in the quarter due to regained
     Changes in working capital          3     -271    -508       -179       withholding tax related to the former shareholder loan in
                                                                             Kazakhstan and repaid preliminary tax in Sweden
     Financial items paid / received           -83     -342      -466

     Income taxes paid                   4      92      -121     -798    5   Other cash items include a reversal of the earnout related to
                                                                             the sale of Tele2 Austria as the cash was received in January,
     Other cash items                    5    -104        43    -1,745       2020
     Equity free cash flow, total
                                              1,484       86    4,840    6   FY2019 equity free cash flow from continuing operations
     operations
                                                                             amounted to SEK 4.3 billion (SEK 4.8 billion from total
     Of which continuing operations      6    1,255      171    4,329        operations) or approximately SEK 6 per share
     Of which discontinued operations          229       -85       511
17
Leverage at 2.5x
            Economic net debt to underlying EBITDAaL*                                                             Comments
            (SEK billion)

                                                                                                                  – Economic net debt reduced by SEK 3.1 billion compared to
                                                                                                     2.8            December 2018 as SEK 7.2 billion in shareholder
27.8          2.8                                                                                                   remuneration was covered by cash flow generation,
                                                                                                     2.8
                                                                                                                    proceeds from divestments and repayment of the
                             2.6                                   2.6                                              shareholder loan in Kazakhstan
27.8
                                                                                       2.5           2.8
                                                2.4                                                               – Leverage at lower end of 2.5-3.0x target range ahead of
                                                                                                     2.8
27.8                                                                                                                distributing shareholder remuneration
             27.8
                             25.1                                 24.4                24.7           2.8          – Proposed ordinary dividend of SEK 5.50 per share (SEK
27.8
                                               22.1
                                                                                                                    3.8bn), in two equal tranches + extraordinary dividend of
                                                                                                     2.8
                                                                                                                    SEK 3.50 per share (SEK 2.4bn)
27.8
                                                                                                     2.8

27.8                                                                                                 2.8
            Q4 ’18          Q1 ’19            Q2 ’19             Q3 ’19              Q4 ’19

                                     Economic net debt           Leverage

                                                Economic net debt = Net debt excluding lease liabilities. Prior to the completion of the Kazakhstan divestment,
                                                   also liabilities to Kazakhtelecom, liability for earn-out obligation in Kazakhstan and loan guaranteed by
                                                                                           Kazakhtelecom are excluded
                                                                             *EBITDAaL for total operations at the time of reporting
       18
Com Hem synergy update – cost program completed
                                                     Realized in Q4 2019                            Realized in 2019                          Run-rate
                                                                                                                                      (Annualized at end of 2019)

         Opex synergies
             (SEK million)                                  200                                         500                                 800
                                                                    Almost 3/4 of overlapping customer base on FMC benefits
             Revenue
                                                               New FMC brand in the digital no frills segment to be launched in 2020
             synergies                                            OTT service to be rolled out to entire customer base in 2020

     Comments
     –   We realized additional synergies with an impact of roughly SEK 200m in the quarter leading to a total of SEK 500m in 2019
     –   Annualized run-rate of SEK 800m already reached after one year and the remaining SEK 100m will be rolled into the new three-year program
     –   Integration cost of SEK 101m incurred in the quarter, with a total of SEK 780m incurred since the start of the integration
     –   Continued progress on revenue synergies with 3/4 of overlapping base on FMC-benefits, pricing on track for Q1 2020 and new services to be launched

19
New business transformation program to become
the smartest telco in the world
     At least SEK 1 billion of cost reduction in three years
     — In addition to the run-rate of SEK 800 million already achieved in 2019
     — Executed in 2020-2022, with back-end loaded delivery of cost reduction

     Aiming for radical simplification                              A winning customer focus
     — Removing legacy IT-systems: The number of IT                 — Reduce brand portfolio to increase commercial
       systems will be reduced by half, to greatly                    fire power and focus
       decrease IT-spend and improve support for the                — Simplifying product portfolio in connection to the
       entire organization                                            IT transformation, will simultaneously let us serve
     — Overall simplification of organizational structure             customers even better
       and operating model, to be flat and fast                     — Our dedicated efforts to ensure the most reliable
     — Increasing automation of processes and become                  network continues with the rollouts of 5G and
       even more agile in our way of working                          Remote-PHY

20
Guidance for 2020 and the mid-term
                    End-user service revenue                            Underlying EBITDAaL                     CAPEX1
                            unchanged                                            unchanged                   2020, updated

     Mid-term       Low-single digit                                 Mid-single digit
                                                                                                              2.8-3.3
     ambition          growth                                           growth

                    Low-single digit                                 Mid-single digit
      2020                                                                                                   2.5-3.0
                       growth                                           growth
                –   Gradually ramping up through                –    Driven by a combination of   –   Mid-term capex guidance fully
                    FMC cross-sell, monetization of                  revenue growth and cost          reflects planned rollout of 5G
                    customer      satisfaction   and                 reduction                        and Remote PHY
                    addition of new growth drivers
                                                                                                  –   Expect rollout of 5G to begin in
                                                                                                      second half of 2020

                                Based on continuing operations in constant currencies
                                    1 SEKbn   excl. spectrum and leased assets
21
TO CONCLUDE…
Key priorities going forward
Reignite end-user service revenue growth in Sweden
B2C: Win the Swedish household through FMC

—    Execute launch of two new growth drivers: the standalone OTT service
     Comhem Play+, and the new digital FMC brand PENNY

—    Address remaining overlap and monetize increased customer satisfaction
     through price adjustments

B2B: Execute on turnaround

—    SME: use foundation built in 2019 to take market share and reduce churn

—    LE: focus on private sector, take high-margin contracts and improve
     profitability

Execute vision to become the smartest telco in the world
—    Transform organization to support growth through simplification,
     reduction of silos, and smarter use of resources

—    Remove legacy IT systems and transform the Swedish organization,
     reducing opex by at least SEK 1 billion over three years

Build on the momentum in the Baltics
Close the sale of Croatia
Prepare for rollout of 5G and remote PHY
23
THANK YOU!

24
You can also read