Full year results presentation - 52 Weeks to 30 December 2018 - The Restaurant Group
←
→
Page content transcription
If your browser does not render page correctly, please read the page content below
Full year results presentation
52 Weeks to 30 December 2018
2018 FY highlights

• Acquisition of high quality business in Wagamama which has continued to outperform the sector

• Concessions business opened 21 new units and entered 4 new airports

• Pubs business increasingly outperformed the market and opened a record 21 pubs

• Leisure business improved like-for-like sales momentum in every quarter in 2018

• Group delivered like-for-like sales growth since the World Cup

                             Enlarged group now strongly orientated towards growth

2   2018 Full year results
A diversified business aligned to structural growth trends

                                               Wagamama                      Concessions                      Pubs                          Leisure

                                             • UK leader in pan-           • Market leader in UK      • Market leading                • Casual dining
                                               Asian cuisine                 airports                   premium food-led                restaurants spanning
                                                                                                        pub restaurants                 the UK across
                                             • Significant and             • Strong brand and                                           multiple brands
                                               consistent                    operational              • Attractive market
    Diversified                                outperformance in             capabilities create        dynamics                      • Optimising
    growth                                     core UK market                high barriers to entry                                     performance but
    business                                                                                          • Healthy pipeline of             exposed to structural
                                             • Well aligned to key
                                                                           • Consistent track           new openings                    headwinds
                                               structural trends;
                                                                             record of growth and
                                               speed, convenience,                                    • Freehold asset base in
                                                                             site renewals                                            • Capitalising on “off-
                                               delivery and healthy                                     excess of £90m                  trade” opportunities
                                               options

                                             141 sites / 58 franchised             71 sites                   82 sites                        367 sites

                                                                            70% Outlet EBITDA*                                         30% Outlet EBITDA*

                                                                                                                              Delivery &
    Multiple                                  Wagamama                 UK               Premium       International                               Food-to-go
                                                                                                                               delivery
    growth drivers                               UK                Concessions            pubs        opportunities                                formats
                                                                                                                               kitchens

*FY 2018 (Jan-Dec) Pro-forma outlet EBITDA

3       2018 Full year results
Financial review

2018 Full year results

4
Financial summary
                                                                                                 2018 FY         2017 FY     %
                                                                                                52 weeks        52 weeks   Change
Column1                                                                                            £m              £m

Revenue                                                                                              686.0       679.3      +1.0%

Like-for-like                                                                                                              (2.0%)

EBITDA*                                                                                                  87.9     95.8     (8.3%)

EBITDA margin*                                                                                      12.8%        14.1%

EBIT / Operating profit*                                                                                 55.4     59.5     (6.9%)

Operating margin*                                                                                    8.1%         8.8%

PBT*                                                                                                     53.2     57.8     (8.1%)

Earnings per share*                                                                                  14.7p       16.7p     (11.9%)
* Adjusted (pre-exceptional charge)

Dividend per share                                                                                   8.27p       17.4p

Note: Earnings per share adjusted for bonus element following the rights issue in both financial years

5        2018 Full year results
Exceptional charges FY 2018

                                                                    Onerous lease            Impairment of                      Total
                                                                     provisions             property, plant &
                                                                                               equipment
                                  Column1                                   £m                     £m                            £m

Exited sites                                                               (5.2)                        -                       (5.2)

Distressed/closure sites                                                   15.2                       14.0                      29.2

Acquisition and refinancing                                                   -                         -                       15.2

2018 Exceptional charge                                                    10.0                      14.0                       39.2

    • Successfully exited 34 out of the original 41 closure sites (closed in 2016 and 2017) at lower than expected onerous lease cost

    • Following disciplined management reviews during 2018, 18 leisure sites in total have closed or are marked for closure

    • £2.3m impairment due to trading conditions in specific locations; £11.7m impairment following changes to accounting policy

6        2018 Full year results
Group cost headwinds expected FY 2019

£m
30

                                                                                           3                     10
25
                                                                   4
20
                                             5
                                                                                                                                 14
15
                  12

10

    5

    0
            Wage inflation        Purchase cost inflation    Rent and rates            Utilities             Mitigation   Net cost increase

        • Mitigating c.40% of 2019 cost increases (excluding synergies):
             –    Continued focus on labour scheduling and optimising deployment
             –    Continuing to leverage our purchasing scale across the wider group
             –    Further site-level overhead savings identified
             –    Ongoing negotiations with landlords on rent reviews and appeals with local councils on business rates

7        2018 Full year results
Acquisitions and capital expenditure
                                                                                             2018 FY               2017 FY
                                       Column1                                                 £m                    £m
Dev elopment expenditure                                                                       33.0                  18.4

Acquisitions of Ribble Valley and Food & Fuel                                                  15.2                    -

Refurbishment and maintenance expenditure                                                      20.3                  14.9

Total capital expenditure (excluding Wagamama)                                                 68.5                  33.3

Number of new units (excluding Wagamama)                                                        43                    17

Acquisition of Wagamama                                                                       349.0                    -

Total capital expenditure (including Wagamama)                                                417.5                  33.3

Number of new units (including Wagamama)                                                       183                    17

    • Core development expenditure in FY18 primarily relates to 21 new Concessions sites and 6 single site Pub acquisitions

    • The acquisitions of “Ribble Valley Inns Ltd” and “Food & Fuel Ltd” added 15 pubs to our portfolio

    • Refurbishment and maintenance expenditure increased in FY18 due to Frankie and Benny’s capital refreshes and Firejacks
      conversions

8        2018 Full year results
Cash flow
                                                       2018 FY   2017 FY
                                                         £m        £m                    Capital structure
Column1
Adjusted operating profit*                              55.4      59.5
      Working capital and non-cash adjustments           0.4      12.0     • £220m Group RCF facility:
      Depreciation                                      32.5      36.3
                                                                             – TRG £200m RCF until December 2021
Cash inflow from operations                             88.3      107.8
      Net interest paid                                 (1.0)     (0.7)      – Wagamama £20m RCF until December
      Tax paid                                          (7.4)     (7.1)        2021
      Refurbishment and maintenance expenditure        (20.3)    (14.9)
Free cash flow                                          59.6      85.1
      Dev elopment expenditure                         (33.0)    (18.4)    • Wagamama bond:
      Acquisitions of Ribble Valley I nns and Food &
                                                       (14.8)       -        – £225m bond nominal value
      Fuel net of cash acquired
      Mov ement in capital creditor                      5.8      (5.9)
                                                                             – 4.125% coupon rate
      Div idend paid                                   (34.9)    (34.9)
      Utilisation of onerous lease prov isions         (11.2)    (12.7)      – Matures July 2022
      Restructuring costs                                 -       (6.8)
      Acquisition of Wagamama net of cash
                                                       (310.1)      -
      acquired
                                                                           • Leverage:
      Debt acquired on acquisition of Wagamama         (225.0)      -
      Acquisition and refinancing exceptional costs     (10.1)      -
      Proceeds from issue of share capital              305.8       -
                                                                             – Pro-forma net debt / EBITDA is 2.2x
      Other items                                        (0.1)     0.5
Cash inflow                                            (268.0)     6.9
                                                                             – Anticipate net debt / EBITDA to be below
                                                                               2.0x by December 2020
Net debt at start of period                            (23.1)    (30.0)
Net debt at end of period                              (291.1)   (23.1)
* Adjusted (pre-exceptional charge)

9      2018 Full year results
FY19 Guidance
 •   2019 development capital expenditure – £55m to £60m
      –    At least 7 new Pubs
      –    Between 5 to 10 new Concessions sites in 2019, and initial expenditure on units in Manchester terminal redevelopment
      –    At least 6 new Wagamama sites (3 UK , 1 airport , 2 US)
      –    8 Leisure site conversions to Wagamama
      –    Roll-out of delivery kitchens and pilot of Wagamama Grab & Go concept

 •   2019 refurbishment and maintenance capital expenditure – £30m to £35m
      –    6 transformational refurbishments of Wagamama UK sites
      –    Several large-scale Concessions redevelopment projects

 •   Depreciation expected to be between £53m to £55m

 •   Interest guidance:
      –    Debt interest expected to be between £14.5m to £15.5m
      –    Provision interest expected to be between £1m to £1.5m

10   2018 Full year results
Business review 2018 Full year results 11
Our priorities

     1

           Deliver the benefits of the Wagamama acquisition

     2

           Grow our Concessions and Pubs businesses

     3

            Optimise our Leisure brands

12       2018 Full year results
1
Strengths of the Wagamama business
Aligned to key structural growth trends Strong high-performing culture
Experience ratings vs market (% outperformance) • High quality leadership team focused on
continuing growth momentum
18% • Strong cohesive culture well maintained
16% as business continues as a standalone
entity
14%
12% • Restaurant teams motivation levels
remain high and churn remains low
10%
8%
6%
4%
2%
0%
Healthiness Freshness Quality of Flavour of Different Ease of Speed of Speed of
of food of food ingredients food dietary ordering service payment
offers process
Health Convenience Speed
Source: Morar/Brandvue, Q4 2018 customer experience ratings
13 2018 Full year results1
Strong LFL sales momentum set to continue
Drivers of 2019 LFL growth
Proposition refinement
• Development of drinks range to increase
participation
UK LFL revenue growth outperformance
• Investment in local marketing and events to drive
Wagamama LFL revenue growth % greater awareness in non-users
Coffer Peach Tracker performance
16.2% • Further expansion of vegan range
12.7% 13.1%
11.3%
11.9% 12.0% Further delivery growth
10.0% 9.8%
9.3% 9.1% 9.1%
8.5% 8.2% 7.7% 8.5%
7.4% • Increased delivery penetration across restaurants
6.7% 7.1%
5.4%
• Technology integration to optimise delivery capacity
within and between restaurants
Benefits from refurbishments
Q1
Q2
Q3
Q4
Q1
Q2
Q3
Q4
Q1
Q2
Q3
Q4
Q1
Q2
Q3
Q4
Q1
Q2
Q3
FYE Apr-15 FYE Apr-16 FYE Apr-17 FYE Apr-18 FYE Apr-19
• 300 new covers to be created from 6
transformational refurbishments
• 40% return on capital from refurbishments
generated historically
14 2018 Full year results1
Progressing well on multiple growth avenues
• 3 to 4 new openings
UK Casual Dining • 8 site conversions
Canary Wharf post refurbishment
• 6 transformational refurbishments
• Won tender in Heathrow T3 - opens in H2 19
• Secured site in planned redevelopment of Manchester Airport
UK Concessions due to open in H1 20
Heathrow T3 design • Exploring variety of other airport opportunities
• Delivery kitchen successfully trialled
Delivery
• Delivery kitchen rollout in FY19
• 2 new US restaurants in FY19
International
• Initiated a review of US strategic options
Murray Hill, NYC
• Grab & Go concept developed to capitalise on increased
Food to go formats customer demand for convenience
• Initial pilot planned for launch in H2 19
Note: All years (i.e. FY and HY1/H2) mentioned above relate to the calendar year January-December
15 2018 Full year results1
Revenue and cost synergies
Site conversions Cost synergies
• Cross-functional working groups
collaborating across the business
• Continued confidence in delivering at
least £15m of cost synergies in 2021
• Synergies to be achieved through
leveraging scale and consolidating spend
across the following cost categories:
– Procurement and logistics
• 8 conversions planned for this year
Virtual walk-through*
• Phased openings between August – Site level overheads
and November
– Central costs
• Expect >50% return on capital
*Usage Instructions-iOS users with iOS 11 or later - simply open the camera app and point it at the code. Tap the notification that pops up to follow the link. Android and older iOS users will need to download a
QR Code Reader from the app store on their device
16 2018 Full year resultsOur priorities
1
Deliver the benefits of the Wagamama acquisition
2
Grow our Concessions and Pubs businesses
3
Optimise our Leisure brands
17 2018 Full year results2
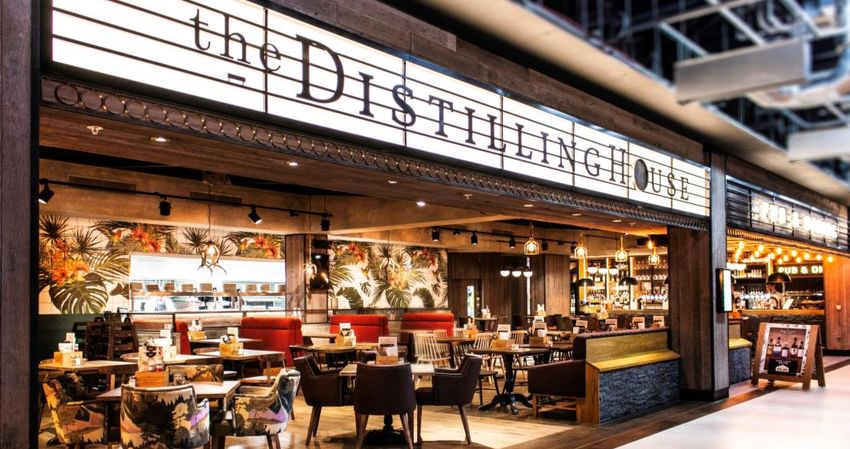
Growing our Concessions business
• Operational across:
– 64 sites within 16 UK Airports
Current
portfolio – 5 sites within 4 UK rail stations
– 2 other sites
– 5 grocery counter sites
• Sales continue to outpace passenger growth
Core
business • 21 new openings in FY2018
successfully • Expect to open 5 to 10 new Concessions in FY2019
grown • Secured a number of large sites for planned
redevelopment at Manchester airport
High • 85% of sites have received a contract extension
proportion • Average extension is now 90% of original lease term
of space
retained
• Developed 2 counter concepts with Sainsbury’s
New growth • Building team to support international growth in
opportunities airports
18 2018 Full year results2
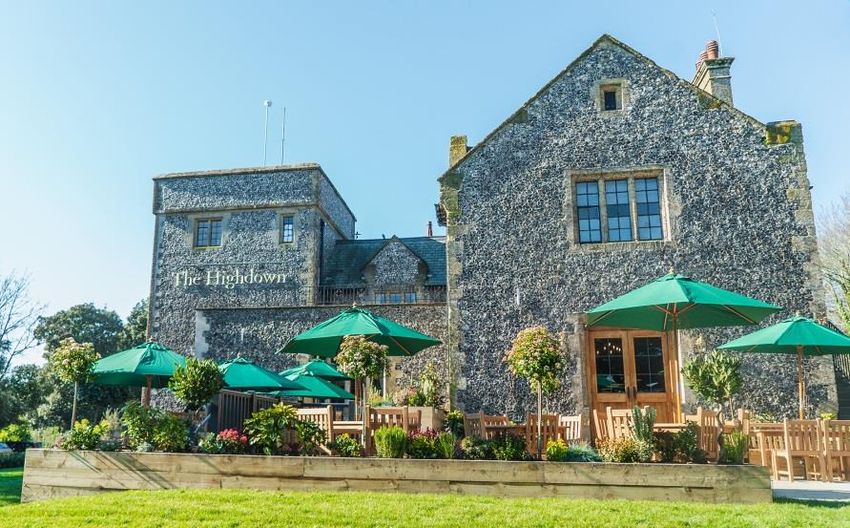
Growing our Pubs business
Menu evolution Optimising existing space
% LFL sales outperformance vs Coffer Peach Tracker* Estate expansion progressing well
• 21 new openings in 2018:
8.0%
7.0% – Refurbished Ribble Valley sites delivering sales uplift in
excess of 30%
6.0%
5.0% – Food & Fuel sites trading in line with expectations
4.0%
– 6 single site B&P acquisitions trading well
3.0%
2.0%
1.0%
• At least 7 openings anticipated for 2019
0.0%
Jan 2017 Apr 2017 Jul 2017 Oct 2017 Jan 2018 Apr 2018 Jul 2018 Oct 2018 Dec 2018
Source*: Coffer Peach Tracker pub restaurants ( 6 month moving average)
19 2018 Full year resultsOur priorities
1
Deliver the benefits of the Wagamama acquisition
2
Grow our Concessions and Pubs businesses
3
Optimise our Leisure brands
20 2018 Full year results3
Market Overview
Over capacity Weakening demand
Branded restaurants 2013-2018 restaurant sales
6,000 5,780
+27% 10.0%
Total growth
5,500
8.0%
Like for like
5,000 growth Responses
6.0%
4,539
4,500 • Focused on developing
4.0% differentiated propositions
4,000 • Increasing proposition exposure
2.0%
to healthy and convenient
3,500 options
0.0%
3,000 2013 2014 2015 2016 2017 2018 • Capitalising on “off-trade” as a
Dec-13 Dec-18 -2.0%
disrupter / structural growth
driver
Source: CGA/Alix Partners Market growth monitor Source: Coffer Peach Tracker restaurants
• Disciplined approach to lease
Structural shift Cost pressures renewals
• Declining retail footfall • c.4% wage inflation
• Growth of delivery • Electricity prices at an 8 year high
• Customer shift towards health, speed and • Rent and business rates structurally high
convenience against a declining market
21 2018 Full year results3
Leisure estate portfolio overview
Location type Distribution of profits Lease profile
% of Cumulative EBITDA Proportion of
Leisure estate
Standalone
100% 40%
Retail only 34%
35%
8% 80%
27% 30%
60% 25%
36%
20%
40% 13%
29% 15%
9% 8%
10% 7%
20%
5%
6% 6% 7% 5%
5%
Leisure Retail & Leisure
only combined 0% 0%
1 2 3 4 5 6 7 8 9 10+
% of Leisure estate No. of years to first exit date
22 2018 Full year results3
Frankie & Benny’s: Portfolio analysis
Structurally Outperforming / in-
unattractive line
(76 sites) (103 sites)
Actual EBITDA
Potential for
improvement
(69 sites)
Model predicted EBITDA
Source: Bain & Company
23 2018 Full year results3
Frankie & Benny’s: Developments and focus areas
Activity in year Social media ratings Upcoming activity
• Continued improvement in core
Score out of 5
proposition via new menus
3.9 • Trial of simplified menu
• Marketing campaigns targeted to
specific occasions, supported by
3.4 limited time offers
• Service and operational focus /
support for underperforming sites
• Roll-out of “order ahead”
functionality
• Active management of structurally
Dec 17 Dec 18 disadvantaged tail
Source: Yext
24 2018 Full year results3
Chiquito: Developments and focus areas
Activity in year Social media ratings Upcoming activity
• New simplified and better value New menu launching in April
Score out of 5
core menu launched in January
• Investment in improved operational
4.1
management
• Promotional strategy centred
around Mexican favourites 3.7
• Launched virtual brand “Kickass
Burrito”
• Leveraging insights from guest
feedback app
Dec 17 Dec 18
Source: Yext
25 2018 Full year resultsSummary • Enlarged group now strongly orientated towards growth • Wagamama like-for-like sales momentum is strong and we are progressing well on the growth avenues unlocked by the acquisition • Strong growth continues in Concessions and Pubs • Focused on optimising our Leisure brands and property portfolio • Current trading for first 10 weeks of the year in line with expectations with like-for-like sales up 2.8% 26 2018 Full year results
Q&A

2018 Full year results

27
You can also read