Analyst presentation H1 2018/19 Half year ended 30 September 2018, 20 November 2018 - Lucas Bols
←
→
Page content transcription
If your browser does not render page correctly, please read the page content below
Analyst presentation H1 2018/19 Half year ended 30 September 2018, 20 November 2018

Disclaimer

DISCLAIMER THIS PRESENTATION may contain forward looking statements. These statements are based on current expectations, estimates and projections of Lucas Bols’ management and
information currently available to the company. Lucas Bols cautions that such statements contain elements of risk and uncertainties that are difficult to predict and that could cause actual
performance and position to differ materially from these statements. Lucas Bols disclaims any obligation to update or revise any statements made in this presentation to reflect subsequent events or
circumstances, except as required by law.

Certain figures in this presentation, including financial data, have been rounded. Accordingly, figures shown for the same category presented in different tables may vary slightly and figures shown
as totals in certain tables may not be an exact arithmetic aggregation of the figures which precede them.

                                                                                                                                                                                                    2
H1 2018/19

1.   Lucas Bols at a glance
2.   Highlights H1 2018/19
3.   Operational highlights
4.   Financials H1 2018/19
5.   Outlook

                              3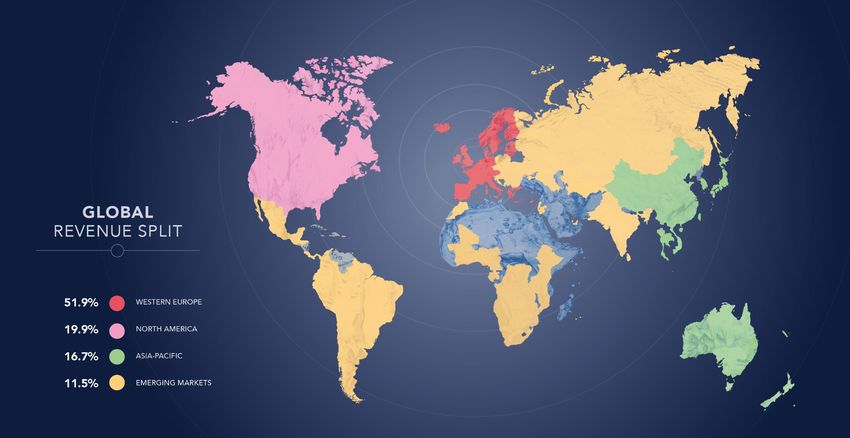
Lucas Bols at a glance

                           13.4%
                           18.5%
                         20.0%   46.7%
                             22.7%

                          19.9%

                                         Revenue   EBIT*
                                           €m       €m

                                                           4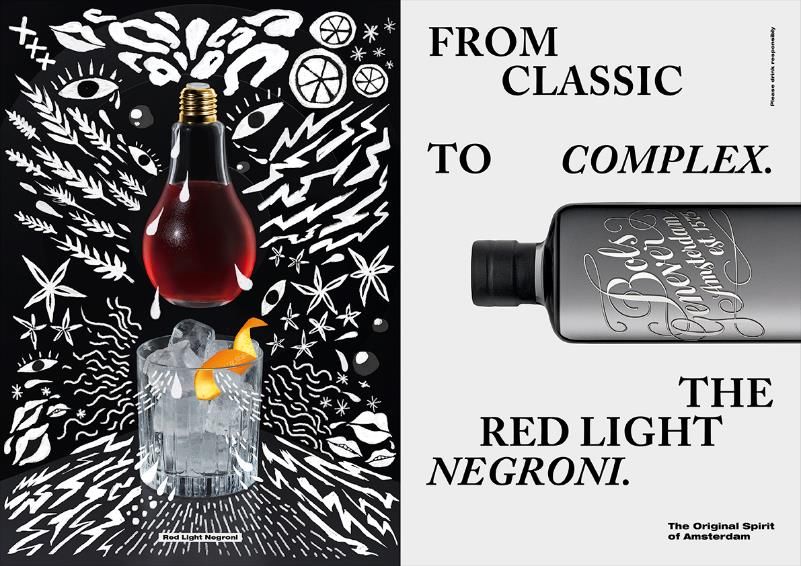
Global brands organic revenue growth of 3%
               Global brands                         Revenue split H1 2018/19               Regional brands

                                                                        Regional brands
           Bols Liqueurs range                                          € 10.2 mln.              Liqueurs

                                                                     21%

                                                              79% 29,8%
   White Spirits          Italian Liqueurs            70,2%                               Dutch Jenever portfolio
                                             Global brands
                                             € 37.6 mln.

                                                    Gross Profit split H1 2018/19
                                                                       Regional brands
                                                                       € 4.9 mln.

        Passoã                     Nuvo                              17%                      Value brands

                                                              83%

                                             Global brands
                                             € 24.0 mln.

                                                                                                                    5
Strong and diversified global footprint, with around half
of the revenues coming from outside of Western Europe
Group revenue per geographical segment based on H1 2018/19

                                                             6
Clear strategy to capture the growing cocktail trend and premiumization
while maintaining the competitiveness of regional brands

                                          Mission Lucas Bols

                We create great cocktail experiences around the world.

                                  Strategic framework Lucas Bols

                                Lead the                                                 Leverage
       Build the                                            Accelerate global
                                development of                                           operational
       brand equity                                         brand growth
                                the cocktail market                                      excellence

    • To strengthen and grow our global brands in the international cocktail market
    • To maintain the competitiveness of our regional brands in regional and local markets

                                                                                                       7
H1 2018/19

1.   Lucas Bols at a glance
2.   Highlights H1 2018/19
3.   Operational highlights
4.   Financials H1 2018/19
5.   Outlook

                              8
Highlights H1 2018/19*
  Revenue      Revenue of € 47.8 million, in line with last year

               Global brands reported revenue growth of 3.0%, while revenue of the regional brands was down 10.5%
    Brand
               mainly as a result of temporary import restrictions in Western Africa and lower jenever/vieux sales in the
 performance
               Netherlands

               North America achieved double-digit revenue growth on the back of a strong performance in the US. Asia-
   Regional
               Pacific showed healthy revenue growth, while both Western Europe and Emerging Markets saw revenue
 performance
               decline due to the performance of the regional brands

Gross margin   The overall gross margin came in at 60.5% (down 110 bps) as a result of relatively lower shipments to
               higher margin markets

    EBIT       EBIT amounted to € 12.9 million in line with last year

  Net Profit   Net profit came in at € 7.9 million, which is in line with last year

  Dividend     Interim dividend set at € 0.35 per share in cash, equal to last year

                 *All comparisons are on an organic basis, i.e. at constant currencies and excluding one-off items. In H1 2018/19 the one-off items consist of one-off restructuring
                 costs of € 0.3 million (net) at Avandis. Pre-IFRS 15/16.                                                                                                              9
H1 2018/19

1.   Lucas Bols at a glance
2.   Highlights H1 2018/19
3.   Operational highlights
4.   Financials H1 2018/19
5.   Outlook

                              10
Operational highlights H1 2018/19 – global brands
Bols Liqueurs range: Revenue in line with last year
• Continued growth in the US, driven by increased distribution in retail chains
• Strong performance in China was off-set by a decline in Japan
• Bols Watermelon and Bols Cucumber successfully launched as LowBols heroes
• New flavours added to the ‘Add Flavor To Your Margarita’ program
• Multiple activation programs aimed at both on and off-trade
White spirits : Overall stable performance
• Bols Genever Red light Negroni expansion in the US, activation in several
other markets
• Continued double digit growth trend for Damrak Gin in both the US and the
Netherlands
• Damrak Gin launched in South-Korea and listed at Formula 1 in Singapore
• Bols Vodka under pressure in Canada and Argentina. Continued good
performance in the Netherlands
11Operational highlights H1 2018/19 - Global brands
Italian Liqueurs: Performance slightly below last year
• Highest score of Galliano L’Aperitivo in Wine Enthusiast Magazine bitter
test
• Social media campaign for Galliano L’Aperitivo in the US
• Solid performance of Galliano in core market Australia
• Strong performance Vaccari following global brand restyling
• Vaccari on-premise activation in key cities in Mexico
Passoã: Continued good performance with mid-single digit revenue growth
• Distribution expanded in the US to 35 states and new listings, both on- and off-trade
• Recovery in Puerto Rico, growth in Asia-Pacific
• New brand activations in Western Europe
• Signature cocktail “Porn Star Martini” expansion continues in the UK
Nuvo: Relaunch in de US
• Gradually building up the distribution with focus on a limited number of states
• First signs of activations are positive
• Strong retail activation program planned for H2 2018/19
12Operational highlights H1 2018/19 - Regional brands
• In Western Africa the company experienced temporary import restrictions into Togo and Benin
• Revenue Dutch domestic jenever/vieux portfolio was down as a result of the declining market
• Planned relaunch of Bols Jenever and Bokma with strong promotional activities in the second half of 2018/19
• Activation Bols Jenevers with new activation program “Bols komt met een biertje” in October
• New drinks strategy Coebergh in the Netherlands and activation programs Pisang Ambon in Belgium and Denmark
13Operational developments H1 2018/19 - US
Strong organic revenue growth of 12.9%
Continued strong performance Passoã, with additional retail and on-
trade listings secured
Further strengthened the retail position of Bols Liqueurs on the back of
the recent listings and continued growth of market share
Strengthened brand awareness Bols Genever through activations such
as #redlightnegroni during the Negroni week in the USA
Damrak gin - Accelerate distribution in the US by a Social Media
campaign “Ride like an Amsterdammer”
Relaunch of Nuvo with focus on a limited number of states .
14Awards
Galliano L’ Aperitivo
• Wine Enthusiast 94 points
Highest rated bitter
• Listed in the top 100 spirits of
2018
151. Lucas Bols at a glance
2. Highlights H1 2018/19
3. Operational review
4. Financials H1 2018/19
5. Outlook
16Revenue and EBIT in line with last year
Highlights
Revenue amounted to € 47.8 million, which was in line with last year at constant
currencies. The effect of currencies on revenue was € 0.9 million negative.
The gross margin stood at 60.5%, a decrease compared to 62.2% in the first half of
2017/18. This decrease is the result of currencies, relatively lower shipments to higher
margin markets and the introduction of Nuvo.
EBIT for the first half of 2018/19 came in at € 12.9 million in line with last year, at
constant currencies and excluding the one-off restructuring charge at Avandis of
€ 0.3 million (net of tax).
The EBIT margin came in at 26.9%, organically in line with last year.
* Excluding the impact of IFRS 15 and 16
Organic growth: at constant currencies, excluding one-off items
17Global brands showed an improvement in revenue of 3.0%
Revenue development (in €m)
-2.0% Group revenue structure
(H1 2018/19)
1.1 -1.2
48.8
-0.9 21%
47.8
79%
Global brands Regional brands
H1 2018/19* H1 2017/18 Reported Organic
Revenue (* €m)
growth % growth %
FY 2017/18 Δ Global Brands Δ Regional Brands Δ FX FY 2018/19 Global brands 37,6 37,4 0,7% 3,0%
Regional brands 10,2 11,5 -11,1% -10,5%
Total 47,8 48,8 -2,0% -0,3%
48.4% 60.5%
62.2% 63.7%
* Excluding the impact of IFRS 15 and 16
Organic growth: at constant currencies, excluding one-off items
Reported gross margin
18Revenue by region
Revenue development at constant currencies (in €m)
Western
48.8 -0.5 Europe
0.9 Western Europe
-0.8
-0.9 • Revenue global brands broadly in line with last year
0.2
47.8 • Strong growth in the UK and the Netherlands, offset by
lower shipments to France
• Domestic jenever/vieux portfolio was down in line with the
51.9%
decline of the market
FY Δ Western Δ Asia- Δ North Δ Δ FX FY
2017/18 Europe Pacific America Emerging 2018/19
Markets
H1 2018/19* H1 2017/18 Reported Organic Asia-Pacific Asia-Pacific
Revenue (* €m)
growth % growth %
• At constant currencies revenue was up
Western Europe 24,8 25,8 -3,7% -3,1%
• Mainly driven by accelerated growth in China
Asia - Pacific 8,0 8,3 -3,7% 2,6%
North America 9,5 8,7 9,6% 11,2% • Japan is showing a decline due to challenging market
Emerging Markets 5,5 6,1 -9,5% -7,7%
conditions and related stock reductions
Total 47,8 48,8 -2,0% -0,3%
• Australia/New Zealand: a small growth in a stable market
* Excluding the impact of IFRS 15 and 16 environment 16.7%
Organic growth: at constant currencies, excluding one-off items
19Revenue by region
Revenue development at constant currencies (in €m)
North America
North America
48.8 -0.5
• Positive growth trend continues
0.9
-0.8 • Double digit growth in the US, mainly driven by Passoã and
-0.9 Damrak Gin as well as by the introduction of Nuvo
0.2
47.8 • Bols Liqueurs continues to gain market share 19.9%
• Lower revenue in Canada more than offset by growth of
Passoã in Puerto Rico
FY Δ Western Δ Asia- Δ North Δ Δ FX FY
2017/18 Europe Pacific America Emerging 2018/19
Markets Emerging
Emerging Markets Markets
• Global brands revenue at constant currencies is slightly up
H1 2018/19* H1 2017/18 Reported Organic
Revenue (* €m)
growth % growth % • Eastern Europe is showing a decline on high comps
• South America is showing growth. The positive impact of the 11.5%
Western Europe 24,8 25,8 -3,7% -3,1%
change in route to market more than compensates the decline
Asia - Pacific 8,0 8,3 -3,7% 2,6%
North America 9,5 8,7 9,6% 11,2%
in Argentina
Emerging Markets 5,5 6,1 -9,5% -7,7%
• The Caribbean is recovering from last year’s hurricane impact
Total 47,8 48,8 -2,0% -0,3%
• Regional Brands impacted by temporary import restrictions in
* Excluding the impact of IFRS 15 and 16 Western Africa
Organic growth: at constant currencies, excluding one-off items
20Gross profit margin influenced by country mix
Gross profit development (in €m)
30.4 Gross margin development at constant
currencies
-0.7
0.4 -0.4
0.0
Total -110 bps
-0.9 Western Europe -80 bps
Asia-Pacific -160 bps
28.9
North America -130 bps
Emerging Markets -140 bps
Group gross profit structure
(H1 2018/19)
11,6%
18,9%
49,9%
FY 2017/18 Δ Western Δ Asia-Pacific Δ North Δ Emerging Δ FX FY 2018/19
Europe America Markets
19,5%
62.2% 58.2% 70.6% 57.4% 61.4% 60.5%
Reported gross margin
Western Europe Asia Pacific
North-America Emerging Markets
21EBIT in line with last year
EBIT development (in €m)
-6.5%
Highlights
-0.2
0.4
13.8 0.0
Organically, EBIT for H1 2018/19 was
up 0.7% to € 12.9 million 30.6%
-0.7
69.4%
FX negatively impacted EBIT by € 0.7
-0.3 million
12.9
In H1 2018/19, Lucas Bols recorded a
one-off € 0.3 million net restructuring
charge at Avandis
FY 2017/18 Δ Global Δ Regional Δ Unallocated Δ FX Δ One-offs FY 2018/19
Brands Brands
28.2% 42.5% 42.5% 26.9%
Reported EBIT margin
22Global brands
Highlights
H1 2018/19* H1 2017/18 Reported Organic At constant currencies the global brands were up 3.0%.
Reported (* €m)
growth growth
The Passoã brand continued its good performance with mid-
Revenue 37,6 37,4 0,7% 3,0% single digit revenue growth.
Cost of sales -13,6 -12,5
GROSS PROFIT 24,0 24,9 -3,5% -0,5%
Gross margin % 63,7% 66,6% 63,8% The white spirits segment showed an overall stable performance,
with the double-digit growth trend for Damrak Gin continuing in
D&A expenses -7,9 -8,5 -7,0% -5,8% both the US and the Netherlands.
% of revenues -21,0% -22,7%
OPERATING PROFIT 16,1 16,4 -1,8% 2,3%
Operating margin % 42,8% 43,9%
Revenue of the Bols Liqueurs range was in line with the year-ago
Share of profit of JVs, net of tax -0,1 0,1 period.
EBIT 16,0 16,4 -2,7% 2,2%
EBIT margin % 42,5% 44,0%
The Italian liqueurs performed slightly below last year as a result
of lower shipments of Galliano that were partially offset by positive
developments for Vaccari in both the Netherlands and Mexico
* Excluding the impact of IFRS 15 and 16 following the restyling of the brand.
Organic growth: at constant currencies, excluding one-off items
EBIT rose 2.2% to € 16.0 million year-on-year at constant
currencies (currencies had a negative impact of € 0.7 million in H1
2018/19) and excluding the one-off restructuring charge at
Avandis (€ 0.1 million allocated to the global brands).
23Regional brands
H1 Highlights
H1 2018/19* Reported Organic
Reported (* €m) 2017/18*
growth growth
The decline of regional brands was mainly related to
Western Africa where the company experienced
Revenue 10,2 11,5 -11,1% -10,5% temporary import restrictions for its brands into Togo
Cost of sales -5,3 -6,0
and Benin.
GROSS PROFIT 4,9 5,5 -10,4% -9,2%
Gross margin % 48,4% 48,0%
Revenue of the domestic genever/vieux portfolio in the
D&A expenses -0,6 -0,9 -26,9% -26,9%
first half of the year was down as a result of the
% of revenues -6,1% -7,4%
declining market.
OPERATING PROFIT 4,3 4,7 -7,3% -5,9%
Operating margin % 42,3% 40,6%
Share of profit of JVs, net of tax 0,0 0,2
Organically, excluding the one-off restructuring charge
EBIT 4,3 4,8 -9,9% -5,0% at Avandis of € 0.2 million in H1 2018/19, EBIT for the
EBIT margin % 42,5% 42,0% regional brands decreased by 5%.
* Excluding the impact of IFRS 15 and 16
Organic growth: at constant currencies, excluding one-off items
24Net profit in line with last year
Highlights
The effective tax rate was approximately 29% for the first half of
2018/19 (H1 2017/18: 27%), higher than the Dutch nominal tax rate as
profits of Passoã are taxed at a higher rate in France.
Given the envisaged reduction in the Dutch corporate tax rate, a
significant one-off gain is expected in the second half of the year,
related to the deferred tax liability.
Earnings per share (pre-IFRS 16) of € 0.64 (post-IFRS 16: € 0.63).
Excluding one-off costs the earnings per share came in at € 0.66.
Interim dividend set at € 0.35 per share in cash, equal to last year.
Number of shares outstanding are 12,477,298.
* Excluding the impact of IFRS 15 and 16
Organic growth: at constant currencies, excluding one-off items
25IFRS 15 and 16 impact
Extract from Interim report for H1 2018/19
IFRS15 & 16 adoption
Amounts in EUR '000 for the six months period ended 30 September 2018 reported 2018 pre-IFRS
impact
Revenue 45.208 2.618 47.826
Cost of sales (18.873) (33) (18.906)
Gross profit 26.335 2.585 28.920
Distribution and administrative expenses (13.331) (2.633) (15.964)
Operating profit 13.004 (48) 12.956
Share of profit of joint ventures, net of tax (81) - (81)
Finance income 46 - 46
Finance costs (1.816) 90 (1.726)
Profit before tax 11.153 42 11.195
Income tax expense (3.262) (10) (3.272)
Profit for the period 7.891 32 7.923
30 September 2018 IFRS16 adoption 30 September 2018
Amounts in EUR '000 as at
reported impact pre-IFRS
Assets
Property, plant and equipment 9.614 (7.084) 2.530
Other non-current assets 314.242 - 314.242
Total non-current assets 323.856 (7.084) 316.772
Total current assets 44.790 - 44.790
Total assets 368.646 (7.084) 361.562
Equity
Total equity 188.108 32 188.140
Liabilities
Loans and borrowings 40.976 - 40.976
Other non-current financial liabilities 75.245 (6.346) 68.899
Employee benefits 293 - 293
Deferred tax liabilities 45.242 10 45.252
Total non-current liabilities 161.756 (6.336) 155.420
Loans and borrowings 4.608 - 4.608
Trade and other payables 12.854 - 12.854
Corporate income tax payable 129 - 129
Other current financial liabilities, including derivatives 1.191 (780) 411
Total current liabilities 18.782 (780) 18.002
Total equity and liabilities 368.646 (7.084) 361.562
26H1 financing update: a new financing structure with ample
covenant headroom and significantly lower rates
Rationale for refinancing Refinancing results
• The current facilities have an aggregate of € 96m of committed • ABN AMRO to join the syndicate as new lender alongside
facilities with a tenor until February 2021, provided by Rabobank encumbered banks (Rabobank and NIBC)
and NIBC
• Annual interest costs assumed to be reduced by around
€ 0.4m
• Existing facilities provide little operational flexibility and no room • Additional liquidity headroom of € 34m
to fund potential add-on acquisitions
• Leverage Ratio covenant improved from 3.0x to 4.0x
• Pay-back of one year with capitalised fees write off of
• Main objectives of the refinancing: € 0.4m
• Achieve lower rates by benefitting from improved credit profile • One-off advisory costs and the accelerated amortization
and favorable loan market environment of the financing costs for the existing facilities will be
• Extend tenor by 5 years charged to the second half of the year
• Maintain sufficient covenant flexibility and liquidity to exercise
Passoã and be able to exercise Nuvo options
• Headroom under facilities to (partially) fund future add-on
acquisitions
• Increase operational flexibility by loosening of loan
documentation (information undertakings, acquisition criteria)
27Balance sheet and cash flow
Actual Actual Actual Actual
Reported (* €m) H1 2018/19* FY 2017/18
FY 2017/18
H1 2017/18
Highlights
Intangible assets 306,9 306,9 306 306,5
Investments in joint ventures 6,8 7,4 7,79 7,4 Net working capital € 19.6 million, traditionally higher in the first
Other 3,1 2,6 0,6 2,5
NON-CURRENT ASSETS 316,8 316,9 317 316,4 half of the year
Cash and cash equivalents 12,2 12,4 12,4 9,0
Net working capital
Other
19,6
0,0
14,4
0,1 0,05
18,4
0,7
Other non-current liabilities include an assumed debt of € 68.7 million
TOTAL 348,6 343,8 359 344,6 related to the call/put option related to Passoã
Funded by equity and liabilities
EQUITY 188,1 183,6 184 176,9
The net debt to EBITDA ratio is 2.9. The net debt to EBITDA ratio
Loans and borrowings 41,0 43,9 43,9 45,3 including assumed debt was 4.3
Deferred tax liabilities 45,2 43,1 43,1 48,4
Other 69,2 68,8 68,5 68,3
NON-CURRENT LIABILITIES 155,4 155,8 156 162,0
Loans and borrowings 4,6 4,0 4,04 5,4 Actual Actual Actual Actual
Derivative financial instruments 0,4 0,4 0,4 0,3 Reported (* €m) H1 2018/19* FY 2017/18 FY 2017/18
H1 2017/18
CURRENT LIABILITIES 5,0 4,4 20 5,7
Deferred tax assets 3,3 5,3 8,03 6,4
0
Deferred tax liabilities -48,6 -48,4 -54,5 -54,8
Total deferred tax -45,2 -43,1 -46,5 -48,4
TOTAL 348,6 343,8 359 344,6
Cash flow development (in €m)
13.0
0.3 -0.8
Cash flow was temporarily impacted by catch up on income tax
-3.8
-8.9% payable in France as well as CAPEX investments in our
6.7
headquarters and € 0.7 million negative currency impact
-3.1 6.1
0.5
Cash flows were used to pay dividends (€ 3.1 million),
and debt reduction (€ 4 million)
Operating Δ Δ CAPEX Δ Working Δ Income Δ Other FOCF H1 FOCF H1
profit H1 Depreciation capital tax 2018/19 2017/18
2018/19
28Important aspects of Lucas Bols’ currency effects
USD exchange rate JPY exchange rate
• 54% of revenue is denominated in foreign
currencies in H1 2018/19 (compared to 49.7% in FY
2017/18 and 50.6% in H1 2017/18 )
• Lucas Bols has a policy of hedging 60 - 80% of its
net cashflows in foreign currencies at the start of
the financial year
• In H1 2018/19, as a result of the stronger euro,
foreign currencies had a negative impact of € 0.9
million on revenue and € 0.7 million on EBIT
AUD exchange rate GBP exchange rate • Taking into account the foreign currency positions
already hedged and assuming the current level of
the euro, all foreign currencies combined are
expected to have a negative impact of around € 1.2
million on EBIT in FY 2018/19 vs. the 2017/18 rates
29FY 2018/19
1. Lucas Bols at a glance
2. Highlights H1 2018/19
3. Operational highlights
4. Financials H1 2018/19
5. Outlook
30Outlook
The underlying dynamics in the global cocktail markets remain healthy.
We expect revenue growth from the global brands to further increase in the second half of the 2018/19 financial
year, mainly driven by the strong growth in the US market.
The performance of the regional brands will remain under pressure in the second half of the year.
Currencies will have a negative impact of around € 1.2 million on full-year 2018/19 EBIT. Furthermore as stated
before, given the initially higher A&P investments and royalty payments, the revenue of Nuvo will translate into a
limited contribution to EBIT.
Taking into account the impact of the aforementioned items and the one-offs, we remain confident in delivering an
overall performance in line with our mid-term strategic ambitions.
31You can also read