Trade-Induced Mortality - scale=0.195 logofront4.png
←
→
Page content transcription
If your browser does not render page correctly, please read the page content below
Trade-Induced Mortality

                                 Jérôme Adda         Yarine Fawaz
                  Bocconi University and IGIER; Universitat Autonoma de Barcelona

                                         May 20, 2015

Trade-Induced Mortality                      Jérôme Adda and Yarine Fawaz         1/34
How does increased competition induced by in-
ternational trade impact workers’ health?
US
300
I Huge increase in Italian or US imports
from China over last two decades.
Imports CHN (billion USD)
200
I Such a dramatic change raises
questions on its impact on various
100
outcomes: deindustrialization,
unemployment, voting behavior?
0
1980 1990 2000 2010
year
30
IT
Imports CHN (Billion USD)
20
10
0
1990 1995 2000 2005 2010 2015
Year
Comtrade Data, NACE codes 100−400 (Manufacture)
Trade-Induced Mortality Jérôme Adda and Yarine Fawaz 2/34How does increased competition induced by in-
ternational trade impact workers’ health?
US
20
I Large decrease in employment in the
manufacturing sector.
Employment (in millions)
18
I Does this trade shock from China
16
impact workers’ health?
14 12
1970 1980 1990 2000 2010 2020
Year
5
IT
4.8
Employment (in millions)
4.2 4.4 44.6
1995 2000 2005 2010 2015
Year
Trade-Induced Mortality Jérôme Adda and Yarine Fawaz 3/34Linking two literatures
International trade and domestic workers:
I Autor, Dorn, Hanson (AER,2011)
I Bernard, Jensen, Schott (Journal of International
Economics,2005)
Trade-Induced Mortality Jérôme Adda and Yarine Fawaz 4/34Linking two literatures
International trade and domestic workers:
I Autor, Dorn, Hanson (AER,2011)
I Bernard, Jensen, Schott (Journal of International
Economics,2005)
Economic downturns and workers’ health:
I Ruhm: Are recessions good for your health? (QJE,2000)
I Miller, Page, Huff Stevens, and Filipski: Why are recessions
good for your health? (AER,2009)
I Sullivan and von Wachter: Job displacement and mortality.
(QJE,2009). Colantone, Crino and Ogliari (2015): imports
and mental health.
I Large literature in epidemiology showing how health is related
to status.
Trade-Induced Mortality Jérôme Adda and Yarine Fawaz 4/34Our contribution
Our approach is different:
I Our datasets are unique: individual data with linkage to
mortality data, merged at industry level with trade series over
26 years in the US and 23 years in Italy.
I Individual mortality data instead of aggregate death rates⇒
allows us to perform survival analysis and control for
individual characteristics.
Trade-Induced Mortality Jérôme Adda and Yarine Fawaz 5/34Our contribution
Our approach is different:
I Our datasets are unique: individual data with linkage to
mortality data, merged at industry level with trade series over
26 years in the US and 23 years in Italy.
I Individual mortality data instead of aggregate death rates⇒
allows us to perform survival analysis and control for
individual characteristics.
Our question is different:
I Impact of exposure to trade on health outcomes, instead of
labor-related outcomes.
I Trade shocks do not necessarily imply the same as job
displacement: less scope for reallocation of workers in the
same sector.
Trade-Induced Mortality Jérôme Adda and Yarine Fawaz 5/34Possible mechanisms through which trade may
affect workers’ mortality
Our individual data on cause-specific mortality will allow us to
explore the mechanisms through which the impact could go:
I Mental health (suicide).
Trade-Induced Mortality Jérôme Adda and Yarine Fawaz 6/34Possible mechanisms through which trade may
affect workers’ mortality
Our individual data on cause-specific mortality will allow us to
explore the mechanisms through which the impact could go:
I Mental health (suicide).
I Health behaviors: drinking, smoking, exercise, diet
(cardio-vascular , tobacco-induced cancer, cirrhosis and other
alcohol-related diseases, etc).
Trade-Induced Mortality Jérôme Adda and Yarine Fawaz 6/34Possible mechanisms through which trade may
affect workers’ mortality
Our individual data on cause-specific mortality will allow us to
explore the mechanisms through which the impact could go:
I Mental health (suicide).
I Health behaviors: drinking, smoking, exercise, diet
(cardio-vascular , tobacco-induced cancer, cirrhosis and other
alcohol-related diseases, etc).
I Other consequences of labor shocks: more or less commuting,
etc. (motor accidents)
Trade-Induced Mortality Jérôme Adda and Yarine Fawaz 6/34Possible mechanisms through which trade may
affect workers’ mortality
Our individual data on cause-specific mortality will allow us to
explore the mechanisms through which the impact could go:
I Mental health (suicide).
I Health behaviors: drinking, smoking, exercise, diet
(cardio-vascular , tobacco-induced cancer, cirrhosis and other
alcohol-related diseases, etc).
I Other consequences of labor shocks: more or less commuting,
etc. (motor accidents)
I If rising competition ends up in job displacement, all causes
could be affected through loss of health insurance.
Trade-Induced Mortality Jérôme Adda and Yarine Fawaz 6/34Possible mechanisms through which trade may
affect workers’ mortality
Our individual data on cause-specific mortality will allow us to
explore the mechanisms through which the impact could go:
I Mental health (suicide).
I Health behaviors: drinking, smoking, exercise, diet
(cardio-vascular , tobacco-induced cancer, cirrhosis and other
alcohol-related diseases, etc).
I Other consequences of labor shocks: more or less commuting,
etc. (motor accidents)
I If rising competition ends up in job displacement, all causes
could be affected through loss of health insurance.
I Expected effects of trade shocks: Unclear what to expect,
could go both ways.
Trade-Induced Mortality Jérôme Adda and Yarine Fawaz 6/34Preview of results
Increased trade leads to increased mortality:
I A 1 billion dollar increase in imports from China leads to increase in
the hazard of dying (all causes); four-five years between the trade
shock and the mortality outcome.
I US about 2% increase. ≈330 extra deaths per year for US
manufacture workers per billion USD imports.
I Italy about 7% increase. ≈250 extra deaths per year for Italian
manufacture workers per billion USD imports.
Trade-Induced Mortality Jérôme Adda and Yarine Fawaz 7/34Preview of results
Increased trade leads to increased mortality:
I A 1 billion dollar increase in imports from China leads to increase in
the hazard of dying (all causes); four-five years between the trade
shock and the mortality outcome.
I US about 2% increase. ≈330 extra deaths per year for US
manufacture workers per billion USD imports.
I Italy about 7% increase. ≈250 extra deaths per year for Italian
manufacture workers per billion USD imports.
Increased mortality is not uniform across all causes of
death:
I More deaths by suicide, cirrhosis, respiratory diseases.
I No impact on deaths by motor accidents, tobacco-induced cancer.
Trade-Induced Mortality Jérôme Adda and Yarine Fawaz 7/34Outline
I Econometric strategy
I Data and descriptive statistics
I Results
I Potential mechanisms
Trade-Induced Mortality Jérôme Adda and Yarine Fawaz 8/34Econometric strategy
Looking for a causal effect of Trade on Mortality, there are
potential endogeneity sources:
Trade-Induced Mortality Jérôme Adda and Yarine Fawaz 9/34Econometric strategy
Looking for a causal effect of Trade on Mortality, there are
potential endogeneity sources:
I Mortality patterns may be sector-specific. ⇒ we need a
within-industry identification.
Trade-Induced Mortality Jérôme Adda and Yarine Fawaz 9/34Econometric strategy
Looking for a causal effect of Trade on Mortality, there are
potential endogeneity sources:
I Mortality patterns may be sector-specific. ⇒ we need a
within-industry identification.
I Mortality could follow the same trend over time as imports
from China, without being caused by this trend: e.g. because
of smoking epidemy.
Trade-Induced Mortality Jérôme Adda and Yarine Fawaz 9/34Econometric strategy
Looking for a causal effect of Trade on Mortality, there are
potential endogeneity sources:
I Mortality patterns may be sector-specific. ⇒ we need a
within-industry identification.
I Mortality could follow the same trend over time as imports
from China, without being caused by this trend: e.g. because
of smoking epidemy.
We appeal to a diff-in-diff strategy, in a broad sense, exploiting two
sources of variation: across sectors and time.
Trade-Induced Mortality Jérôme Adda and Yarine Fawaz 9/34Econometric strategy: identification
I Basic hypothesis of the identification strategy: There is no
differential trend in mortality between sectors.
Had Italian/US imports from China never existed, the
variation in mortality in a sector affected by trade should be
the same as the variation in a sector less affected.
Trade-Induced Mortality Jérôme Adda and Yarine Fawaz 10/34Econometric strategy: identification
I Basic hypothesis of the identification strategy: There is no
differential trend in mortality between sectors.
Had Italian/US imports from China never existed, the
variation in mortality in a sector affected by trade should be
the same as the variation in a sector less affected.
Trade-Induced Mortality Jérôme Adda and Yarine Fawaz 10/34Econometric strategy: identification
I Basic hypothesis of the identification strategy: There is no
differential trend in mortality between sectors.
Had Italian/US imports from China never existed, the
variation in mortality in a sector affected by trade should be
the same as the variation in a sector less affected.
⇒ Classical diff-in-diff approach.
Trade-Induced Mortality Jérôme Adda and Yarine Fawaz 10/34Econometric strategy: identification
I Basic hypothesis of the identification strategy: There is no
differential trend in mortality between sectors.
Had Italian/US imports from China never existed, the
variation in mortality in a sector affected by trade should be
the same as the variation in a sector less affected.
⇒ Classical diff-in-diff approach.
I With additional features: individual characteristics, making
the DID hypothesis more reasonable.
Any change in mortality, concurrent with the increase in CHN
imports, but due to a change in the composition of the
workforce, will be ruled out by our controls: gender, age, race,
social class/education, health, and area of residence, at
baseline.
Trade-Induced Mortality Jérôme Adda and Yarine Fawaz 10/34Econometric strategy: analogy with a linear
model
Basic model
0
Yi,s,t,a = αs + δt + λa + βT rades,t−k + γXi + i,s,t,a
I T rades,t−k is imports from China in sector s at time t − k,
k = 0, 1, ..., 5.
I Sector, time and area FE.
I Xi vector of individual baseline characteristics.
Trade-Induced Mortality Jérôme Adda and Yarine Fawaz 11/34Econometric strategy: analogy with a linear
model
Basic model
0
Yi,s,t,a = αs + δt + λa + βT rades,t−k + γXi + i,s,t,a
I T rades,t−k is imports from China in sector s at time t − k,
k = 0, 1, ..., 5.
I Sector, time and area FE.
I Xi vector of individual baseline characteristics.
Exploring mechanisms: model with heterogeneous effects
0
Yi,s,t,a = αs +δt +λa +βT rades,t−k + β̃T rades,t−k ∗Ei +γXi +i,s,t,a
I The effect of Trade is allowed to differ for a number of
characteristics of the individual i, or of his sector s and area a.
Trade-Induced Mortality Jérôme Adda and Yarine Fawaz 11/34Econometric strategy: analogy with a linear
model
Basic model
0
Yi,s,t,a = αs + δt + λa + βT rades,t−k + γXi + i,s,t,a
I T rades,t−k is imports from China in sector s at time t − k,
k = 0, 1, ..., 5.
I Sector, time and area FE.
I Xi vector of individual baseline characteristics.
Exploring mechanisms: model with heterogeneous effects
0
Yi,s,t,a = αs +δt +λa +βT rades,t−k + β̃T rades,t−k ∗Ei +γXi +i,s,t,a
I The effect of Trade is allowed to differ for a number of
characteristics of the individual i, or of his sector s and area a.
Since we do not observe our individuals for long enough for all of them to
die by December 2011, right-censoring ⇒ Need survival analysis.
Trade-Induced Mortality Jérôme Adda and Yarine Fawaz 11/34Econometric strategy: Survival analysis
Stratified Cox model, all causes of death:
h(ageit |T rades,t−k , Xi,s,a,t ) = h0 (ageit |Xi,s,a )exp(T rades,t−k β + δt )
where the baseline hazard h0 is stratified by sector, area and individual
characteristics such as social class/education or gender.
Trade-Induced Mortality Jérôme Adda and Yarine Fawaz 12/34Econometric strategy: Survival analysis
Stratified Cox model, all causes of death:
h(ageit |T rades,t−k , Xi,s,a,t ) = h0 (ageit |Xi,s,a )exp(T rades,t−k β + δt )
where the baseline hazard h0 is stratified by sector, area and individual
characteristics such as social class/education or gender.
Stratified Cox model, cause-specific, with independence
assumption:
hc (ageit |T rades,t−k , Xi,s,a,t ) = h0,c (ageit |Xi,s,a )exp(T rades,t−k β + δt )
where cause c is a specific cause of death such as suicide, cancer, etc.
Trade-Induced Mortality Jérôme Adda and Yarine Fawaz 12/34Econometric strategy: Survival analysis
Stratified Cox model, all causes of death:
h(ageit |T rades,t−k , Xi,s,a,t ) = h0 (ageit |Xi,s,a )exp(T rades,t−k β + δt )
where the baseline hazard h0 is stratified by sector, area and individual
characteristics such as social class/education or gender.
Stratified Cox model, cause-specific, with independence
assumption:
hc (ageit |T rades,t−k , Xi,s,a,t ) = h0,c (ageit |Xi,s,a )exp(T rades,t−k β + δt )
where cause c is a specific cause of death such as suicide, cancer, etc.
Competing-risk model, estimated by Fine and Gray (1999) ’s
method:
hCIC
c (a|T rades,t , Xi,s,a,t ) = hCIC
0,c (a|Xi,s,a )exp(T rades,t−k βc + δt )
Trade-Induced Mortality Jérôme Adda and Yarine Fawaz 12/34Data, Italy
I INPS 1990-2013: 24 years of panel data. Includes a set of
individuals characteristics, including industry, at a
disaggregated level (3-digit Ateco, converted to 3 digit NACE
codes); and region of residence. Sample: 1/2 million
manufacture workers, aged 16-65 at baseline.
Trade-Induced Mortality Jérôme Adda and Yarine Fawaz 13/34Data, Italy
I INPS 1990-2013: 24 years of panel data. Includes a set of
individuals characteristics, including industry, at a
disaggregated level (3-digit Ateco, converted to 3 digit NACE
codes); and region of residence. Sample: 1/2 million
manufacture workers, aged 16-65 at baseline.
I Mortality data: linkage to death-certificate data, follow-up
data to 2013.
Trade-Induced Mortality Jérôme Adda and Yarine Fawaz 13/34Data, Italy
I INPS 1990-2013: 24 years of panel data. Includes a set of
individuals characteristics, including industry, at a
disaggregated level (3-digit Ateco, converted to 3 digit NACE
codes); and region of residence. Sample: 1/2 million
manufacture workers, aged 16-65 at baseline.
I Mortality data: linkage to death-certificate data, follow-up
data to 2013.
I Trade data: Italian imports from China, 1988-2012, at the
industry level (3 digit NACE codes).
Trade-Induced Mortality Jérôme Adda and Yarine Fawaz 13/34Data, US
I National Health Interview Survey 1986-2009: 24 years of
pooled cross-sections. Includes a full set of individuals
characteristics, including industry, at a very disaggregated
level (3-digit Census 1990 based on 3-digit SIC, 4-digit Census
2002 based on 4-digit NAICS); and county of residence.
Sample: 130,000 manufacture workers, aged 18-65 at baseline.
Trade-Induced Mortality Jérôme Adda and Yarine Fawaz 14/34Data, US
I National Health Interview Survey 1986-2009: 24 years of
pooled cross-sections. Includes a full set of individuals
characteristics, including industry, at a very disaggregated
level (3-digit Census 1990 based on 3-digit SIC, 4-digit Census
2002 based on 4-digit NAICS); and county of residence.
Sample: 130,000 manufacture workers, aged 18-65 at baseline.
I Mortality data: linkage to death-certificate data, follow-up
data from the date of NHIS interview through December 31,
2011.
Trade-Induced Mortality Jérôme Adda and Yarine Fawaz 14/34Data, US
I National Health Interview Survey 1986-2009: 24 years of
pooled cross-sections. Includes a full set of individuals
characteristics, including industry, at a very disaggregated
level (3-digit Census 1990 based on 3-digit SIC, 4-digit Census
2002 based on 4-digit NAICS); and county of residence.
Sample: 130,000 manufacture workers, aged 18-65 at baseline.
I Mortality data: linkage to death-certificate data, follow-up
data from the date of NHIS interview through December 31,
2011.
I Trade data: US imports from China, 1981-2007, at the
industry level.⇒ Allows for up to 5 lags.
Trade-Induced Mortality Jérôme Adda and Yarine Fawaz 14/34Data, US
I National Health Interview Survey 1986-2009: 24 years of
pooled cross-sections. Includes a full set of individuals
characteristics, including industry, at a very disaggregated
level (3-digit Census 1990 based on 3-digit SIC, 4-digit Census
2002 based on 4-digit NAICS); and county of residence.
Sample: 130,000 manufacture workers, aged 18-65 at baseline.
I Mortality data: linkage to death-certificate data, follow-up
data from the date of NHIS interview through December 31,
2011.
I Trade data: US imports from China, 1981-2007, at the
industry level.⇒ Allows for up to 5 lags.
I County of Business Patterns, 1981-2007. Includes number
of employees, number of firms, at industry∗county level.
Trade-Induced Mortality Jérôme Adda and Yarine Fawaz 14/34Key explanatory variable: Worker’s exposure to
Chinese imports
I Every worker is faced with competition of Chinese imports in
his own industry ⇒ Need to assign the corresponding imports
from China to each worker, depending on his industry j,
calendar year t and survey year t0 .
Trade-Induced Mortality Jérôme Adda and Yarine Fawaz 15/34Key explanatory variable: Worker’s exposure to
Chinese imports
I Every worker is faced with competition of Chinese imports in
his own industry ⇒ Need to assign the corresponding imports
from China to each worker, depending on his industry j,
calendar year t and survey year t0 .
I NHIS provides very detailed information on worker’s industry.
Trade-Induced Mortality Jérôme Adda and Yarine Fawaz 15/34Key explanatory variable: Worker’s exposure to
Chinese imports
I
Trade-Induced Mortality Jérôme Adda and Yarine Fawaz 15/34Key explanatory variable: Worker’s exposure to
Chinese imports
I Every worker is faced with competition of Chinese imports in
his own industry ⇒ Need to assign the corresponding imports
from China to each worker, depending on his industry j,
calendar year t and survey year t0 .
I NHIS provides very detailed information on worker’s industry.
I Problem: NHIS is not made as a panel. Every few years,
change of industry classification.
Trade-Induced Mortality Jérôme Adda and Yarine Fawaz 15/34Matching NHIS with Trade data using Industry
Survey year NHIS uses based on digits
1986-1991 Census 1970 SIC 1972 3
1992-2004 Census 1990 SIC 1987 3
2005-2007 Census 2002 NAICS 2002 4
2008-2009 Census 2007 NAICS 2007 4
Trade-Induced Mortality Jérôme Adda and Yarine Fawaz 16/34Matching NHIS with Trade data using Industry
Survey year NHIS uses based on digits
1986-1991 Census 1970 SIC 1972 3
1992-2004 Census 1990 SIC 1987 3
2005-2007 Census 2002 NAICS 2002 4
2008-2009 Census 2007 NAICS 2007 4
Calendar year Trade data digits
1981-2007 SIC 1987 4
1989-2007 NAICS 1997, NAICS2002 6
Trade-Induced Mortality Jérôme Adda and Yarine Fawaz 16/34Matching NHIS with Trade data using Industry
Survey year NHIS uses based on digits
1986-1991 Census 1970 SIC 1972 3
1992-2004 Census 1990 SIC 1987 3
2005-2007 Census 2002 NAICS 2002 4
2008-2009 Census 2007 NAICS 2007 4
Calendar year Trade data digits
1981-2007 SIC 1987 4
1989-2007 NAICS 1997, NAICS2002 6
⇒Need for crosswalks between industry classifications. Crosswalk example
More details
Trade-Induced Mortality Jérôme Adda and Yarine Fawaz 16/34Key explanatory variable: Workers’exposure to
Chinese imports
I Trade data ⇒ one measure of exposure to trade per industry, over
time.
Trade-Induced Mortality Jérôme Adda and Yarine Fawaz 17/34Key explanatory variable: Workers’exposure to
Chinese imports
I Trade data ⇒ one measure of exposure to trade per industry, over
time.
I We construct this measure for 131 SIC (3-digits) and 84 NAICS
(4-digits).
Trade-Induced Mortality Jérôme Adda and Yarine Fawaz 17/34Key explanatory variable: Workers’exposure to
Chinese imports
I Trade data ⇒ one measure of exposure to trade per industry, over
time.
I We construct this measure for 131 SIC (3-digits) and 84 NAICS
(4-digits).
Table: Five biggest industries in 1983
SIC description emp in 1983 emp in 2007
399 miscellaneous manuf. 1,475,622 1,131,248
371 motor vehicles 725,841 654,960
372 aircrafts 585,928 336,884
308 plastics 527,482 671,311
367 electronic components 505,402 369,288
Total manuf 19,905,696 14,822,896
Total all 76,963,979 116,162,117
Trade-Induced Mortality Jérôme Adda and Yarine Fawaz 17/34Key explanatory variable: Workers’exposure to
Chinese imports
I Trade data ⇒ one measure of exposure to trade per industry, over
time.
I We construct this measure for 131 SIC (3-digits) and 84 NAICS
(4-digits).
Table: Five biggest importing industries in 2007
SIC description emp in 1983 emp in 2007
357 computer, office equip. 376,804 112,429
394 dolls, toys, games 98,498 64,026
233 womens’,juniors’ outerwear 377,638 83,904
314 footwear 110,930 12,486
363 aluminium 136,010 65,232
Total manuf 19,905,696 14,822,896
Total all 76,963,979 116,162,117
Trade-Induced Mortality Jérôme Adda and Yarine Fawaz 17/34Overview of the increase in US imports from China across industries
20:food 21:tobacco 22:textile 23:apparel 24:lumber
80
60
40
20
0
25:furniture 26:paper 27:printing 28:chemicals 29:petroleum
Imports CHN (billion USD)
80
60
40
20
0
30:rubber 31:leather 32:stone 33:metal I 34:metal II
80
60
40
20
0
35:machine,computer 36:electronic 37:transport 38:measuring instru 39:miscellaneous
80
60
40
20
0
1980 1990 2000 2010 1980 1990 2000 2010 1980 1990 2000 2010 1980 1990 2000 2010 1980 1990 2000 2010
year
Graphs by sic2
Trade-Induced Mortality Jérôme Adda and Yarine Fawaz 18/34Overview of the increase in US imports from China across industries Trade-Induced Mortality Jérôme Adda and Yarine Fawaz 18/34
Overview of the increase in US imports from China across industries

                                                           351:engines              352:garden machine             353:construction machine
                                             60
                                             40
                                             20
                 Imports CHN (billion USD)
                                             0

                                                         354:metalworking           355:special industry              356:general industry
                                             60
                                             40
                                             20
                                             0

                                                          357:computer                  358:refrigeration                 359:misc. machine
                                             60
                                             40
                                             20
                                             0

                                                  1980     1990   2000      2010 1980    1990      2000     2010 1980       1990   2000   2010
                                                                                            year
                                             Graphs by sic3

Trade-Induced Mortality                                                                  Jérôme Adda and Yarine Fawaz                          18/34
Overview of the increase in US imports from China across industries Trade-Induced Mortality Jérôme Adda and Yarine Fawaz 18/34
Overview of the increase in US imports from China across industries

                                                                     28:chemicals
                                             15
                 Imports CHN (billion USD)
                                             10
                                             5
                                             0

                                                   1980       1990                    2000            2010
                                                                       year
                                             Graphs by sic2

Trade-Induced Mortality                                              Jérôme Adda and Yarine Fawaz          18/34
Overview of the increase in Italian imports
from China across industries
30
Imports CHN (Billion USD)
20
10
0
1990 1995 2000 2005 2010 2015
Year
Comtrade Data, NACE codes 100−400 (Manufacture)
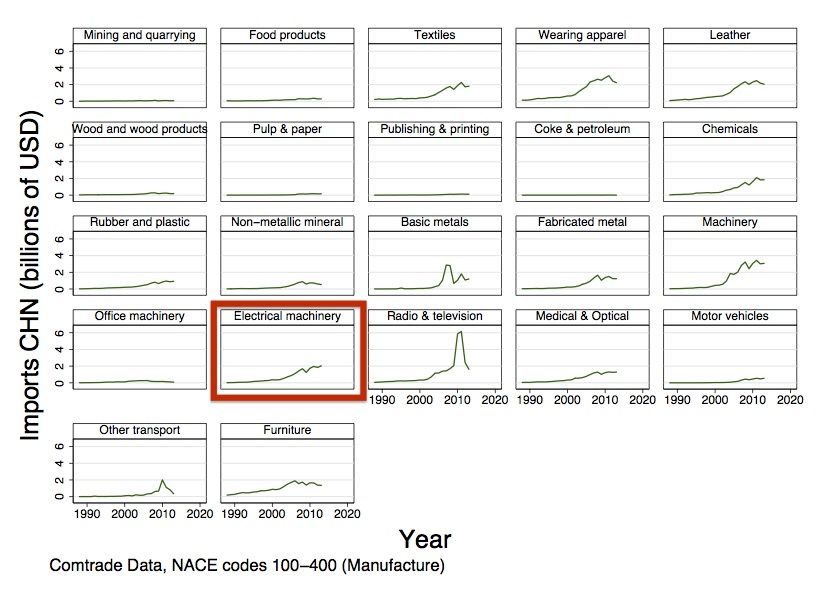
Trade-Induced Mortality Jérôme Adda and Yarine Fawaz 19/34Overview of the increase in Italian imports
from China across industries
0 2 4 6 Mining and quarrying Food products Textiles Wearing apparel Leather
Imports CHN (billions of USD)
Wood and wood products Pulp & paper Publishing & printing Coke & petroleum Chemicals
0 2 4 6
Rubber and plastic Non−metallic mineral Basic metals Fabricated metal Machinery
0 2 4 6
Office machinery Electrical machinery Radio & television Medical & Optical Motor vehicles
0 2 4 6
1990 2000 2010 2020 1990 2000 2010 2020 1990 2000 2010 2020
Other transport Furniture
0 2 4 6
1990 2000 2010 2020 1990 2000 2010 2020
Year
Comtrade Data, NACE codes 100−400 (Manufacture)
Trade-Induced Mortality Jérôme Adda and Yarine Fawaz 19/34Overview of the increase in Italian imports
from China across industries
Trade-Induced Mortality Jérôme Adda and Yarine Fawaz 19/34Overview of the increase in Italian imports
from China across industries
.6 Electric motors Electricity distribution Insulated wire
Imports CHN (billions of USD)
.4
.2
0
Accumulators Lighting equipment Other electrical equipment
.6
.4
.2
0
1990 2000 2010 2020 1990 2000 2010 2020 1990 2000 2010 2020
Year
Comtrade Data, NACE codes 310−319 (Electrical equipment)
Trade-Induced Mortality Jérôme Adda and Yarine Fawaz 19/34Overview of the increase in Italian imports
from China across industries
.6 Electric motors Electricity distribution Insulated wire
Imports CHN (billions of USD)
.4
.2
0
Accumulators Lighting equipment Other electrical equipment
.6
.4
.2
0
1990 2000 2010 2020 1990 2000 2010 2020 1990 2000 2010 2020
Year
Comtrade Data, NACE codes 310−319 (Electrical equipment)
Trade-Induced Mortality Jérôme Adda and Yarine Fawaz 19/34Descriptive Statistics
Italy US
Observations 9,992,527 2,334,710
Subjects 577,448 130,313
Number of deaths 26,432 12,585
Average age at death 59.3
Earliest entry 16 18
Oldest exit 88 90
Birth cohorts 1925-1996 1921-1994
Male 68% 65
Low education / social class 78% 61%
Trade-Induced Mortality Jérôme Adda and Yarine Fawaz 20/34Descriptive Statistics, Italy
Fabricated metal
Food products
Wearing apparel
Furniture
Machinery
Textiles
Non−metallic mineral
Leather
Electrical machinery
Rubber and plastic
Chemicals
Motor vehicles
Publishing & printing
Wood and wood products
Basic metals
Office machinery
Radio & television
Medical & Optical
Pulp & paper
Other transport
Mining and quarrying
Coke & petroleum
0 .2 .4 .6
Imports from CHN Share in sector
Note: Trade in 10 of billions USD in 2010.
Trade-Induced Mortality Jérôme Adda and Yarine Fawaz 21/34Descriptive Statistics, US
20:food
35:machine,computer
39:miscellaneous
34:metal II
27:printing
37:transport
36:electronic
28:chemicals
38:measuring instru
30:rubber
24:lumber
26:paper
33:metal I
32:stone
25:furniture
23:apparel
22:textile
29:petroleum
31:leather
21:tobacco
0 .2 .4 .6
Imports from CHN Share in sector
Note: Trade in 100 of billions USD in 2010.
Trade-Induced Mortality Jérôme Adda and Yarine Fawaz 22/34Descriptive Statistics, Survival
US: Italy:
Kaplan−Meier survival estimate Kaplan−Meier survival estimate
1.00
1.00
0.75
0.75
Proportion alive
Proportion alive
0.50
0.50
0.25
0.25 0.00
0.00
0 20 40 60 80 100 0 20 40 60 80
Age Age
I Life expectancy in the US is 77.4 for men and 82.2 for women.
I Life expectancy in Italy is 80.4 for men and 85.8 for women.
Trade-Induced Mortality Jérôme Adda and Yarine Fawaz 23/34Descriptive Statistics, hazard of death by educa-
tion / social class
US: Italy:
Smoothed hazard estimates Smoothed hazard estimates
.03
.04
Hazard of death
.03
.02
Hazard of death
.02
.01
.01
0
0
20 40 60 80 100
20 40 60 80 100 Age
Age
Blue collar worker Manager
High education Low education
White collar worker
I Marked gradient by social class in the two countries.
Trade-Induced Mortality Jérôme Adda and Yarine Fawaz 24/34Results: Impact of CHN imports on all-cause
mortality
Italy US
Lag 0 0.022 (0.027) -0.008 (-0.007)
Lag 1 0.044** (0.022) -0.004 (-0.009)
Lag 2 0.037 (0.025) 0.001 (-0.004)
Lag 3 0.035 (0.026) 0.007 (-0.005)
Lag 4 0.049** (0.020) 0.018** (-0.007)
Lag 5 0.067** (0.023) 0.019** (-0.008)
Lag 6 0.047 (0.039)
Lag 7 0.039 (0.059)
Note: Baseline hazard stratified by 3-digit sector codes, region of living
and gender. Regression controls for annual time dummies and are sepa-
rate by lags for imports (in billion USD). Standard errors in parentheses,
clustered at 3-digit industry level. * p < 0.10, ** p < 0.05, *** p < 0.01
Trade-Induced Mortality Jérôme Adda and Yarine Fawaz 25/34Aggregate Mortality Effects
I Italy: The baseline hazard of death is 0.001 on average. A one
std deviation change (one billion USD imports) in trade leads
to about 250 premature deaths per year.
I US: 330 deaths per year per billion USD imports.
Trade-Induced Mortality Jérôme Adda and Yarine Fawaz 26/34Heterogenous Effects, Italy
Blue Collars White Collars Managers
Lag 0 -0.002 (0.030) 0.120∗∗ (0.060) 0.388∗ (.211 )
Lag 1 0.022 (0.023) 0.123∗∗ (0.059) 0.544∗∗ (.245 )
Lag 2 0.012 (0.026) 0.109 (0.066) 0.832∗∗ (.394 )
Lag 3 0.014 (0.025) 0.102 (0.077) 0.624∗ (.357 )
Lag 4 0.023 (0.020) 0.133∗ (0.078) 0.678∗ (.408 )
Lag 5 0.042∗ (0.025) 0.135 (0.111) 0.951 (.682 )
Lag 6 0.021 (0.038) 0.127 (0.121) 0.999 (.633 )
Lag 7 0.025 (0.048) 0.076 (0.203) 0.741 (.593 )
Note: Baseline hazard stratified by NACE 3-digit sector codes, re-
gion of living and gender. Regression controls for annual time dum-
mies and are separate by lag and by occupational class. Standard
errors are clustered at NACE 3-digit level.
Trade-Induced Mortality Jérôme Adda and Yarine Fawaz 27/34Managers in small firms are hit hard in Italy
Imports Small Firms Large Firms
Lag 0 .501 (.325) .386∗ (.209)
Lag 1 .659 ∗∗∗ ( .22) .509∗ (.286)
Lag 2 .77∗∗∗ (.236) .662∗ (.376)
Lag 3 .688 ∗∗∗ (.232) .574 (.402)
Lag 4 .746∗∗∗ ( .21) .618 (.455)
Lag 5 .913∗∗ ( .42) .818 (.712)
Lag 6 .809 ∗∗ (.376) .715 (.686)
Lag 7 .64 (.491) .337 (.599)
Note: Small firms defined as having less than 50 employees. Baseline
hazard stratified by NACE 3-digit sector codes and gender. Regression
controls for annual time dummies and are separate by lags. Standard
errors are clustered at NACE 3-digit level.
Trade-Induced Mortality Jérôme Adda and Yarine Fawaz 28/34Imports and Cause of Death
I For the US, we have information on the cause of death at a very
fine level (recoded from ICD-10). We regroup causes together
into logical categories.
Trade-Induced Mortality Jérôme Adda and Yarine Fawaz 29/34Imports and Cause of Death
I For the US, we have information on the cause of death at a very
fine level (recoded from ICD-10). We regroup causes together
into logical categories.
I Example: Cancer related to tobacco regroups:lip, pharynx,
esophagus, pancreas, larynx, trachea, bronchus, lung, kidney,
bladder, cervix uteri, but no brain cancer, leukemia, etc.
Trade-Induced Mortality Jérôme Adda and Yarine Fawaz 29/34Imports and Cause of Death
I For the US, we have information on the cause of death at a very
fine level (recoded from ICD-10). We regroup causes together
into logical categories.
I Example: Cancer related to tobacco regroups:lip, pharynx,
esophagus, pancreas, larynx, trachea, bronchus, lung, kidney,
bladder, cervix uteri, but no brain cancer, leukemia, etc.
Cause Freq. Percent Cum.
alive 117,728 90.34 90.34
cardio 3,813 2.93 93.27
cirrhos 270 0.21 93.48
homicide 95 0.07 93.55
motor 366 0.28 93.83
neopl no tob 2,297 1.76 95.59
neopl tob 2,105 1.62 97.21
other 2,311 1.77 98.98
respi 876 0.67 99.65
suicide 452 0.35 100
Total 130,313 100
Trade-Induced Mortality Jérôme Adda and Yarine Fawaz 29/34Results: Impact of CHN imports on cause-specific mortality.
all suicide cirrhos motor cancer tob respi
TradeL4 0.018** 0.238** 0.168** 0.055 0.005 0.352**
(0.007) (0.109) (0.079) (0.047) (0.018) (0.140)
N 2,058,647
Note: Baseline hazard stratified by 3-digit sector codes, commuting zones, gender, race, education
and self-assessed health. Regression controls for annual time dummies and are separate by lags.
Standard errors clustered at industry 3-digit sector.
Trade-Induced Mortality Jérôme Adda and Yarine Fawaz 30/34Results: Impact of CHN imports on cause-specific mortality.
all suicide cirrhos motor cancer tob respi
TradeL4 0.018** 0.238** 0.168** 0.055 0.005 0.352**
(0.007) (0.109) (0.079) (0.047) (0.018) (0.140)
N 2,058,647
all suicide cirrhos motor cancer tob respi
TradeL5 0.019** 0.294*** 0.141 0.101 0.022 0.392***
(0.008) (0.102) (0.092) (0.071) (0.020) (0.146)
N 2,058,647
Note: Baseline hazard stratified by 3-digit sector codes, commuting zones, gender, race, education
and self-assessed health. Regression controls for annual time dummies and are separate by lags.
Standard errors clustered at industry 3-digit sector.
Trade-Induced Mortality Jérôme Adda and Yarine Fawaz 30/34Results:Differential impact of CHN imports on cause-specific mortal-
ity
all suicide cirrhos motor cancer tob respi
TradeL4 0.021*** 4.616* 0.513* 0.076** 0.064*** 1.278***
(0.005) (2.373) (0.269) (0.033) (0.017) (0.441)
TradeL4∗Low educ -0.009 -4.429*** -0.397 -0.097 -0.102** -0.975**
(0.018) (2.384) (0.254) (0.128) (0.047) (0.423)
N 2,058,647
Note: Baseline hazard stratified by 3-digit sector codes, commuting zones, gender, race, education and
self-assessed health. Regression controls for annual time dummies and are separate by lags. Standard
errors clustered at industry 3-digit sector.
Trade-Induced Mortality Jérôme Adda and Yarine Fawaz 31/34The Geography of Death
1 We compute the trade induced mortality, based on our
preferred econometric specification (5 lags). We combine data
on the number of workers per area, by 2-digit sector codes,
gender and social class/education.
2 We assign to each individual the Chinese imports in the sector
they are observed in. We allow for different baseline hazard,
according to demographic characterisitics.
3 We then aggregate over individuals within area to compute
the additional deaths due to the change in imports over the
period we consider.
4 Geographical variations in premature mortality comes from
variation in population density, in social class and in variation
in sectors, more or less exposed to imports.
Trade-Induced Mortality Jérôme Adda and Yarine Fawaz 32/34The Geography of Death, Italy 1993-2010
Additional Deaths
8 − 53
4−8
1−4
0−1
Trade-Induced Mortality Jérôme Adda and Yarine Fawaz 33/34Conclusion
I We use public and restricted-use data for two countries
merged with series of imports at a very fine industry level.
I We find similar effects across countries of imports on
mortality in the manufacturing sector.
I The peak effect appears after 4-6 years.
I Detailed data on occupation in Italy allows us to show the
particular burden on small firm managers.
I Detailed data on cause of death in the US shows that imports
lead to an increase in suicides, cirrhosis and respiratory
diseases.
Trade-Induced Mortality Jérôme Adda and Yarine Fawaz 34/34You can also read


